


 |
市場調查報告書
商品編碼
2125512
美國行動網路營運商(MNO):市場佔有率分析、產業趨勢與統計數據、成長預測(2026-2031 年)US Telecom MNO - Market Share Analysis, Industry Trends & Statistics, Growth Forecasts (2026 - 2031) |
||||||

※ 本網頁內容可能與最新版本有所差異。詳細情況請與我們聯繫。
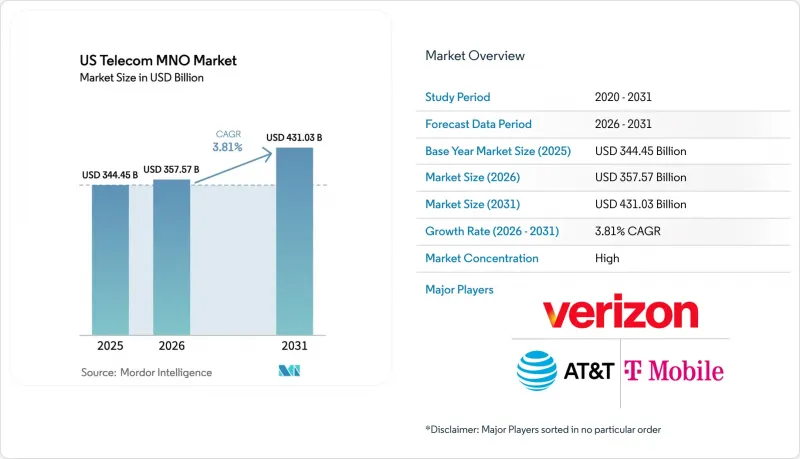
根據 Mordor Intelligence 估計,美國行動網路營運商 (MNO) 市場在 2026 年的價值將達到 3,575.7 億美元,高於 2025 年的 3,444.5 億美元,預計到 2031 年將達到 4,310.3 億美元。
預計 2026 年至 2031 年的複合年成長率為 3.81%。
本報告按服務類型(語音服務、數據和網際網路服務、通訊服務、物聯網和機器對機器(M2M)服務、OTT和付費電視服務以及其他服務)和最終用戶(企業和消費者)進行分類。市場預測以價值(美元)和數量(用戶數)為單位呈現。
美國行動網路營運商 (MNO) 市場的趨勢和洞察
5G獨立組網(SA)核心網的部署將加速資料貨幣化。
全面過渡到獨立組網 (SA) 架構使營運商能夠建立虛擬網路切片,從而保證延遲和吞吐量,實現傳統非獨立組網 (NSA) 部署無法實現的服務差異化。 T-Mobile 已將公共安全網路切片商業化,每年產生 2 億美元的經常性收入;Verizon 則利用 SA 為製造機器人提供低於 10 毫秒的邊緣工作負載支援。企業合約通常包含 API 介面,允許開發人員將運營商級身份驗證和收費功能直接整合到他們的應用程式中。預計到 2028 年,這將帶來 200 億美元的平台收入。高價值網路切片的價值相當於消費者行動寬頻平均每用戶收入 (ARPU) 的 3 到 5 倍,這將直接推動美國行動網路營運商 (MNO) 市場的發展。
固定無線存取(FWA)將取代傳統的銅線。
2024年底,美國固定無線接取(FWA)用戶數將超過1000萬。這主要得益於中頻段和C頻段,使得農村地區的平均下行速度可達300Mbps。這項服務直接取代了老舊的DSL和同軸電纜用戶,填補了光纖覆蓋的空白,並加速了營運商在5G無線設備方面的投資回報。 FWA也有助於提升家庭配套服務,當用戶已連接家庭網路時,無線業者增加行動線路的比例提高了18%。由於人口密集的郊區容量有限,主動天線的擴展和頻率共用演算法的引入正在推進,但與地下鋪設相比,這些方案在經濟上仍然可行。隨著用戶數量的快速成長,到2027年,美國行動網路營運商(MNO)市場的複合年成長率將提高0.8個百分點。
預付市場的通貨膨脹給每位用戶平均收入 (ARPU) 帶來壓力。
能源和人事費用的上漲迫使電信公司提高套餐價格,但預付用戶如果月費上漲超過5美元,往往會立即取消訂閱。 AT&T在2025年的漲價暫時推高了預付合約的解約率190個基點,迫使各公司增加信貸和行銷成本以客戶維繫。目前,電信公司正在擴大捆綁套餐,包括內容套餐、大資料方案以及「先買後付」的設備分期付款計劃,以維持用戶數量,這將在短期內使EBITDA獲利率下降40至60個基點。
細分市場分析
2025年,數據與網路業務佔總營收的53.12%,成為美國行動網路營運商(MNO)市場最大的收入來源。無限流量智慧型手機方案、固定無線存取(FWA)訂閱以及企業專用接取服務,共同推動每用戶行動數據流量較去年同期成長7.8%。利用載波聚合技術的優質套餐在2025年的現場測試中實現了5.5 Gbps的吞吐量,鞏固了其速度領先地位,也證明了其價格差異的合理性。由於OTT(Over-The-Top)服務的普及,語音和簡訊的使用量出現兩位數下降,導致構成比合計低於10%。同時,物聯網(IoT)和機器對機器(M2M)服務實現了最快的成長,這得益於新增的3,000萬個授權蜂窩終端以及工廠、港口和醫院等場所專用網路部署的激增。到 2031 年,該細分市場的複合年成長率將達到 3.92%,這將成為長期成長要素,抵消傳統網路業務的萎縮,從而維持美國電信行動網路營運商市場的擴張。
企業資料合約日益要求基於服務等級協定 (SLA) 的吞吐量和網路切片隔離,這些要求帶來了比消費線路更高的利潤率和更長的合約期限。批發漫遊和與虛擬網路營運商 (MVNO) 的合作增加了收入,主要用於在非高峰時段攤銷頻率資產。內建於自最佳化網路中的進階分析功能可將功耗降低約 15%,從而可以將降低的營運成本 (OPEX) 再投資於增設小規模基地台,進一步加強整個美國行動網路營運商 (MNO) 市場的以數據為中心的企業發展。
其他好處:
- Excel格式的市場預測(ME)表
- 3個月的分析師支持
目錄
第1章:引言
- 研究假設和市場定義
- 調查範圍
第2章:調查方法
第3章執行摘要
第4章 市場狀況
- 市場概覽
- 監理與政策框架
- 頻段狀況和競爭對手擁有情形
- 通訊業生態系統
- 宏觀經濟與外在因素
- 波特五力分析
- 主要行動網路營運商 (MNO) 的關鍵績效指標 (KPI) (2020-2025)
- 行動用戶數量和普及率
- 行動網路使用者數量和普及率
- 按接入技術分類的SIM卡合約數量和滲透率
- 蜂巢式物聯網/機器對機器連接數
- 寬頻連線數(移動和固定)
- ARPU(每位用戶平均收入)
- 每用戶平均數據使用量(GB/月)
- 市場促進因素
- 5G獨立核心網路的部署將加速資料貨幣化。
- 固定無線存取(FWA)將取代傳統的銅線。
- 僅支援 eSIM 的設備發布簡化了取消流程。
- 聯邦政府的 BEAD 中程津貼正在促進地方地區的網路發展。
- 工業物聯網和園區網路推動了私有蜂窩網路的需求。
- 透過人工智慧驅動的無線接取網最佳化降低營運成本
- 市場限制因素
- 預付市場的通貨膨脹給每位用戶平均收入 (ARPU) 帶來壓力。
- 光纖電纜的過度鋪設會降低光纖廣域網路 (FWA) 的獲利能力。
- C波段航空領域的緩和成本
- FCC加強對併購交易的監管。
- 技術展望
- 電信業關鍵經營模式分析
- 定價模型和定價分析
第5章 市場規模與成長預測
- 整個通訊業的收入和每用戶平均收入
- 按服務類型
- 語音服務
- 數據網際網路服務
- 通訊服務
- 物聯網/機器對機器服務
- OTT(非櫃檯)和付費電視服務
- 其他服務(附加價值服務、漫遊和國際服務、企業和批發服務等)
- 最終用戶
- 企業
- 消費者
第6章 競爭情勢
- 市場集中度
- 主要供應商的策略性舉措和投資(2023-2025 年)
- 2024年行動通訊業者(MNO)市佔率分析
- Product Benchmarking Analysis for mobile network services
- MNO snapshot(subscribers, churn rate, ARPU, etc.)
- 行動通訊業者(MNO)公司簡介
- Verizon Communications Inc.
- AT&T Inc.
- T-Mobile US, Inc.
第7章 市場機會與未來展望
According to Mordor Intelligence, US telecom MNO market size in 2026 is estimated at USD 357.57 billion, growing from 2025 value of USD 344.45 billion with 2031 projections showing USD 431.03 billion, growing at 3.81% CAGR over 2026-2031.
This report is Segmented by Service Type (Voice Services, Data and Internet Services, Messaging Services, Iot and M2M Services, OTT and PayTV Services, and Other Services), and End User (Enterprises, Consumer). The Market Forecasts are Provided in Terms of Value (USD) and Volume (Subscribers).
US Telecom MNO Market Trends and Insights
5G Stand-Alone Core Roll-outs Accelerating Data Monetization
Full migration to stand-alone (SA) architecture allows carriers to create virtual slices that guarantee latency and throughput, adding service differentiation unavailable on legacy non-stand-alone deployments. T-Mobile commercialized public-safety slices that already contribute USD 200 million in recurring annual revenue, while Verizon leverages SA to support sub-10 millisecond edge workloads for manufacturing robotics . Enterprise deals often bundle API exposure so developers can embed carrier-grade authentication and billing directly into applications, a pathway to an estimated USD 20 billion platform revenue pool by 2028 . Higher-value network slices translate into 3-5 times the ARPU of mass-market mobile broadband, directly lifting the US Telecom MNO market.
Fixed-Wireless Access (FWA) Displacing Legacy Copper
National FWA subscriptions crossed the 10 million mark by end-2024 as mid-band and C-band spectrum enabled 300 Mbps average downlink in rural clusters. The product directly cannibalizes outdated DSL and coax footprints, fills fiber coverage gaps, and accelerates operators' payback on 5G radios. FWA also strengthens household bundling, with wireless carriers attaching mobile lines at an 18% higher rate when a home internet account is present. Capacity constraints in dense suburbs trigger active-antenna expansions and spectrum-sharing algorithms, yet economics remain favorable relative to trenching. Rapid customer growth adds 0.8 percentage points to the US Telecom MNO market CAGR through 2027.
Inflation-Induced ARPU Pressure in Prepaid
Elevated energy and labor expenses compel carriers to raise plan prices, yet prepaid customers exhibit immediate churn when monthly bills climb by more than USD 5. AT&T's 2025 upward revisions triggered a temporary 190-basis-point increase in prepaid churn, forcing larger retention credits and marketing spend. Operators now extend inclusive content bundles, high-data allotments, and buy-now-pay-later device financing to defend subscriber counts, trimming EBITDA margin by 40-60 basis points over the near term.
Other drivers and restraints analyzed in the detailed report include:
- eSIM-Only Device Launches Simplifying Churn
- Federal BEAD and Middle-Mile Grants Stimulating Rural Build-outs
- Fiber Over-builds Eroding FWA Economics
For complete list of drivers and restraints, kindly check the Table Of Contents.
Segment Analysis
The data and internet category represented 53.12% of 2025 revenue, delivering the single-largest contribution to the US Telecom MNO market size. Unlimited smartphone plans, FWA subscriptions, and enterprise dedicated access collectively underpinned a 7.8% uplift in mobile data traffic per user year-on-year. Premium tiers exploiting carrier aggregation hit verified 5.5 Gbps throughput during 2025 field tests, reinforcing perceived speed leadership and justifying price differentials. Voice and SMS collectively fell below 10% revenue share as over-the-top substitutes drove double-digit usage declines. Meanwhile, IoT and M2M services posted the fastest trajectory, supported by 30 million incremental licensed cellular endpoints and a swelling pipeline of private network installs inside factories, ports, and hospitals. The sub-segment's 3.92% CAGR through 2031 adds a long-run lift that offsets eroding legacy lines, thereby sustaining expansion in the US Telecom MNO market.
Enterprise data contracts increasingly request SLA-backed throughput and network-slice isolation, commands that draw higher margins and longer-term commitments than consumer lines. Wholesale roaming and virtual operator partnerships add incremental revenue but primarily serve to amortize spectrum assets during off-peak hours. Advanced analytics embedded in self-optimizing networks slash power draw by around 15% and thereby release opex for reinvestment in additional small cells, further reinforcing data-centric positioning across the US Telecom MNO market.
Complete Report Scope:
- Overall Telecom Revenue and ARPU
- Service Type
- Voice Services
- Data and Internet Services
- Messaging Services
- IoT and M2M Services
- OTT and PayTV Services
- Other Services (VAS, Roaming and International Services, Enterprise and Wholesale Services, etc.)
- End-user
- Enterprises
- Consumer
List of Companies Covered in this Report:
- Verizon Communications Inc.
- AT&T Inc.
- T-Mobile US, Inc.
Additional Benefits:
- The market estimate (ME) sheet in Excel format
- 3 months of analyst support
TABLE OF CONTENTS
1 INTRODUCTION
- 1.1 Study Assumptions and Market Definition
- 1.2 Scope of the Study
2 RESEARCH METHODOLOGY
3 EXECUTIVE SUMMARY
4 MARKET LANDSCAPE
- 4.1 Market Overview
- 4.2 Regulatory and Policy Framework
- 4.3 Spectrum Landscape and Competitive Holdings
- 4.4 Telecom Industry Ecosystem
- 4.5 Macroeconomic and External Drivers
- 4.6 Porter's Five Forces Analysis
- 4.6.1 Competitive Rivalry
- 4.6.2 Threat of New Entrants
- 4.6.3 Bargaining Power of Suppliers
- 4.6.4 Bargaining Power of Buyers
- 4.6.5 Threat of Substitutes
- 4.7 Key MNO KPIs (2020-2025)
- 4.7.1 Unique Mobile Subscribers and Penetration Rate
- 4.7.2 Mobile Internet Users and Penetration Rate
- 4.7.3 SIM Connections by Access Technology and Penetration
- 4.7.4 Cellular IoT / M2M Connections
- 4.7.5 Broadband Connections (Mobile and Fixed)
- 4.7.6 ARPU (Average Revenue Per User)
- 4.7.7 Average Data Usage per Subscription (GB/month)
- 4.8 Market Drivers
- 4.8.1 5G Stand-Alone Core Roll-outs Accelerating Data-Monetization
- 4.8.2 Fixed-Wireless Access (FWA) Displacing Legacy Copper
- 4.8.3 eSIM-Only Device Launches Simplifying Churn
- 4.8.4 Federal BEAD and Middle-Mile Grants Stimulating Rural Build-outs
- 4.8.5 Private-Cellular Demand from IIoT and Campus Networks
- 4.8.6 AI-Driven RAN Optimization Lowering OPEX
- 4.9 Market Restraints
- 4.9.1 Inflation-Induced ARPU Pressure in Pre-paid
- 4.9.2 Fiber Over-builds Eroding FWA Economics
- 4.9.3 C-Band Aviation Mitigation Costs
- 4.9.4 Heightened FCC Scrutiny on MandA
- 4.10 Technological Outlook
- 4.11 Analysis of key business models in Telecom Sector
- 4.12 Analysis of Pricing Models and Pricing
5 MARKET SIZE AND GROWTH FORECASTS (VALUE)
- 5.1 Overall Telecom Revenue and ARPU
- 5.2 Service Type
- 5.2.1 Voice Services
- 5.2.2 Data and Internet Services
- 5.2.3 Messaging Services
- 5.2.4 IoT and M2M Services
- 5.2.5 OTT and PayTV Services
- 5.2.6 Other Services (VAS, Roaming and International Services, Enterprise and Wholesale Services, etc.)
- 5.3 End-user
- 5.3.1 Enterprises
- 5.3.2 Consumer
6 COMPETITIVE LANDSCAPE
- 6.1 Market Concentration
- 6.2 Strategic Moves and Investments by key vendors, 2023-2025
- 6.3 Market share analysis for MNOs, 2024
- 6.4 Product Benchmarking Analysis for mobile network services
- 6.5 MNO snapshot (subscribers, churn rate, ARPU, etc.)
- 6.6 Company Profiles* of MNOs (Includes Business Overview | Service Portfolio | Financials | Business Strategy and Recent Developments | SWOT Analysis)
- 6.6.1 Verizon Communications Inc.
- 6.6.2 AT&T Inc.
- 6.6.3 T-Mobile US, Inc.
7 MARKET OPPORTUNITIES AND FUTURE OUTLOOK
- 7.1 White-space and Unmet-Need Assessment

 中國行動網路業者(MNO):市佔率分析、產業趨勢與統計及成長預測(2026-2031)東協行動虛擬網路營運商:市場佔有率分析、產業趨勢與統計及成長預測(2026-2031)西班牙電信行動網路業者:市場佔有率分析、產業趨勢與統計、成長預測(2026-2031)馬來西亞電信行動網路業者:市場佔有率分析、產業趨勢與統計及成長預測(2026-2031 年)中東和非洲電信營運商(MNO):市場佔有率分析、行業趨勢和統計數據以及成長預測(2026-2031 年)印度電信行動網路業者:市場佔有率分析、產業趨勢與統計及成長預測(2026-2031 年)德國電信行動網路業者:市場佔有率分析、產業趨勢與統計及成長預測(2026-2031 年)日本行動網路業者(MNO):市佔率分析、產業趨勢與統計及成長預測(2026-2031)法國電信行動網路業者:市場佔有率分析、產業趨勢與統計及成長預測(2026-2031 年)義大利行動網路營運商(MNO):市場佔有率分析、產業趨勢和統計數據以及成長預測(2026-2031 年)