

 |
市場調查報告書
商品編碼
2116873
日本行動網路業者(MNO):市佔率分析、產業趨勢與統計及成長預測(2026-2031)Japan Telecom MNO - Market Share Analysis, Industry Trends & Statistics, Growth Forecasts (2026 - 2031) |
||||||

※ 本網頁內容可能與最新版本有所差異。詳細情況請與我們聯繫。
根據 Mordor Intelligence 預測,日本行動網路營運商 (MNO) 市場規模預計將在 2026 年達到 1,259.8 億美元,到 2031 年達到 1,480.6 億美元,2026 年至 2031 年的複合年成長率為 3.28%。
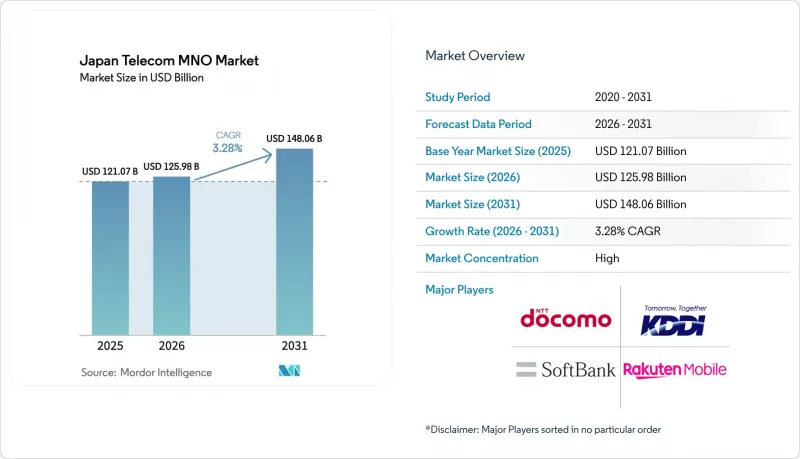
本報告按服務類型(語音服務、數據和網際網路服務、通訊服務、物聯網和機器對機器服務、OTT和付費電視服務以及其他服務)和最終用戶(企業和消費者)進行分類。市場預測以貨幣價值(美元)和用戶數)兩種形式呈現。
日本電信行動網路營運商市場的趨勢與洞察
5G獨立組網(SA)的擴展與專用網路的貨幣化
NTT Docomo於2025年初推出6.6Gbps下行鏈路服務,該服務整合了6GHz以下頻段和毫米波頻段,並演示了即時8K影片串流和機器視覺控制。各公司正在申請n79頻段的授權,用於機器人、半導體製造設備和智慧物流等領域。內務部的註冊制度為此提供了支持,該制度強制要求電信業者任命經認證的首席電信工程師,這項機制旨在保護現有業者的利潤率。 2024年底,軟銀與愛立信合作開展了一項延遲最佳化演示實驗,實現了低於5毫秒的往返延遲,凸顯了獨立核心網作為確定性工業流量收入來源的重要性。內務部的《2025年超越5G白皮書》預測,到2030年,企業專用網路將佔行動基礎設施總投資的15%。
超高清影片和XR數據流量的爆炸性成長
2025年5月,固網流量年增15.3%,行動網路使用量也因5G設備的普及而同步成長。 MIC預測,到2030年,身臨其境型將使流量激增十倍,迫使營運商增加小型基地台的密度並部署邊緣運算。 NTT Docomo發布的2025會計年度中期財務報告顯示,其資料通訊流量實現了兩位數成長,這主要得益於其高階無限流量套餐。愛立信發布的2025年中期行動報告指出,人工智慧驅動的頻寬分配是處理即時XR流非對稱上行鏈路的關鍵。將串流媒體和元宇宙存取捆綁到分級套餐中,可以讓營運商在不增加相應成本的情況下提升銷售,前提是內容傳送快取的位置更靠近用戶。
人口老化和人口下降正在抑制用戶數量的成長。
到2025年,日本人口將降至1.23億以下,中位數年齡將超過49歲,行動電話用戶數量的自然成長速度也將放緩。行動電話線路數量將維持在1.93億條,除物聯網領域外,其他領域的成長空間將十分有限。 2025年初,樂天移動的850萬用戶面臨流失風險,因為價格敏感型顧客會轉向宣傳活動。儘管營運商正在為老年人量身定做語音助手,但由此產生的數據收入微乎其微。將於2025年生效的《內務部行動軟體競爭法》將強化號碼可攜性,提高價格敏感度,並降低顧客忠誠度。
細分市場分析
到2025年,數據和網路服務將佔總收入的一半以上,這主要得益於9,236.7萬5G用戶以及固定寬頻流量兩位數的成長。物聯網和機器對機器(M2M)服務相關的市場規模預計將以3.44%的複合年成長率(CAGR)快速成長,這主要得益於車隊遠端資訊處理、工業機器人以及用於農村智慧城市的感測器。 KDDI ConnectIN的4550萬條線路以及NTT Docomo面向企業的SIGN IoT部署也印證了這一趨勢。隨著OTT應用程式的普及,語音通話和簡訊的使用量持續下降,但配套服務透過授權加值內容,正在緩解平均每用戶收入(ARPU)的下滑。
電信業者目前正將網路API打包到開發者市場中,這項措施與GSMA的開放閘道框架相契合,KDDI曾在2025年世界行動通訊大會上對此進行了展示。儘管日本電信行動網路營運商(MNO)的API市場仍處於起步階段,但全球預測顯示,到2030年,該市場規模將達到3,000億美元。 《電訊業務法》下的互聯互通法規在一定程度上減緩了創新步伐,但同時也確保了批發價格的非歧視性,並在競爭與穩定之間維持了平衡。
其他好處:
- Excel格式的市場預測(ME)表
- 3個月的分析師支持
目錄
第1章:引言
- 研究假設和市場定義
- 調查範圍
第2章:調查方法
第3章執行摘要
第4章 市場狀況
- 市場概覽
- 監理與政策框架
- 頻段狀況和競爭對手擁有情形
- 通訊業生態系統
- 宏觀經濟與外在因素
- 波特五力分析
- 主要行動網路營運商 (MNO) 的關鍵績效指標 (KPI) (2020-2025)
- 行動用戶數量和普及率
- 行動網路使用者數量和普及率
- 按接入技術分類的SIM卡合約數量和滲透率
- 蜂巢式物聯網和機器對機器(M2M)連接
- 寬頻連線數(移動和固定)
- ARPU(每位用戶平均收入)
- 用戶平均每月數據使用量(GB/月)
- 市場促進因素
- 5G獨立組網的擴展和專用網路的商業化
- 超高清影片和XR數據流量的爆炸性成長
- 「數位花園城市國家策略」旨在促進物聯網在地方社區的應用。
- 固定電話和行動服務的整合正在推動高階套餐ARPU的成長。
- 衛星和行動電話混合通訊許可製度的建立,將開拓區域市場。
- 利用 GMA 開放閘道器框架實現網路 API 貨幣化
- 市場限制因素
- 人口老化和人口下降正在抑制用戶數量的成長。
- 政府持續施壓降低利率,導致每位用戶平均收入下降。
- 向碳中和的能源轉型正在推高電網的總擁有成本(TCO)。
- 供應鏈安全法規正在減緩開放式無線接取網路(Open RAN)的普及。
- 技術展望
- 電信業關鍵經營模式分析
- 定價模型和定價分析
第5章 市場規模與成長預測
- 整個通訊業的收入和每用戶平均收入
- 按服務類型
- 語音服務
- 數據網際網路服務
- 通訊服務
- 物聯網/機器對機器服務
- OTT(非櫃檯)和付費電視服務
- 其他服務(漫遊和國際服務、企業和批發服務)
- 最終用戶
- 公司
- 消費者
第6章 競爭情勢
- 市場集中度
- 主要供應商的策略性舉措和投資(2023-2025 年)
- 2025年行動通訊業者(MNO)市佔率分析
- Product Benchmarking Analysis for Mobile Network Services
- MNO Snapshot(Subscribers, Churn Rate, ARPU, etc.)
- 行動通訊業者(MNO)公司簡介
- NTT Docomo, Inc.
- KDDI Corporation
- SoftBank Corp.
- Rakuten Mobile, Inc.
第7章 市場機會與未來展望
According to Mordor Intelligence, the Japan telecom MNO market size is projected to be USD 125.98 billion in 2026 and reach USD 148.06 billion by 2031, growing at a CAGR of 3.28% from 2026 to 2031.
This report is Segmented by Service Type (Voice Services, Data and Internet Services, Messaging Services, Iot and M2M Services, OTT and PayTV Services, and Other Services), and End User (Enterprises, Consumer). The Market Forecasts are Provided in Terms of Value (USD) and Volume (Subscribers).
Japan Telecom MNO Market Trends and Insights
5G Standalone Expansion and Private Network Monetization
NTT Docomo activated 6.6 Gbps downlink service in early 2025 by aggregating sub-6 GHz and millimeter-wave bands, showcasing real-time 8K video and machine-vision control. Enterprises are licensing n79 spectrum slices for robotics, semiconductor tooling, and smart logistics, supported by the Ministry of Internal Affairs and Communications (MIC) registration regime that obliges carriers to appoint certified chief telecommunication engineers, a structure that protects incumbents' margins. SoftBank's latency-optimization trial with Ericsson in late 2024 achieved sub-5 ms round-trip delay, bolstering standalone cores as revenue generators for deterministic industrial traffic. MIC's 2025 Beyond 5G white paper projects enterprise private networks to absorb 15% of total mobile infrastructure outlays by 2030.
Explosion of Ultra-HD Video and XR Data Traffic
Fixed-line traffic jumped 15.3% year-over-year in May 2025, while 5G handset growth lifted mobile usage in parallel. MIC forecasts immersive content to push volumes ten-fold by 2030, forcing operators to densify small cells and deploy edge computers. NTT Docomo's fiscal-2025 interim report logged double-digit data growth, with premium unlimited tiers shielding ARPU. Ericsson's mid-2025 Mobility Report cites artificial-intelligence spectrum allocation as key to handling asymmetric uplinks from live XR streams. Bundling streaming or metaverse access into tiered plans lets carriers upsell without proportional cost, provided content-delivery caches sit close to users.
Aging and Declining Population Limiting Subscriber Growth
Japan's population fell below 123 million in 2025 with a median age above 49, trimming organic handset uptake. Cellular lines stood at 193 million, leaving scant headroom outside IoT. Rakuten Mobile's 8.5 million users in early 2025 faced churn as price hunters rotated to promotions. Operators tailor elder-care voice assistants, yet these generate modest data income. MIC's Mobile Software Competition Act, effective 2025, enhances portability, boosting price sensitivity and eroding loyalty.
Other drivers and restraints analyzed in the detailed report include:
- Digital Garden City Nation Strategy Catalyzing Regional IoT Uptake
- Fixed-Mobile Convergence Driving Premium Bundled ARPU
- Continued Government Pressure on Tariffs Depressing ARPU
For complete list of drivers and restraints, kindly check the Table Of Contents.
Segment Analysis
Data and Internet Services accounted for over half of 2025 revenue, supported by 92.367 million 5G subscriptions and double-digit fixed broadband traffic growth. The Japan telecom MNO market size tied to IoT and M2M Services is forecast to expand fastest at a 3.44% CAGR thanks to fleet telematics, industrial robotics, and rural smart-city sensors, a trajectory underscored by KDDI ConnectIN's 45.5 million lines and NTT Docomo's business SIGN IoT rollout. Voice and SMS continue to shrink as over-the-top applications dominate, while pay-TV bundles cushion ARPU through premium content licensing.
Operators are now packaging network APIs into developer marketplaces, an initiative aligned with the GSMA Open Gateway framework demonstrated by KDDI at Mobile World Congress 2025. The Japan telecom MNO market size for these APIs remains nascent, yet global projections reach USD 300 billion by 2030. Regulatory oversight of interconnection under the Telecommunications Business Law tempers innovation velocity but ensures nondiscriminatory wholesale pricing, balancing competition and stability.
Complete Report Scope:
- Overall Telecom Revenue and ARPU
- Service Type
- Voice Services
- Data and Internet Services
- Messaging Services
- IoT and M2M Services
- OTT and PayTV Services
- Other Services, Roaming and International Services, Enterprise and Wholesale Services
- End-User
- Enterprises
- Consumer
List of Companies Covered in this Report:
- NTT Docomo, Inc.
- KDDI Corporation
- SoftBank Corp.
- Rakuten Mobile, Inc.
Additional Benefits:
- The market estimate (ME) sheet in Excel format
- 3 months of analyst support
TABLE OF CONTENTS
1 INTRODUCTION
- 1.1 Study Assumptions and Market Definition
- 1.2 Scope of the Study
2 RESEARCH METHODOLOGY
3 EXECUTIVE SUMMARY
4 MARKET LANDSCAPE
- 4.1 Market Overview
- 4.2 Regulatory and Policy Framework
- 4.3 Spectrum Landscape and Competitive Holdings
- 4.4 Telecom Industry Ecosystem
- 4.5 Macroeconomic and External Drivers
- 4.6 Porter's Five Forces Analysis
- 4.6.1 Competitive Rivalry
- 4.6.2 Threat of New Entrants
- 4.6.3 Bargaining Power of Suppliers
- 4.6.4 Bargaining Power of Buyers
- 4.6.5 Threat of Substitutes
- 4.7 Key MNO KPIs (2020-2025)
- 4.7.1 Unique Mobile Subscribers and Penetration Rate
- 4.7.2 Mobile Internet Users and Penetration Rate
- 4.7.3 SIM Connections by Access Technology and Penetration
- 4.7.4 Cellular IoT and M2M Connections
- 4.7.5 Broadband Connections (Mobile and Fixed)
- 4.7.6 ARPU (Average Revenue per User)
- 4.7.7 Average Data Usage per Subscription (GB/month)
- 4.8 Market Drivers
- 4.8.1 5G Standalone Expansion and Private Network Monetization
- 4.8.2 Explosion of Ultra-HD Video and XR Data Traffic
- 4.8.3 Digital Garden City Nation Strategy Catalyzing Regional IoT Uptake
- 4.8.4 Fixed-Mobile Convergence Driving Premium Bundled ARPU
- 4.8.5 Satellite-Cellular Hybrid Connectivity Licenses Opening Rural Markets
- 4.8.6 Monetization of Network APIs via GSMA Open Gateway Framework
- 4.9 Market Restraints
- 4.9.1 Aging and Declining Population Limiting Subscriber Growth
- 4.9.2 Continued Government Pressure on Tariffs Depressing ARPU
- 4.9.3 Carbon-Neutral Energy Transition Elevating Network TCO
- 4.9.4 Supply Chain Security Rules Slowing Open RAN Deployment
- 4.10 Technological Outlook
- 4.11 Analysis of Key Business Models in Telecom Sector
- 4.12 Analysis of Pricing Models and Pricing
5 MARKET SIZE AND GROWTH FORECASTS (VALUE)
- 5.1 Overall Telecom Revenue and ARPU
- 5.2 Service Type
- 5.2.1 Voice Services
- 5.2.2 Data and Internet Services
- 5.2.3 Messaging Services
- 5.2.4 IoT and M2M Services
- 5.2.5 OTT and PayTV Services
- 5.2.6 Other Services, Roaming and International Services, Enterprise and Wholesale Services
- 5.3 End-User
- 5.3.1 Enterprises
- 5.3.2 Consumer
6 COMPETITIVE LANDSCAPE
- 6.1 Market Concentration
- 6.2 Strategic Moves and Investments by Key Vendors, 2023-2025
- 6.3 Market Share Analysis for MNOs, 2025
- 6.4 Product Benchmarking Analysis for Mobile Network Services
- 6.5 MNO Snapshot (Subscribers, Churn Rate, ARPU, etc.)
- 6.6 Company Profiles of MNOs (Includes Business Overview, Service Portfolio, Financials, Business Strategy and Recent Development, SWOT Analysis)
- 6.6.1 NTT Docomo, Inc.
- 6.6.2 KDDI Corporation
- 6.6.3 SoftBank Corp.
- 6.6.4 Rakuten Mobile, Inc.
7 MARKET OPPORTUNITIES AND FUTURE OUTLOOK
- 7.1 White-Space and Unmet-Need Assessment

 中國行動網路業者(MNO):市佔率分析、產業趨勢與統計及成長預測(2026-2031)東協行動虛擬網路營運商:市場佔有率分析、產業趨勢與統計及成長預測(2026-2031)西班牙電信行動網路業者:市場佔有率分析、產業趨勢與統計、成長預測(2026-2031)馬來西亞電信行動網路業者:市場佔有率分析、產業趨勢與統計及成長預測(2026-2031 年)中東和非洲電信營運商(MNO):市場佔有率分析、行業趨勢和統計數據以及成長預測(2026-2031 年)印度電信行動網路業者:市場佔有率分析、產業趨勢與統計及成長預測(2026-2031 年)德國電信行動網路業者:市場佔有率分析、產業趨勢與統計及成長預測(2026-2031 年)法國電信行動網路業者:市場佔有率分析、產業趨勢與統計及成長預測(2026-2031 年)美國行動網路營運商(MNO):市場佔有率分析、產業趨勢與統計數據、成長預測(2026-2031 年)義大利行動網路營運商(MNO):市場佔有率分析、產業趨勢和統計數據以及成長預測(2026-2031 年)