


 |
市場調查報告書
商品編碼
2124517
太陽能:市場佔有率分析、產業趨勢與統計、成長預測(2026-2031)Solar Energy - Market Share Analysis, Industry Trends & Statistics, Growth Forecasts (2026 - 2031) |
||||||

※ 本網頁內容可能與最新版本有所差異。詳細情況請與我們聯繫。
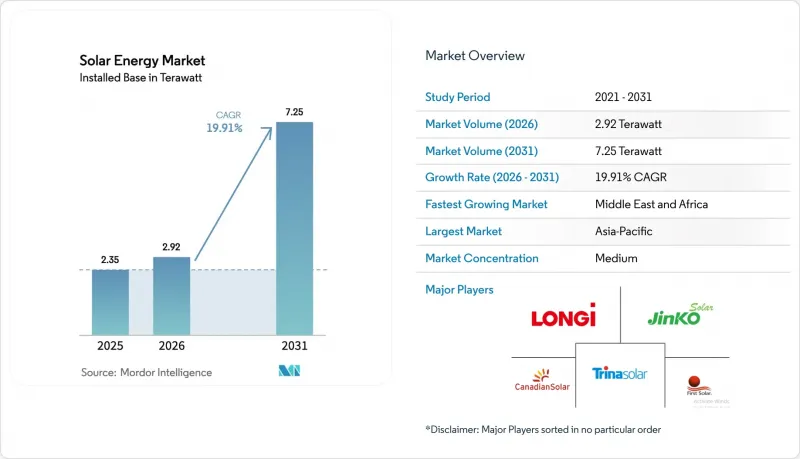
據 Mordor Intelligence 稱,按裝置容量計算,太陽能發電市場規模預計將從 2025 年的 2.35兆瓦擴大到 2026 年的 2.92兆瓦,到 2031 年達到 7.25兆瓦,2026 年至 2031 年的複合年成長率為 19.91%。
本報告按技術(光伏和聚光型太陽光電)、併網類型(併網和離網)、最終用戶(住宅、商業/工業和公用事業規模)以及地區(北美、歐洲、亞太、南美以及中東和非洲)進行細分。市場規模和預測均以裝置容量(GW)為基礎。
全球太陽能市場趨勢與洞察
亞洲公用事業規模太陽能發電成本趨於一致,正在加速太陽能採購。
2024年,印度和中國的基準競標價格低於每千瓦時0.03美元,比傳統燃煤電廠的成本低30%。 2024年中國新增裝置容量330吉瓦、印度新增裝置容量18吉瓦,均創歷史新高,凸顯了這項經濟驅動的電力需求激增。為此,各省輸電業者加快了連接西部資源樞紐和東部電力需求中心的特高壓輸電線路的建設。東南亞負責人看到太陽能發電的平準化成本低於受管制的火力發電價格,在2024年至2025年間暫停了12吉瓦的燃煤發電工程,並將資金進一步轉向結合太陽能和電池儲能的混合系統。
美國國內製造業的繁榮是由IRA推動的。
根據《通貨膨脹控制法案》(IRA)第45X條的規定,電池每瓦0.04美元、成品組件每瓦0.07美元的生產稅額扣抵,使成本曲線向有利於本地製造的方向移動。到2024年底,美國組件產能預計將翻兩番,達到42吉瓦,涵蓋110個項目。 Qcells公司已獲得14.5億美元的聯邦貸款擔保,用於建造十多年來美國首條從多晶矽到組件的全整合生產線。 First Solar公司已將其位於俄亥俄州的工廠擴建至6吉瓦,並在阿拉巴馬州開工建設一座3.5吉瓦的工廠,該工廠將使用碲化鎘組件,不受多晶矽供應瓶頸的影響。儘管2024年美國國內多晶矽產量僅能滿足四分之一的組件需求,但隨著2032年稅額扣抵到期領先進行的資本投資,這一缺口預計將會縮小。
中國對多晶矽和晶圓供應鏈的過度依賴
中國佔全球多晶矽產量的80-90%和矽晶圓產量的95%,其中新疆維吾爾自治區貢獻了全球45%的產能。由於《維吾爾族強迫勞動預防法》的實施,到2024年,美國港口將扣押超過3,800批太陽能相關貨物,造成8-12週的延誤。 2024年,歐洲一系列關稅調查進一步加劇了不確定性。隨著中國新增產能投入運作,多晶矽現貨價格從2022年的每公斤35美元暴跌至2024年的每公斤6-8美元,擠壓了許多一級組件製造商的利潤空間。歐洲和美國為實現供應來源多元化所做的努力,例如 QCells 在喬治亞的多晶矽生產線和 REC Silicon 在華盛頓州重新開工,預計到 2027 年,這些努力只能滿足中國以外不到 15% 的需求。
細分市場分析
到2025年,光伏發電將佔太陽能市場佔有率的99.7%。 2024年平準化成本下降了4.6%,使得光電發電在許多地區比尖峰時段的燃氣發電和陸上風電更具競爭力。預計到2030年,光伏發電將以19.92%的複合年成長率成長,這主要得益於效率的提升,例如鈣鈦礦矽串聯電池在實驗室中實現了31.6%的轉換效率。多結設計可望將轉換效率提升至40%以上,從而開拓空間受限的屋頂和車載整合系統等細分市場。聚光型太陽熱能發電(CSP)的市佔率將較小,因為在日照強度高的地區,光電發電與電池儲能結合的混合系統已將CSP的平準化成本降低了一半。
儘管由於矽成本下降,塔式和槽式太陽能發電專案的市場規模持續萎縮,但聚光太陽能發電(CSP)仍在製程熱這一細分市場中得到應用。太陽能產業持續致力於晶圓減薄、無金屬化接觸和背接觸結構等方面的研發,以期將其主流產品線的效率提升至接近25%。
區域分析
截至2025年,亞太地區繼續佔裝置容量的64.5%。中國在2024年新增330吉瓦裝置容量,累積設置容量超過800吉瓦。按省份分類,山東、河南和江蘇的總裝置容量達90吉瓦,主要得益於國內製造業獎勵,促使印度承諾新建40吉瓦工廠。日本、韓國和澳洲合計新增總合35吉瓦。為克服土地短缺和電網瓶頸問題,採用了浮體式、農電和混合模式。
預計到 2031 年,中東和非洲的太陽能市場將以 22.7% 的複合年成長率成長。這一成長趨勢主要由沙烏地阿拉伯的 4 吉瓦「NEOM」計畫、阿拉伯聯合大公國的 2 吉瓦「Al Dhafra」計畫和埃及的 3.6 吉瓦「蘇伊士運河」計畫推動,同時非洲離網太陽能設備的激增也起到了推波助瀾的作用,預計到 2024 年,非洲離太陽能網設備將覆蓋超過家庭 500 萬戶設備。
2024年,北美地區新增再生能源裝置容量35吉瓦,其中美國佔32吉瓦。在美國,《通貨膨脹控制法案》(IRA)的獎勵和各州可再生能源組合標準發揮了協同作用。儘管電力生產限制有所增加,但德克薩斯州仍以8.5吉瓦的裝置容量領先,加州緊隨其後,達到6.2吉瓦。加拿大新增2.8吉瓦的裝置容量得益於亞伯達的電力市場。墨西哥由於監管方面的不確定性,再生能源裝置容量停滯在1.2吉瓦。
2024年,歐洲新增裝置容量62吉瓦。德國以約15吉瓦位居榜首,西班牙接近9吉瓦,但受到併網延誤的困擾。波蘭也新增了6吉瓦裝置容量,主要得益於小規模產消者(既發電又消費自身能源的企業)。歐盟的「淨零排放產業法案」旨在2030年實現30吉瓦的本地化發電量,但截至2024年底,僅有8吉瓦的項目開工。
其他好處:
- Excel格式的市場預測(ME)表
- 3個月的分析師支持
目錄
第1章:引言
- 研究假設和市場定義
- 調查範圍
第2章:調查方法
第3章執行摘要
第4章 市場狀況
- 市場概覽
- 市場促進因素
- 亞洲公用事業規模太陽能發電成本趨於一致,正在加速採購。
- 個人退休帳戶推動了美國製造業的繁榮
- 歐洲和北美人工智慧和資料中心的企業購電協議需求
- 結合太陽能發電和電池儲能的混合項目正在開創一種新的獲利模式。
- 浮體式和農光互補發電設施正在開拓土地資源受限的市場(日本、歐盟)。
- 中東地區與綠氫能相關的太陽能發電大型企劃
- 市場限制因素
- 供應鏈中對中國多晶矽和晶圓的過度依賴
- 高普及率地區(中國、西班牙)電網擁塞與輸出限制
- 利率上升對住宅太陽能發電經濟可行性的影響(美國、歐盟)
- 高效薄膜所需的稀土元素供不應求
- 供應鏈分析
- 監理展望
- 技術展望
- 波特五力模型
- 價格分析 - 太陽能發電組件平均售價 (ASP) 趨勢 (美元/瓦)
第5章 市場規模與成長預測
- 透過技術
- 太陽能發電(PV)
- 聚光型太陽熱能發電(CSP)
- 按網格類型
- 併網
- 離網
- 最終用戶
- 公用事業規模
- 商業和工業(C&I)
- 住宅
- 按成分(定性分析)
- 太陽能模組/面板
- 逆變器(組串式、集中式、微型)
- 安裝和追蹤系統
- 系統平衡和電氣設備
- 儲能和混合整合
- 按地區
- 北美洲
- 美國
- 加拿大
- 墨西哥
- 歐洲
- 英國
- 德國
- 法國
- 西班牙
- 北歐國家
- 俄羅斯
- 其他歐洲國家
- 亞太地區
- 中國
- 印度
- 日本
- 韓國
- 馬來西亞
- 泰國
- 印尼
- 越南
- 澳洲
- 其他亞太國家
- 南美洲
- 巴西
- 阿根廷
- 哥倫比亞
- 其他南美國家
- 中東和非洲
- 沙烏地阿拉伯
- 阿拉伯聯合大公國
- 南非
- 埃及
- 其他中東和非洲國家
- 北美洲
第6章 競爭情勢
- 市場集中度
- 策略趨勢(併購、聯盟、購電協議)
- 市場佔有率分析(主要公司的市場排名和市場佔有率)
- 公司簡介
- Canadian Solar Inc.
- JinkoSolar Holding Co. Ltd
- Trina Solar Co. Ltd
- LONGi Green Energy Technology Co. Ltd
- First Solar Inc.
- JA Solar Technology Co. Ltd
- SunPower Corporation
- REC Solar Holdings AS
- Hanwha Q Cells Co. Ltd
- Risen Energy Co. Ltd
- Seraphim Solar System Co. Ltd
- Tata Power Solar Systems Ltd
- Sunrun Inc.
- Enphase Energy Inc.
- SMA Solar Technology AG
- Array Technologies Inc.
- Nextracker Inc.
- Siemens Energy(CSP)
- Abengoa SA
- BrightSource Energy Inc.
- ACCIONA Energia
- ENGIE SA
- ACWA Power
第7章 市場機會與未來展望
According to Mordor Intelligence, the solar energy market size in terms of installed base is expected to increase from 2.35 Terawatt in 2025 to 2.92 Terawatt in 2026 and reach 7.25 Terawatt by 2031, growing at a CAGR of 19.91% over 2026-2031.
This report is Segmented by Technology (Solar Photovoltaic and Concentrated Solar Power), Grid Type (On-Grid and Off-Grid), End-User (Residential, Commercial and Industrial, and Utility-Scale), and Geography (North America, Europe, Asia-Pacific, South America, and Middle East and Africa). The Market Sizes and Forecasts are Provided in Terms of Installed Capacity (GW).
Global Solar Energy Market Trends and Insights
Utility-Scale PV Cost Parity Accelerating Procurement in Asia
Benchmark auctions in India and China cleared below USD 0.03 per kilowatt-hour in 2024, undercutting legacy coal tariffs by up to 30%. Record annual additions of 330 GW in China and 18 GW in India in 2024 testify to this economics-driven surge. Provincial grid operators responded by fast-tracking ultra-high-voltage transmission corridors linking western resource hubs to eastern load centers. Southeast Asian planners canceled 12 GW of coal projects during 2024-2025 after levelized solar costs fell beneath regulated thermal power prices, further redirecting capital toward photovoltaic-battery hybrids.
IRA-Driven Domestic Manufacturing Boom in the United States
Section 45X production credits under the IRA provide USD 0.04 per watt for cells and USD 0.07 per watt for finished modules, tilting the cost curve toward local fabrication. By end-2024, U.S. module capacity quadrupled to 42 GW across 110 projects, and Qcells secured a USD 1.45 billion federal loan guarantee to develop America's first fully integrated polysilicon-to-module line in more than a decade. First Solar enlarged its Ohio complex to 6 GW and broke ground on a 3.5 GW Alabama plant that leverages cadmium-telluride modules exempt from polysilicon bottlenecks. Although domestic polysilicon output met only one-quarter of 2024 module demand, front-loaded capital spending before the credit sunsets in 2032 should narrow this gap.
Supply-Chain Over-Reliance on Chinese Polysilicon & Wafers
China accounts for 80-90% of polysilicon and 95% of wafer output, with Xinjiang supplying 45% of global capacity. The Uyghur Forced Labor Prevention Act detained over 3,800 solar cargoes at U.S. ports through 2024, creating 8-12-week delivery delays. European tariff investigations followed in 2024, adding more uncertainty. Spot polysilicon prices collapsed from USD 35 per kg in 2022 to USD 6-8 per kg in 2024 as new Chinese capacity came online, crushing margins for many tier-one module makers. Western diversification efforts, including QCells' Georgia polysilicon line and REC Silicon's Washington restart, will still meet less than 15% of ex-China demand by 2027.
Other drivers and restraints analyzed in the detailed report include:
- Corporate PPA Demand from AI & Data Centers in Europe & North America
- Hybrid PV-Battery Projects Unlocking New Revenue Stacking Models
- Grid Congestion & Curtailment in High-Penetration Provinces
For complete list of drivers and restraints, kindly check the Table Of Contents.
Segment Analysis
Solar photovoltaic commanded 99.7% of the Solar Energy market share in 2025. Falling levelized costs, down 4.6% in 2024, place PV ahead of gas peakers and onshore wind in many regions. The segment is expected to grow at 19.92% CAGR through 2030, powered by efficiency gains such as perovskite-silicon tandem cells hitting 31.6% laboratory performance. Multi-junction designs could push conversion rates beyond 40%, opening space-constrained rooftops and vehicle-integrated niches. Concentrated Solar Power retained a marginal footprint because solar-plus-battery hybrids now achieve half its levelized cost in high-irradiance regions.
Silicon's cost trajectory keeps eroding the addressable space for thermal tower and trough projects, though CSP still serves process-heat niches. The Solar Energy industry continues to funnel R&D toward wafer-thinning, metallization-free contacts, and back-contact architectures to inch efficiencies closer to 25% across mainstream product lines.
Complete Report Scope:
- By Technology
- Solar Photovoltaic (PV)
- Concentrated Solar Power (CSP)
- By Grid Type
- On-Grid
- Off-Grid
- By End-User
- Utility-Scale
- Commercial and Industrial (C&I)
- Residential
- By Component (Qualitative Analysis)
- Solar Modules/Panels
- Inverters (String, Central, Micro)
- Mounting and Tracking Systems
- Balance-of-System and Electricals
- Energy Storage and Hybrid Integration
- By Geography
- North America
- United States
- Canada
- Mexico
- Europe
- United Kingdom
- Germany
- France
- Spain
- Nordic Countries
- Russia
- Rest of Europe
- Asia-Pacific
- China
- India
- Japan
- South Korea
- Malaysia
- Thailand
- Indonesia
- Vietnam
- Australia
- Rest of Asia-Pacific
- South America
- Brazil
- Argentina
- Colombia
- Rest of South America
- Middle East and Africa
- Saudi Arabia
- United Arab Emirates
- South Africa
- Egypt
- Rest of Middle East and Africa
- North America
Geography Analysis
Asia-Pacific retained 64.5% of installed capacity in 2025. China's cumulative fleet surpassed 800 GW after adding 330 GW in 2024, with Shandong, Henan, and Jiangsu registering the highest provincial totals. India reached 90 GW, catalyzed by domestic manufacturing incentives that underwrote 40 GW of new factory commitments. Japan, South Korea, and Australia collectively added another 35 GW, with floating, agrivoltaic, and hybrid models compensating for land scarcity and grid bottlenecks.
The Middle East and Africa Solar Energy market is projected to register a 22.7% CAGR through 2031. Saudi Arabia's 4 GW NEOM, the United Arab Emirates' 2 GW Al Dhafra project, and Egypt's 3.6 GW Suez Canal pipeline anchor this upswing, complemented by a surge in African off-grid kits that passed 5 million households by 2024.
North America installed 35 GW in 2024, dominated by 32 GW in the United States, where IRA incentives and state renewable portfolio standards converged. Texas led with 8.5 GW, while California followed at 6.2 GW despite rising curtailment. Canada's 2.8 GW addition leaned on Alberta's merchant market. Mexico's progress stalled at 1.2 GW amid regulatory uncertainty.
Europe added 62 GW in 2024. Germany led with about 15 GW, Spain followed with nearly 9 GW but wrestled with interconnection backlogs, and Poland installed 6 GW driven by small-scale prosumers. The EU's Net-Zero Industry Act set a target of 30 GW of localized manufacturing by 2030; however, only 8 GW of projects had broken ground by year-end 2024.
- Canadian Solar Inc.
- JinkoSolar Holding Co. Ltd
- Trina Solar Co. Ltd
- LONGi Green Energy Technology Co. Ltd
- First Solar Inc.
- JA Solar Technology Co. Ltd
- SunPower Corporation
- REC Solar Holdings AS
- Hanwha Q Cells Co. Ltd
- Risen Energy Co. Ltd
- Seraphim Solar System Co. Ltd
- Tata Power Solar Systems Ltd
- Sunrun Inc.
- Enphase Energy Inc.
- SMA Solar Technology AG
- Array Technologies Inc.
- Nextracker Inc.
- Siemens Energy (CSP)
- Abengoa SA
- BrightSource Energy Inc.
- ACCIONA Energia
- ENGIE SA
- ACWA Power
Additional Benefits:
- The market estimate (ME) sheet in Excel format
- 3 months of analyst support
TABLE OF CONTENTS
1 Introduction
- 1.1 Study Assumptions & Market Definition
- 1.2 Scope of the Study
2 Research Methodology
3 Executive Summary
4 Market Landscape
- 4.1 Market Overview
- 4.2 Market Drivers
- 4.2.1 Utility-Scale PV Cost Parity Accelerating Procurement in Asia
- 4.2.2 IRA-Driven Domestic Manufacturing Boom in the United States
- 4.2.3 Corporate PPA Demand from AI & Data Centers in Europe & North America
- 4.2.4 Hybrid PV-Battery Projects Unlocking New Revenue Stacking Models
- 4.2.5 Floating & Agrivoltaic Installations Opening Constrained-Land Markets (Japan, EU)
- 4.2.6 Green Hydrogen-Linked Solar Mega-Projects in Middle East
- 4.3 Market Restraints
- 4.3.1 Supply-Chain Over-reliance on Chinese Polysilicon & Wafers
- 4.3.2 Grid Congestion & Curtailment in High-Penetration Provinces (China, Spain)
- 4.3.3 Rising Interest-Rate Environment Impacting Residential Solar Economics (US, EU)
- 4.3.4 Scarcity of Rare-Earth Metals for High-Efficiency Thin-Films
- 4.4 Supply-Chain Analysis
- 4.5 Regulatory Outlook
- 4.6 Technological Outlook
- 4.7 Porter's Five Forces
- 4.7.1 Bargaining Power of Suppliers
- 4.7.2 Bargaining Power of Consumers
- 4.7.3 Threat of New Entrants
- 4.7.4 Threat of Substitutes
- 4.7.5 Intensity of Competitive Rivalry
- 4.8 Pricing Analysis - PV Module ASP Trends (USD/W)
5 Market Size & Growth Forecasts
- 5.1 By Technology
- 5.1.1 Solar Photovoltaic (PV)
- 5.1.2 Concentrated Solar Power (CSP)
- 5.2 By Grid Type
- 5.2.1 On-Grid
- 5.2.2 Off-Grid
- 5.3 By End-User
- 5.3.1 Utility-Scale
- 5.3.2 Commercial and Industrial (C&I)
- 5.3.3 Residential
- 5.4 By Component (Qualitative Analysis)
- 5.4.1 Solar Modules/Panels
- 5.4.2 Inverters (String, Central, Micro)
- 5.4.3 Mounting and Tracking Systems
- 5.4.4 Balance-of-System and Electricals
- 5.4.5 Energy Storage and Hybrid Integration
- 5.5 By Geography
- 5.5.1 North America
- 5.5.1.1 United States
- 5.5.1.2 Canada
- 5.5.1.3 Mexico
- 5.5.2 Europe
- 5.5.2.1 United Kingdom
- 5.5.2.2 Germany
- 5.5.2.3 France
- 5.5.2.4 Spain
- 5.5.2.5 Nordic Countries
- 5.5.2.6 Russia
- 5.5.2.7 Rest of Europe
- 5.5.3 Asia-Pacific
- 5.5.3.1 China
- 5.5.3.2 India
- 5.5.3.3 Japan
- 5.5.3.4 South Korea
- 5.5.3.5 Malaysia
- 5.5.3.6 Thailand
- 5.5.3.7 Indonesia
- 5.5.3.8 Vietnam
- 5.5.3.9 Australia
- 5.5.3.10 Rest of Asia-Pacific
- 5.5.4 South America
- 5.5.4.1 Brazil
- 5.5.4.2 Argentina
- 5.5.4.3 Colombia
- 5.5.4.4 Rest of South America
- 5.5.5 Middle East and Africa
- 5.5.5.1 Saudi Arabia
- 5.5.5.2 United Arab Emirates
- 5.5.5.3 South Africa
- 5.5.5.4 Egypt
- 5.5.5.5 Rest of Middle East and Africa
- 5.5.1 North America
6 Competitive Landscape
- 6.1 Market Concentration
- 6.2 Strategic Moves (M&A, Partnerships, PPAs)
- 6.3 Market Share Analysis (Market Rank/Share for key companies)
- 6.4 Company Profiles (includes Global level Overview, Market level overview, Core Segments, Financials as available, Strategic Information, Products & Services, and Recent Developments)
- 6.4.1 Canadian Solar Inc.
- 6.4.2 JinkoSolar Holding Co. Ltd
- 6.4.3 Trina Solar Co. Ltd
- 6.4.4 LONGi Green Energy Technology Co. Ltd
- 6.4.5 First Solar Inc.
- 6.4.6 JA Solar Technology Co. Ltd
- 6.4.7 SunPower Corporation
- 6.4.8 REC Solar Holdings AS
- 6.4.9 Hanwha Q Cells Co. Ltd
- 6.4.10 Risen Energy Co. Ltd
- 6.4.11 Seraphim Solar System Co. Ltd
- 6.4.12 Tata Power Solar Systems Ltd
- 6.4.13 Sunrun Inc.
- 6.4.14 Enphase Energy Inc.
- 6.4.15 SMA Solar Technology AG
- 6.4.16 Array Technologies Inc.
- 6.4.17 Nextracker Inc.
- 6.4.18 Siemens Energy (CSP)
- 6.4.19 Abengoa SA
- 6.4.20 BrightSource Energy Inc.
- 6.4.21 ACCIONA Energia
- 6.4.22 ENGIE SA
- 6.4.23 ACWA Power
7 Market Opportunities & Future Outlook
- 7.1 White-space & Unmet-Need Assessment

 印度太陽能:市場佔有率分析、產業趨勢與統計及成長預測(2026-2031)義大利太陽能市場:市場佔有率分析、產業趨勢與統計及成長預測(2026-2031)菲律賓太陽能:市場佔有率分析、產業趨勢與統計及成長預測(2026-2031 年)印尼太陽能市場:市場佔有率分析、產業趨勢與統計及成長預測(2026-2031)中國太陽能市場:市場佔有率分析、產業趨勢與統計及成長預測(2026-2031年)德國太陽能市場:市場佔有率分析、產業趨勢與統計及成長預測(2026-2031)日本太陽能市場:市場佔有率分析、產業趨勢與統計及成長預測(2026-2031年)法國太陽能:市場佔有率分析、產業趨勢與統計及成長預測(2026-2031)泰國太陽能市場:市場佔有率分析、產業趨勢與統計及成長預測(2026-2031)西班牙太陽能:市場佔有率分析、產業趨勢與統計及成長預測(2026-2031)