


 |
市場調查報告書
商品編碼
2121340
印度太陽能:市場佔有率分析、產業趨勢與統計及成長預測(2026-2031)India Solar Energy - Market Share Analysis, Industry Trends & Statistics, Growth Forecasts (2026 - 2031) |
||||||

※ 本網頁內容可能與最新版本有所差異。詳細情況請與我們聯繫。
據 Mordor Intelligence 稱,2025 年印度太陽能市場價值為 122.5 吉瓦,預計到 2031 年將達到 348.57 吉瓦,而 2026 年為 145.83 吉瓦,預測期(2026-2031 年)的複合年成長率為 19.05% 19.05%。
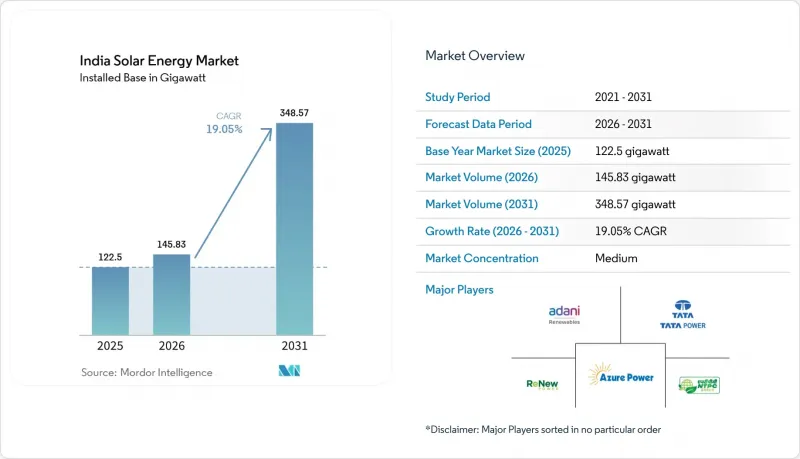
本報告按技術(光伏發電 (PV)、聚光型太陽熱能發電(CSP))、電網類型(併網、離網)和最終用戶(公用事業規模、商業/工業、住宅)進行分類。市場規模和預測以裝置容量(GW) 為單位。
印度太陽能市場趨勢與洞察
聯邦和州政府的支持性獎勵加速了在地化進程。
印度太陽能市場的擴張得益於鼓勵國內價值創造的法規。 《已通過核准型號製造商清單》(ALMM)優先考慮本地生產的組件,而兩項生產連結獎勵計畫計劃(PLI)則支持超過48吉瓦的從電池到組件的一體化生產能力,這些產能計劃於2026年投入運作。塔塔電力、沃利能源和戈爾迪太陽能預計2025年運作大型電站,儘管存在進口關稅,但國產組件仍能維持12-14%的利潤率。對於開發商而言,短期內初始成本將增加6-8%,但長期供應穩定性和潛在的稅額扣抵ALMM從2026年6月起擴展至電池,預計2025會計年度出口量將成長兩倍,達到8-9吉瓦,這將增強國際收支的穩定性,並進一步加劇印度太陽能市場的競爭。
模組調平成本的快速下降正在推動分散式領域的擴張。
2024年商業規模項目的平均資本支出較去年同期下降28%,電價降至每千瓦時2印度盧比的新低。成本下降主要得益於全球供應過剩、技術向拓普康(TOPCon)的轉變以及國內供應鏈的擴張。儘管物流瓶頸和基本電價導致的暫時性價格上漲可能會阻礙競標,但大多數開發商仍然預計,在整個專案生命週期內,發電成本將低於每千瓦時2.4印度盧比。維持這項標準需要持續提高效率、加快從多晶矽到組件的生產線擴張以及穩定運費。如果製造商能夠實現超過其公佈的25%的電池效率,到2027年,印度太陽能市場的電價預計將低於每千瓦時2印度盧比,這可能會進一步推動公用事業、工商業和住宅用戶的需求。
電網柔軟性低和輸出削減的風險導致專案盈利。
目前,印度主要邦的太陽能發電滲透率已超過尖峰需求的25%,電網頻繁面臨限電。輔助服務不足、電池部署延遲、電網擁塞導致電廠負載率下降高達4個百分點。儘管「綠色能源走廊」計畫和卡納塔克邦印度最大儲能系統(BESS)的運作提升了柔軟性,但仍未能跟上發電容量成長的步伐。開發商已將發電量預測納入考量,但不可預測的限電措施使得資金籌措困難重重,尤其是對於中型獨立發電商(IPP)而言。為維持投資者對印度太陽能市場的信心,必須加快引入市場驅動的經濟調度和即時輔助服務市場。
細分市場分析
到2025年,光伏發電將佔印度太陽能市場的99.58%,預計到2031年將以19.08%的複合年成長率成長。在光電發電領域,拓普康(TOPCon)組件已佔國內產量的35%,這得益於Waaree、Adani和Premier三家公司總合新增18吉瓦的產能。印度標準局(BIS)制定的品質標準淘汰了低品質進口產品,迫使開發商轉向雙面組件,從而將發電量提高10-20%。聚光太陽能熱發電(CSP)雖然規模小於1吉瓦,但正透過結合6小時儲熱的混合競標重新出現在競標中。印度國家聚光型太陽熱能發電公司(NTPC)位於拉達克的50兆瓦CSP電站的容量係數達到了42%,這充分展現了高海拔地區可控發電的價值。
在評估混合能源組合時,開發商會權衡聚光太陽能發電(CSP)的高資本密集度與其優異的夜間發電量。同時,信實工業計畫建造的10吉瓦高壓電晶體(HJT)生產線的目標是到2027年實現25-26%的電池效率,這有望縮小其與聚光太陽能發電的平準化電成本(LCOE)差距。隨著成本差距的縮小,技術選擇將取決於每個專案的場地和儲能限制。因此,儘管光伏發電在印度太陽能市場仍佔據主導地位,但該市場技術日益靈活,預計未來十年,小眾的聚光太陽能發電和下一代光伏發電技術將各自佔據一席之地。
其他好處
- Excel格式的市場預測(ME)表
- 3個月的分析師支持
目錄
第1章:引言
- 研究假設和市場定義
- 調查範圍
第2章:調查方法
第3章執行摘要
第4章 市場狀況
- 市場概覽
- 市場促進因素
- 聯邦和州政府支持計劃(例如,ALMM、PLI)
- 組件調平成本快速下降(低於 2.4 印度盧比/千瓦時)
- 500吉瓦的國家可再生能源目標是推動競標進程的關鍵因素。
- 與綠氫能相關的太陽能發電需求前景
- 透過PLI-2將國內生產體系從多晶矽擴展到組件。
- 國家主導的農業灌溉渠安裝計劃
- 市場限制因素
- 電網柔軟性低,有輸出削減風險
- 日照量高的州面臨土地徵用瓶頸
- 對電池片進口依賴徵收超過40%的關稅
- 限制微企業屋頂專案融資管道
- 供應鏈分析
- 監理情勢
- 技術展望
- 波特五力模型
- PESTLE分析
第5章 市場規模與成長預測
- 透過技術
- 太陽能發電(PV)
- 聚光型太陽熱能發電(CSP)
- 按網格類型
- 併網
- 離網
- 最終用戶
- 實用規模
- 商業和工業(C&I)
- 住宅
- 按成分(定性分析)
- 太陽能組件和麵板
- 逆變器(組串式、集中式、微型)
- 安裝和追蹤系統
- 系統平衡 - 電氣設備
- 儲能和混合整合
第6章 競爭情勢
- 市場集中度
- 策略趨勢(併購、聯盟、購電協議)
- 市場佔有率分析(主要公司的市場排名和佔有率)
- 公司簡介
- 參與企業
- Adani Solar
- Adani Green Energy Ltd.
- Tata Power Solar Systems Ltd.
- NTPC Renewable Energy Ltd.
- ReNew Power Pvt. Ltd.
- Azure Power Global Ltd.
- Mahindra Susten Pvt. Ltd.
- Sterling & Wilson Renewable Energy Ltd.
- Vikram Solar Ltd.
- Emmvee Solar
- Waaree Energies Ltd.
- JSW Energy-Solar
- Foreign Players
- JinkoSolar Holding Co. Ltd.
- LONGi Green Energy Technology Co. Ltd.
- First Solar Inc.
- Trina Solar Co. Ltd.
- Canadian Solar Inc.
- Hanwha Q Cells Co. Ltd.
- SMA Solar Technology AG
- 參與企業
第7章 市場機會與未來展望
According to Mordor Intelligence, the India solar energy market size was valued at 122.5 gigawatt in 2025 and estimated to grow from 145.83 gigawatt in 2026 to reach 348.57 gigawatt by 2031, at a CAGR of 19.05% during the forecast period (2026-2031).
This report is Segmented by Technology (Solar Photovoltaic and Concentrated Solar Power), Grid Type (On-Grid and Off-Grid), and End-User (Utility-Scale, Commercial and Industrial, and Residential). The Market Sizes and Forecasts are Provided in Terms of Installed Capacity (GW).
India Solar Energy Market Trends and Insights
Supportive Federal and State Incentives Accelerate Localization
India's Solar Energy market expansion is underwritten by regulations that reward domestic value addition. The Approved List of Models and Manufacturers (ALMM) favors locally produced modules, while two PLI tranches are underwriting more than 48 GW of integrated cell-to-module capacity scheduled to go online by 2026. Tata Power, Waaree Energies, and Goldi Solar commissioned large plants in 2025, keeping domestic module margins in the 12-14% range despite import duties. Developers face 6-8% higher upfront costs in the short run, yet long-term supply security and potential tax credits offset the burden. Expansion of ALMM to cover cells from June 2026 is projected to triple exports to 8-9 GW in FY 2025, bolstering balance-of-payments resilience and deepening India's Solar Energy market competitiveness.
Rapid Decline in Module-Levelized Cost Unlocks Distributed Segments
Average utility-scale project capex fell 28% year-on-year in 2024, pushing discovered tariffs to INR 2/kWh, a new national floor. Cost compression stems from global oversupply, technology shifts toward TOPCon, and widening domestic supply chains. Intermittent spikes due to logistics bottlenecks and basic customs duties occasionally disrupt bids; still, most developers model energy at <= INR 2.4/kWh over project life. Sustaining that benchmark depends on continued efficiency gains, accelerated polysilicon-to-module build-out, and moderated freight rates. If manufacturers achieve advertised cell efficiencies above 25%, the India Solar Energy market could see sub-INR 2 tariffs by 2027, reinforcing demand across utility, C&I, and residential applications.
Weak Grid Flexibility and Curtailment Risk Threatens Project Returns
Solar penetration in leading states now exceeds 25% of peak demand, exposing grids to frequent curtailment events. Limited ancillary services, delayed battery-storage rollouts, and network congestion erode plant load factors by up to 4 percentage points. The Green Energy Corridor program and the commissioning of India's largest BESS factory in Karnataka improve flexibility yet lag capacity-addition velocity. Developers incorporate generation forecasts, but unpredictable curtailment complicates financing, especially for medium-sized independent power producers. Faster adoption of market-based economic dispatch and real-time ancillary markets is essential to preserve investor confidence in the India Solar Energy market.
Other drivers and restraints analyzed in the detailed report include:
- 500 GW National Target Sustains Utility-Scale Tender Pipeline
- Green-Hydrogen-Linked Solar Demand Creates Dedicated Off-Take Channels
- Land-Acquisition Bottlenecks in High-Irradiance States Delay Commissioning
For complete list of drivers and restraints, kindly check the Table Of Contents.
Segment Analysis
Solar photovoltaic accounted for 99.58% of the India solar energy market in 2025 and is on track for a 19.08% CAGR through 2031. Within PV, TOPCon modules already form 35% of domestic output after Waaree, Adani, and Premier ramped 18 GW combined capacity. BIS-mandated quality rules removed low-grade imports, nudging developers toward bifacial designs that raise yields 10-20%. Concentrated solar power, although below 1 GW, re-entered the tender pipeline via hybrid bids that bundle six-hour thermal storage. NTPC's 50 MW Ladakh CSP plant logs a 42% capacity factor, showing dispatchable value in high-altitude sites.
Developers weigh CSP's higher capital intensity against superior evening output when evaluating mixed portfolios. Meanwhile, Reliance's planned 10 GW HJT line targets 25-26% cell efficiency by 2027, which could narrow LCOE differences with CSP. As cost spreads tighten, technology choice will hinge on project-specific land and storage constraints. The India solar energy market, therefore, remains PV-heavy yet technologically fluid, with niche CSP and next-gen PV formats carving differentiated roles over the decade.
Complete Report Scope:
- By Technology
- Solar Photovoltaic (PV)
- Concentrated Solar Power (CSP)
- By Grid Type
- On-Grid
- Off-Grid
- By End-User
- Utility-Scale
- Commercial and Industrial (C&I)
- Residential
- By Component (Qualitative Analysis)
- Solar Modules/Panels
- Inverters (String, Central, Micro)
- Mounting and Tracking Systems
- Balance-of-System and Electricals
- Energy Storage and Hybrid Integration
List of Companies Covered in this Report:
- Domestic Players
- Foreign Players
Additional Benefits:
- The market estimate (ME) sheet in Excel format
- 3 months of analyst support
TABLE OF CONTENTS
1 Introduction
- 1.1 Study Assumptions & Market Definition
- 1.2 Scope of the Study
2 Research Methodology
3 Executive Summary
4 Market Landscape
- 4.1 Market Overview
- 4.2 Market Drivers
- 4.2.1 Supportive federal & state incentives (e.g., ALMM, PLI)
- 4.2.2 Rapid decline in module-levelised cost (<= INR 2.4 /kWh)
- 4.2.3 500 GW national RE target driving tender pipeline
- 4.2.4 Green-hydrogen-linked solar demand pipelines
- 4.2.5 Domestic polysilicon-to-module build-out via PLI-2
- 4.2.6 State-led agrivoltaic & canal-top programmes
- 4.3 Market Restraints
- 4.3.1 Weak grid flexibility & curtailment risk
- 4.3.2 Land-acquisition bottlenecks in high-irradiance states
- 4.3.3 Cell/wafer import dependency facing >=40 % duties
- 4.3.4 Limited credit access for MSME rooftop projects
- 4.4 Supply-Chain Analysis
- 4.5 Regulatory Landscape
- 4.6 Technological Outlook
- 4.7 Porter's Five Forces
- 4.7.1 Threat of New Entrants
- 4.7.2 Bargaining Power of Buyers
- 4.7.3 Bargaining Power of Suppliers
- 4.7.4 Threat of Substitutes
- 4.7.5 Competitive Rivalry
- 4.8 PESTLE Analysis
5 Market Size & Growth Forecasts
- 5.1 By Technology
- 5.1.1 Solar Photovoltaic (PV)
- 5.1.2 Concentrated Solar Power (CSP)
- 5.2 By Grid Type
- 5.2.1 On-Grid
- 5.2.2 Off-Grid
- 5.3 By End-User
- 5.3.1 Utility-Scale
- 5.3.2 Commercial and Industrial (C&I)
- 5.3.3 Residential
- 5.4 By Component (Qualitative Analysis)
- 5.4.1 Solar Modules/Panels
- 5.4.2 Inverters (String, Central, Micro)
- 5.4.3 Mounting and Tracking Systems
- 5.4.4 Balance-of-System and Electricals
- 5.4.5 Energy Storage and Hybrid Integration
6 Competitive Landscape
- 6.1 Market Concentration
- 6.2 Strategic Moves (M&A, Partnerships, PPAs)
- 6.3 Market Share Analysis (Market Rank/Share for key companies)
- 6.4 Company Profiles (includes Global level Overview, Market level overview, Core Segments, Financials as available, Strategic Information, Products & Services, and Recent Developments)
- 6.4.1 Domestic Players
- 6.4.1.1 Adani Solar
- 6.4.1.2 Adani Green Energy Ltd.
- 6.4.1.3 Tata Power Solar Systems Ltd.
- 6.4.1.4 NTPC Renewable Energy Ltd.
- 6.4.1.5 ReNew Power Pvt. Ltd.
- 6.4.1.6 Azure Power Global Ltd.
- 6.4.1.7 Mahindra Susten Pvt. Ltd.
- 6.4.1.8 Sterling & Wilson Renewable Energy Ltd.
- 6.4.1.9 Vikram Solar Ltd.
- 6.4.1.10 Emmvee Solar
- 6.4.1.11 Waaree Energies Ltd.
- 6.4.1.12 JSW Energy - Solar
- 6.4.2 Foreign Players
- 6.4.2.1 JinkoSolar Holding Co. Ltd.
- 6.4.2.2 LONGi Green Energy Technology Co. Ltd.
- 6.4.2.3 First Solar Inc.
- 6.4.2.4 Trina Solar Co. Ltd.
- 6.4.2.5 Canadian Solar Inc.
- 6.4.2.6 Hanwha Q Cells Co. Ltd.
- 6.4.2.7 SMA Solar Technology AG
- 6.4.1 Domestic Players
7 Market Opportunities & Future Outlook
- 7.1 White-space & Unmet-Need Assessment

 太陽能:市場佔有率分析、產業趨勢與統計、成長預測(2026-2031)義大利太陽能市場:市場佔有率分析、產業趨勢與統計及成長預測(2026-2031)菲律賓太陽能:市場佔有率分析、產業趨勢與統計及成長預測(2026-2031 年)印尼太陽能市場:市場佔有率分析、產業趨勢與統計及成長預測(2026-2031)中國太陽能市場:市場佔有率分析、產業趨勢與統計及成長預測(2026-2031年)德國太陽能市場:市場佔有率分析、產業趨勢與統計及成長預測(2026-2031)日本太陽能市場:市場佔有率分析、產業趨勢與統計及成長預測(2026-2031年)法國太陽能:市場佔有率分析、產業趨勢與統計及成長預測(2026-2031)泰國太陽能市場:市場佔有率分析、產業趨勢與統計及成長預測(2026-2031)西班牙太陽能:市場佔有率分析、產業趨勢與統計及成長預測(2026-2031)