


 |
市場調查報告書
商品編碼
2121295
印尼太陽能市場:市場佔有率分析、產業趨勢與統計及成長預測(2026-2031)Indonesia Solar Energy - Market Share Analysis, Industry Trends & Statistics, Growth Forecasts (2026 - 2031) |
||||||

※ 本網頁內容可能與最新版本有所差異。詳細情況請與我們聯繫。
根據 Mordor Intelligence 預測,印尼太陽能市場將從 2025 年的 2.15 吉瓦成長到 2026 年的 2.97 吉瓦,從 2026 年到 2031 年的複合年成長率為 38.10%,到 2031 年達到 14.91 吉瓦。
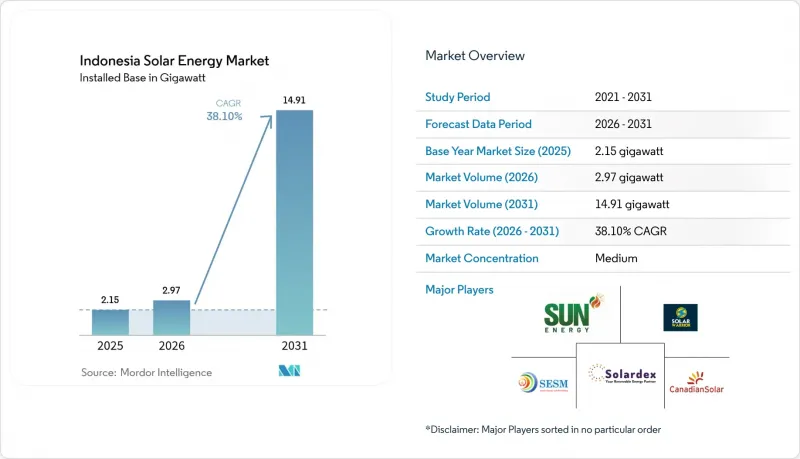
本報告按技術(光伏發電 (PV)、聚光型太陽熱能發電(CSP))、電網類型(併網、離網)和最終用戶(公用事業規模、商業/工業、住宅)進行分類。市場規模和預測以裝置容量(吉瓦)表示。
印尼太陽能市場趨勢與洞察
政府對屋頂光電發電的獎勵正在加速分散式光電發電的普及。
能源和礦產資源部 (MEMR) 第 2/2024 號條例廢除了淨計量電價機制,並以 5.746 吉瓦的配額制取代。該條例明確了併網規則,保障了印尼國家電力公司 (PLN) 的收入,並維持了對商業系統的稅收優惠。雅加達省長第 38/2024 號條例強制要求新建面積超過 500 平方公尺的商業建築安裝屋頂太陽能發電系統。西爪哇和峇裡島也已實施了類似措施。將這些措施與配額制結合,形成了一個透明的管道,明確了開發商到 2028 年的業務前景。該機制透過限制剩餘電力額度來鼓勵家庭自用,同時促進了能夠吸收白天發電量的大規模商業設施的建設。開發商預計,隨著住宅市場在 2027 年重新開放,申請期限將進一步縮短,因此正在加快設計進度,以便儘早獲得配額。同時,地方政府對違規行為處以罰款和提供許可證獎勵,提高了合規率,而印尼太陽能市場正在人口稠密的都市區擴張。
組件平均售價(ASP)的下降導致平準化發電成本低於市電平價。
多晶矽現貨價格從2023年的每公斤30美元跌至2024年第四季的每公斤8美元,導致晶體矽組件的平均售價減半。這使得印尼國家電力公司(PLN)近期EPC(工程、採購和施工)項目的競標低至每千瓦時1050印尼幣。運費的正常化進一步降低了中國一級組件的交付成本15-20%,使東努沙登加拉省和南加里曼丹省的平準化發電成本低於燃煤發電的基準水準。為此,開發商已提交自願購電協議(PPA)提案,其競標已超過PLN為2025-2034年設定的17.1吉瓦太陽能發電配額。然而,隨著製造商清理高價庫存,利潤率仍面臨壓力,迫使印尼企業謹慎調整訂單時間。根據期貨曲線,如果中國工廠使用率維持在每年600吉瓦以上,印尼太陽能市場將在2026年之前受益於低於每千瓦時0.07美元的電價。
TKDN(在地採購)需求可提高專案經濟效益。
根據印尼能源和礦產資源部第191/2024號法令,在地採購率(TKDN)基準值已降至20%,但由於印尼多晶矽和晶圓製造廠短缺,開發商仍面臨12-18%的EPC成本上漲。這使得PT Len Industri的600MW生產線成為滿足門檻的主要供應來源。訂單積壓已達九個月,迫使公用事業規模的業者重新協商購電協議(PPA)時間表,或接受部分進口的罰款。印尼國家電力公司(PLN)仍不願提高電價,導致利潤率承壓,並波及整個供應鏈。目前,一些獨立發電商(IPP)正在整合來自國內供應商的系統平衡(BOS)設備,以超過20%的基準值,但審計可能會使商業營運證書的發放延遲長達90天。除非到 2027 年有一座新的吉瓦級電站開始商業運營,否則 TKDN 法規可能會繼續阻礙印尼太陽能市場的發展。
細分市場分析
預計到2025年,光伏發電(太陽能PV)將佔印尼太陽能市場100%的佔有率,並預計到2031年將以38.10%的複合年成長率成長。聚光太陽能發電(CSP)目前仍不具備商業性可行性。這是因為印尼大多數位置的直接輻射量(DNI)仍然只有1400-1600千瓦時/平方米,遠低於CSP保持競爭力所需的2000千瓦時/平方米的標準。 CSP的資本投資很高,每千瓦4000-6000美元,而光伏發電(PV)的資本投資僅為每千瓦800-1200美元,這導致投資者將資金集中投入晶體矽太陽能發電。在土地資源有限的爪哇島,開發商的目標是提高 10-15% 的發電量,到 2024 年,雙面組件和拓普康組件將佔進口總量的 60%。儘管面臨價格壓力,但由於符合 IEC 61215 和 IEC 61730 標準,銀行融資的可靠性得以維持,這進一步鞏固了太陽能發電在印尼太陽能市場的主導地位。
第二代電池技術正在加速發電效率的提升,並透過在固定配額內實現更小的額定輸出功率,降低限電風險。隆基和天合光能預計在2024年將分別交付超過500兆瓦的雙面組件,其中大部分用於浮體式太陽能電站和與柴油電站混合的電站。隨著組件能量密度的提高,開發商預測到2027年,土地需求將減少7%,這有望降低爪哇島城市地區社區對太陽能專案的接受度,同時提高專案的內部收益率(IRR)。
其他好處
- Excel格式的市場預測(ME)表
- 3個月的分析師支持
目錄
第1章:引言
- 研究假設和市場定義
- 調查範圍
第2章:調查方法
第3章執行摘要
第4章 市場狀況
- 市場概覽
- 市場促進因素
- 政府加強屋頂太陽能發電淨計量優惠政策(2023年)
- 全球範圍內模組的平均售價(ASP)和運輸成本降低。
- 來自 RE100 成員製造商的企業 RE-PPA 需求
- 透過在離島上從柴油發電轉向混合動力發電,減輕PLN的補貼負擔。
- 雅加達和各省的法令強制要求在屋頂安裝
- 蘇拉威西島鎳冶煉廠現場發電的要求
- 市場限制因素
- 由於 40% TKDN(在地採購)規定,成本增加。
- 電網吸收配額和輸出削減風險
- 政府對浮體式光伏發電購電協議缺乏擔保
- 獨立發電計畫(IPP)中印尼盾兌外匯的高額對沖成本導致印尼盾兌外匯交易成本居高不下。
- 供應鏈分析
- 監理情勢
- 技術展望
- 波特五力模型
- PESTLE分析
第5章 市場規模與成長預測
- 透過技術
- 太陽能發電(PV)
- 聚光型太陽熱能發電(CSP)
- 按網格類型
- 併網
- 離網
- 最終用戶
- 實用規模
- 商業和工業(C&I)
- 住宅
- 按成分(定性分析)
- 太陽能組件和麵板
- 逆變器(組串式、集中式、微型)
- 安裝和追蹤系統
- 系統平衡 - 電氣設備
- 儲能和混合整合
第6章 競爭情勢
- 市場集中度
- 策略趨勢(併購、聯盟、購電協議)
- 市場佔有率分析(主要公司的市場排名和佔有率)
- 公司簡介
- PT Surya Utama Nuansa(SUN Energy)
- PT TotalEnergies Eren Indonesia
- PT Sumber Energi Sukses Makmur(SES)
- PT Sumber Energi Surya Nusantara(SESNA)
- PT Solardex Energy Indonesia
- Canadian Solar Inc.
- Trina Solar Co. Ltd.
- LONGi Green Energy Technology Co. Ltd.
- First Solar Inc.
- JA Solar Technology Co. Ltd.
- Risen Energy Co. Ltd.
- PT Len Industri(Persero)
- PT PLN Nusantara Power
- Akuo Energy Indonesia
- ACWA Power Indonesia
- Vena Energy Indonesia
- Masdar Indonesia
- PT Xurya Daya Indonesia
- Enernet Global Indonesia
第7章 市場機會與未來展望
According to Mordor Intelligence, the Indonesia solar energy market size is expected to grow from 2.15 gigawatt in 2025 to 2.97 gigawatt in 2026 and is forecast to reach 14.91 gigawatt by 2031 at 38.10% CAGR over 2026-2031.
This report is Segmented by Technology (Solar Photovoltaic and Concentrated Solar Power), Grid Type (On-Grid and Off-Grid), and End-User (Utility-Scale, Commercial and Industrial, and Residential). The Market Sizes and Forecasts are Provided in Terms of Installed Capacity (GW).
Indonesia Solar Energy Market Trends and Insights
Government Rooftop Incentives Accelerate Distributed Adoption
MEMR Regulation 2/2024 ended net-metering and replaced it with a 5.746 GW quota, clarifying interconnection rules and protecting PLN revenues while sustaining tax allowances for commercial systems. Jakarta's Governor Regulation 38/2024 now obliges the installation of rooftop solar on new commercial buildings exceeding 500 m2, a mandate mirrored in West Java and Bali. Together with the quota, this delivers a transparent pipeline that boosts developer visibility until 2028. The mechanism caps excess-generation credits, steering households toward self-consumption yet unlocking larger corporate installations that can absorb daytime output. Developers have accelerated engineering timelines to secure quota allocations early, anticipating tighter windows once the residential segment restarts in 2027. At the same time, municipal fines and permitting incentives ensure higher compliance, thereby expanding the Indonesian solar energy market in densely populated urban districts.
Module ASP Declines Compress Levelized Costs Below Grid Parity
Polysilicon spot prices declined from USD 30/kg in 2023 to USD 8/kg by Q4 2024, halving crystalline-silicon module ASPs and enabling EPC bids as low as IDR 1,050 per kWh in recent PLN tenders. Normalized freight rates shaved another 15-20% off landed costs for Chinese Tier-1 modules, pushing levelized electricity costs beneath coal benchmarks in East Nusa Tenggara and South Kalimantan. Developers responded by lodging unsolicited PPA proposals that already exceed PLN's 17.1 GW solar allocation for 2025-2034. Yet margin pressure remains as manufacturers offload high-priced inventory, compelling Indonesian firms to hedge order timing. Forward curves indicate that if Chinese factory utilization stays above 600 GW annually, the Indonesian solar energy market will benefit from sub-USD 0.07 kWh tariffs through 2026.
TKDN Local-Content Mandate Elevates Project Economics
MEMR Decree 191/2024 trimmed the TKDN threshold to 20%, yet developers still face 12-18% higher EPC costs because Indonesia lacks polysilicon and wafer plants, leaving PT Len Industri's 600 MW line as the chief compliant source. Queue times stretch to nine months, compelling utility-scale sponsors to renegotiate PPA schedules or accept partial-import penalties. PLN remains reluctant to uplift tariffs, forcing margin compression that cascades through the supply chain. Several IPPs now bundle balance-of-system gear from domestic suppliers to surpass the 20% threshold, although audits can delay commercial-operation certificates by up to 90 days. Unless new gigawatt-scale factories reach commercial operation before 2027, the TKDN rule will continue to hinder the Indonesian solar energy market.
Other drivers and restraints analyzed in the detailed report include:
- RE100 Corporate Commitments Drive C&I PPA Volume
- Diesel Displacement in Eastern Archipelago Eases Fiscal Strain
- Grid-Absorption Constraints Trigger Curtailment Incidents
For complete list of drivers and restraints, kindly check the Table Of Contents.
Segment Analysis
Solar PV accounted for 100.00% of the Indonesian solar energy market size in 2025 and is forecast to advance at a 38.10% CAGR through 2031. CSP remains commercially unviable because most Indonesian sites record 1,400-1,600 kWh/m2 DNI, which is well below the 2,000 kWh/m2 threshold that CSP needs to remain competitive. PV capex of USD 800-1,200 kW undercuts CSP's USD 4,000-6,000 kW, so investors concentrate capital on crystalline-silicon routes. Bifacial and TOPCon modules captured 60% of 2024 imports as developers chase 10-15% yield gains in land-constrained Java. Compliance with IEC 61215 and IEC 61730 standards upholds bankability despite price compression, further reinforcing PV's exclusive status in the Indonesian solar energy market.
Second-generation cell technologies accelerate yield improvements, mitigating curtailment risks by enabling lower nameplate sizing for fixed quotas. LONGi and Trina each delivered over 500 MW of bifacial shipments in 2024, primarily for floating PV and hybrid diesel sites. As module energy density rises, developers forecast a 7% drop in land requirements by 2027, alleviating community-acceptance barriers in peri-urban Java while bolstering project IRRs.
Complete Report Scope:
- By Technology
- Solar Photovoltaic (PV)
- Concentrated Solar Power (CSP)
- By Grid Type
- On-Grid
- Off-Grid
- By End-User
- Utility-Scale
- Commercial and Industrial (C&I)
- Residential
- By Component (Qualitative Analysis)
- Solar Modules/Panels
- Inverters (String, Central, Micro)
- Mounting and Tracking Systems
- Balance-of-System and Electricals
- Energy Storage and Hybrid Integration
List of Companies Covered in this Report:
- PT Surya Utama Nuansa (SUN Energy)
- PT TotalEnergies Eren Indonesia
- PT Sumber Energi Sukses Makmur (SES)
- PT Sumber Energi Surya Nusantara (SESNA)
- PT Solardex Energy Indonesia
- Canadian Solar Inc.
- Trina Solar Co. Ltd.
- LONGi Green Energy Technology Co. Ltd.
- First Solar Inc.
- JA Solar Technology Co. Ltd.
- Risen Energy Co. Ltd.
- PT Len Industri (Persero)
- PT PLN Nusantara Power
- Akuo Energy Indonesia
- ACWA Power Indonesia
- Vena Energy Indonesia
- Masdar Indonesia
- PT Xurya Daya Indonesia
- Enernet Global Indonesia
Additional Benefits:
- The market estimate (ME) sheet in Excel format
- 3 months of analyst support
TABLE OF CONTENTS
1 Introduction
- 1.1 Study Assumptions & Market Definition
- 1.2 Scope of the Study
2 Research Methodology
3 Executive Summary
4 Market Landscape
- 4.1 Market Overview
- 4.2 Market Drivers
- 4.2.1 Government rooftop-net-metering incentives strengthened (2023)
- 4.2.2 Declining global module ASPs and shipping costs
- 4.2.3 Corporate RE-PPA demand from RE100 manufacturers
- 4.2.4 Diesel-hybrid swaps on remote islands cut PLN subsidy burden
- 4.2.5 Jakarta & provincial mandatory-rooftop by-laws
- 4.2.6 Sulawesi nickel-smelter self-generation requirement
- 4.3 Market Restraints
- 4.3.1 40 % TKDN local-content rule inflates costs
- 4.3.2 Grid-absorption quota & curtailment risk
- 4.3.3 Lack of sovereign guarantee for floating-PV PPAs
- 4.3.4 High IDR-FX hedging costs for IPPs
- 4.4 Supply-Chain Analysis
- 4.5 Regulatory Landscape
- 4.6 Technological Outlook
- 4.7 Porters Five Forces
- 4.7.1 Threat of New Entrants
- 4.7.2 Bargaining Power of Suppliers
- 4.7.3 Bargaining Power of Buyers
- 4.7.4 Threat of Substitutes
- 4.7.5 Industry Rivalry
- 4.8 PESTLE Analysis
5 Market Size & Growth Forecasts
- 5.1 By Technology
- 5.1.1 Solar Photovoltaic (PV)
- 5.1.2 Concentrated Solar Power (CSP)
- 5.2 By Grid Type
- 5.2.1 On-Grid
- 5.2.2 Off-Grid
- 5.3 By End-User
- 5.3.1 Utility-Scale
- 5.3.2 Commercial and Industrial (C&I)
- 5.3.3 Residential
- 5.4 By Component (Qualitative Analysis)
- 5.4.1 Solar Modules/Panels
- 5.4.2 Inverters (String, Central, Micro)
- 5.4.3 Mounting and Tracking Systems
- 5.4.4 Balance-of-System and Electricals
- 5.4.5 Energy Storage and Hybrid Integration
6 Competitive Landscape
- 6.1 Market Concentration
- 6.2 Strategic Moves (M&A, Partnerships, PPAs)
- 6.3 Market Share Analysis (Market Rank/Share for key companies)
- 6.4 Company Profiles (includes Global level Overview, Market level overview, Core Segments, Financials as available, Strategic Information, Products & Services, and Recent Developments)
- 6.4.1 PT Surya Utama Nuansa (SUN Energy)
- 6.4.2 PT TotalEnergies Eren Indonesia
- 6.4.3 PT Sumber Energi Sukses Makmur (SES)
- 6.4.4 PT Sumber Energi Surya Nusantara (SESNA)
- 6.4.5 PT Solardex Energy Indonesia
- 6.4.6 Canadian Solar Inc.
- 6.4.7 Trina Solar Co. Ltd.
- 6.4.8 LONGi Green Energy Technology Co. Ltd.
- 6.4.9 First Solar Inc.
- 6.4.10 JA Solar Technology Co. Ltd.
- 6.4.11 Risen Energy Co. Ltd.
- 6.4.12 PT Len Industri (Persero)
- 6.4.13 PT PLN Nusantara Power
- 6.4.14 Akuo Energy Indonesia
- 6.4.15 ACWA Power Indonesia
- 6.4.16 Vena Energy Indonesia
- 6.4.17 Masdar Indonesia
- 6.4.18 PT Xurya Daya Indonesia
- 6.4.19 Enernet Global Indonesia
7 Market Opportunities & Future Outlook
- 7.1 White-space & Unmet-Need Assessment

 印度太陽能:市場佔有率分析、產業趨勢與統計及成長預測(2026-2031)太陽能:市場佔有率分析、產業趨勢與統計、成長預測(2026-2031)義大利太陽能市場:市場佔有率分析、產業趨勢與統計及成長預測(2026-2031)菲律賓太陽能:市場佔有率分析、產業趨勢與統計及成長預測(2026-2031 年)中國太陽能市場:市場佔有率分析、產業趨勢與統計及成長預測(2026-2031年)德國太陽能市場:市場佔有率分析、產業趨勢與統計及成長預測(2026-2031)日本太陽能市場:市場佔有率分析、產業趨勢與統計及成長預測(2026-2031年)法國太陽能:市場佔有率分析、產業趨勢與統計及成長預測(2026-2031)泰國太陽能市場:市場佔有率分析、產業趨勢與統計及成長預測(2026-2031)西班牙太陽能:市場佔有率分析、產業趨勢與統計及成長預測(2026-2031)