


 |
市場調查報告書
商品編碼
2119633
北加州資料中心:市佔率分析、產業趨勢與統計及成長預測(2026-2031 年)Northern California Data Center - Market Share Analysis, Industry Trends & Statistics, Growth Forecasts (2026 - 2031) |
||||||

※ 本網頁內容可能與最新版本有所差異。詳細情況請與我們聯繫。
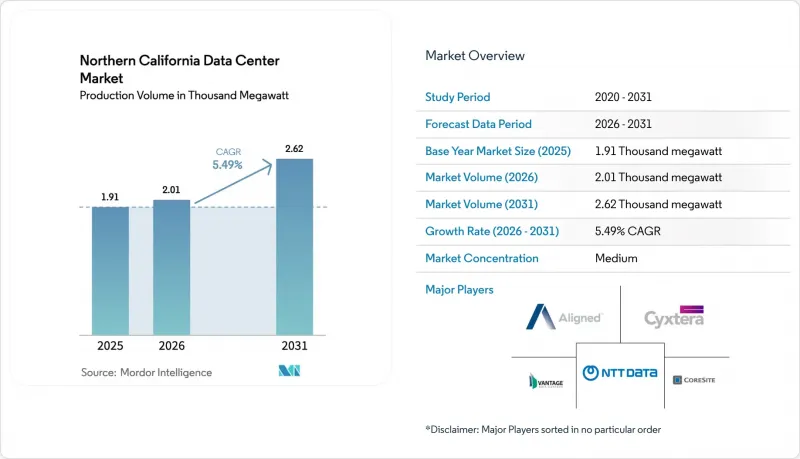
據 Mordor Intelligence 稱,2025 年北加州資料中心市場規模(按生產量計算)價值為 1,910 兆瓦,預計到 2026 年將從 2,010 兆瓦成長到 2031 年的 2,620 兆瓦,在預測期(2026-2031 年)內
本報告按資料中心規模(小規模、中型、大型、超大規模)、層級(一級、二級、其他)、資料中心類型(超大規模/本地部署、企業/邊緣、託管)以及最終用戶(銀行、金融服務和保險 (BFSI)、IT/ITES、電子商務、政府、製造業、媒體/娛樂、電信、其他)進行細分。市場預測以 IT 負載容量(兆瓦)為單位。
北加州資料中心市場的趨勢與洞察
以人工智慧為中心的超大規模分層的需求
微軟、Meta 和其他超大規模資料中心業者營運商在 2025 會計年度的資本支出將超過 1,450 億美元,其中大部分將用於在北加州新建資料中心,以託管對延遲敏感的推理叢集。根據 PG&E 的 30 號規則,營運商提前四年多就預訂了電力槽位,以確保價格穩定,導致在施工開始前,與公用事業公司進行互聯的申請就已經排起了長隊。這些新建的資料中心將採用 200 至 500 兆瓦的單租戶機房,將人工智慧訓練、模型調優和向量資料庫工作負載集中在一個地點。機架級功率密度持續超過 100 千瓦,推動了晶片級直接冷卻和浸沒式冷卻技術的普及。由於傳統的多租戶機房無法容納此類設施,開發商擴大在現有變電站附近尋找待開發區地塊,以減少佈線距離和張力損耗。
影像渲染和串流媒體的工作量迅速增加
現代電影長片未經剪輯的影像資料量可超過 2 Petabyte,而從 4K 格式轉換為 8K 格式會使計算負載增加四倍以上。因此,基於雲端的渲染工作負載正從洛杉磯向北遷移,利用聖克拉拉的低延遲互連樞紐。 Netflix、蘋果和亞馬遜在灣區維護邊緣節點,以便在進行全球分發之前預先部署高解析度主資料,從而使製片廠免受跨太平洋網路擁塞的影響。對 8K 和體影片日益成長的需求也推動了北加州資料中心市場的發展,因為供應商正在將內容傳遞網路與超大規模資料中心共置。雖然好萊塢的重建重點是南加州,但灣區營運商正受益於終止於聖荷西 Carrier Hotel 的回程傳輸流量。
PG&E電網230千伏互連線路短缺
截至2025年10月,PG&E已記錄了9.6吉瓦的未確認資料中心負荷,但僅有1.4吉瓦進入了詳細設計階段。 Smart Wires的FlexNet設備已在洛斯埃斯特羅斯變電站鎖定了100兆瓦的容量,但營運商在新增迴路方面仍面臨數年的延誤。矽谷電力公司提供更具吸引力的收費系統,但其18平方英里的服務範圍限制了供給能力。許多開發商目前正在與兩家電力公司協商分攤供電,這將導致更高的前期成本,但可以降低工期延誤的風險。持續的供給能力短缺限制了北加州資料中心市場的短期擴張,一些超大規模資料中心業者已開始探索內陸和太平洋西北地區的其他選址。
細分市場分析
超大規模資料中心正在推動北加州資料中心市場的擴張,單一租戶園區規模迅速成長至 300 兆瓦以上,預計到 2031 年將以 6.12% 的複合年成長率成長。這一趨勢的驅動力在於能夠最大限度地減少網路躍點並集中管理電源,從而提高 GPU 訓練叢集的效率。到 2025 年,超大規模資料中心將佔據北加州資料中心市場佔有率的 42.42%。規模在 50 兆瓦至 150 兆瓦之間的超大規模資料中心在處理企業級遷移工作負載的多租戶雲端中繼續發揮著至關重要的作用。規模在 10 兆瓦至 50 兆瓦之間的中型資料中心作為串流媒體和 SaaS 閘道的區域邊緣樞紐,其角色日益凸顯。規模小於 10 兆瓦的小規模資料中心則繼續用於災害復原、物聯網聚合和低延遲金融交易。北加州資料中心市場持續向垂直設計轉變,在有限的土地上堆疊多個 4 MW 機房,最佳化土地成本,同時確保電力和冷卻水維修的清晰路徑。
位於聖克拉拉的第二代超大規模資料中心園區擁有30英尺(約9公尺)高的天花板和加固的樓板,無需進行結構維修即可安裝浸沒式水箱。為了避免計量附加費,開發商在園區內安裝了降壓變電站,冗餘的230千伏饋線分支成放射狀的34.5千伏環路。模組化建造方式將工期從24個月縮短至18個月,隨著客戶專案推進,此優勢正日益凸顯。這些趨勢使得超大規模資料中心成為北加州資料中心市場競爭最激烈的領域,促使基礎設施基金和雲端服務供應商之間湧現大量合資企業,共同整合土地、資金和人才。
即使到了2025年,三級資料中心仍將保持其主導地位,佔據北加州資料中心市場48.38%的佔有率。這主要歸功於傳統的企業託管模式,這種模式容忍較短的維護週期。然而,四級資料中心的容量正以6.32%的複合年成長率快速成長。這是因為即使是毫秒的中斷也可能導致GPU推理工作負載崩潰。金融市場監管機構和超大規模資料中心業者都要求99.995%的運轉率,這推動了新建設採用2N+1電源拓撲結構、可同時維護的開關設備和雙主動冷卻器。雖然建設成本增加了約40%,但服務等級協定(SLA)違約的罰款減少,以及與意外停機相關的成本降低,抵消了這些增加帶來的負擔。
在抗震工程方面,由於4b區的要求,設計標準正進一步提升至Tier 4級。此要求規定必須採用隔震或框架結構,以吸收0.5g的峰值地面加速度。營運商正在採用三重冗餘燃料系統和自動負載關閉控制,優先處理人工智慧推理工作負載而非批量分析。儘管由於Tier IV認證工程師的高薪要求,人員短缺仍然是一個挑戰,但業主目前正在資助學徒計劃,以維持能夠保障容錯環境運作的電氣和機械專業人員的供應。
其他好處:
- Excel格式的市場預測(ME)表
- 3個月的分析師支持
目錄
第1章:引言
- 研究假設和市場定義
- 調查範圍
第2章:調查方法
第3章執行摘要
第4章 市場狀況
- 市場概覽
- 市場促進因素
- 以人工智慧為中心的超大規模交易的需求
- 電影渲染和串流媒體播放的工作量迅速增加
- 海底電纜登陸西海岸(哈瓦基努伊島,CAP-1)
- 南加州400兆瓦太陽能發電 + 電池儲能系統購電協議(PPA)
- 將好萊塢攝影棚重新構想為尖端資料中心
- 洛杉磯清潔電網2045:現場微型小型模組化反應器的獎勵
- 市場限制因素
- PG&E的電網缺乏足夠的230千伏聯網線路。
- 長期供電等待期(48-60個月)
- 擴大與抗震設計相關的資本投資溢價(4b區)
- 四級認證技術人員和電氣工程師短缺
- 市場展望
- IT處理能力
- 高架占地面積
- 託管收入
- 已安裝機架
- 機架空間利用率
- 海底電纜
- 主要行業趨勢
- 智慧型手機用戶
- 每部智慧型手機的資料通訊
- 行動資料通訊速度
- 寬頻通訊速度
- 光纖網路
- 法律規範
- 價值鍊和通路分析
- 波特五力分析
- 宏觀經濟因素對市場的影響
第5章 市場規模及成長預測(兆瓦)
- 按資料中心規模
- 小規模
- 中號
- 大規模
- 超大規模
- 層級類型
- 一級和二級
- 三級
- 第四級
- 依資料中心類型
- 超大規模/內部建設
- 企業/邊緣運算
- 搭配
- 未使用的
- 用過的
- 零售共址
- 批發託管
- 最終用戶
- BFSI
- 資訊科技/資訊科技服務
- 電子商務
- 政府
- 製造業
- 媒體與娛樂
- 溝通
- 其他
第6章 競爭情勢
- 市佔率分析
- 企業狀況
- 公司簡介
- CoreSite Realty Corporation
- Cyxtera Technologies, Inc.
- Aligned Data Centers, LLC
- Vantage Data Centers, LLC
- Iron Mountain Data Centers
- STACK Infrastructure, Inc.
- Switch, Inc.
- NTT Global Data Centers Americas, Inc.
- Evoque Data Center Solutions, LLC
- DataBank, Ltd.
- QTS Realty Trust, LLC
- EdgeCore Digital Infrastructure, LLC
- EdgeConneX, Inc.
- Flexential Corp.
- H5 Data Centers, LLC
- Lumen Technologies, Inc.
- Stream Data Centers, LLC
- T5 Data Centers, LLC
- Digital Realty
- Nautilus Data Technologies, Inc.
- CyrusOne LLC
- Element Critical, Inc.
第7章 市場機會與未來展望
According to Mordor Intelligence, the northern california data center market size in terms of production volume was valued at 1.91 thousand megawatt in 2025 and is estimated to grow from 2.01 thousand megawatt in 2026 to reach 2.62 thousand megawatt by 2031, at a CAGR of 5.49% during the forecast period (2026-2031).
This report is Segmented by Data Center Size (Small, Medium, Large, and Hyperscale), Tier Type (Tier 1 and 2, and More), Data Center Type (Hyperscale/Self-Built, Enterprise/Edge, and Colocation), and End User (BFSI, IT and ITES, E-Commerce, Government, Manufacturing, Media and Entertainment, Telecom, and More). The Market Forecasts are Provided in Terms of IT Load Capacity (Megawatt).
Northern California Data Center Market Trends and Insights
AI-Centric Hyperscale Tranche Demand
Capital expenditure from Microsoft, Meta, and other hyperscalers exceeded USD 145 billion in fiscal 2025, and a significant portion funds new Northern California data centers that host latency-sensitive inference clusters. Operators book power slots four or more years ahead under PG&E Rule 30 to guarantee tariff certainty, which swells utility interconnection queues even before ground breaks. New campuses feature 200-500 MW single-tenant blocks that consolidate AI training, model tuning, and vector database workloads in one location. Rack-level densities regularly top 100 kW, driving widespread adoption of direct-to-chip and immersion cooling. Because such installations cannot be accommodated in legacy multi-tenant halls, developers increasingly pursue greenfield sites near existing substations to shorten cable runs and tensile losses.
Surging Film-Render and Streaming Workloads
Raw footage for modern features can exceed 2 petabytes, and converting 4K to 8K formats multiplies compute intensity more than fourfold. Cloud-based render workloads thus migrate north from Los Angeles to tap lower latency interconnect hubs in Santa Clara. Netflix, Apple, and Amazon maintain Bay Area edge nodes to pre-position high-resolution masters before global distribution, shielding studios from trans-Pacific congestion. Rising demand for 8K and volumetric video also boosts the Northern California data center market as equipment vendors colocate content delivery networks next to hyperscale fabrics. Although Hollywood redevelopment focuses on Southern California, Bay Area carriers benefit from the backhaul traffic that terminates at San Jose carrier hotels.
Scarce 230 kV Interconnects on PG&E Grid
PG&E recorded 9.6 GW of pending data center load as of October 2025, yet only 1.4 GW advanced to detailed engineering. Smart Wires FlexNet devices unlocked 100 MW at Los Esteros substation, but operators still face multi-year delays for new loop additions. Silicon Valley Power offers more attractive tariffs, though its 18-square-mile service territory constrains capacity. Many developers now negotiate split feeds from both utilities to de-risk schedule slippage, albeit at higher upfront cost. Continued scarcity caps near-term expansion of the Northern California data center market, nudging some hyperscalers to scout inland or Pacific Northwest alternatives.
Other drivers and restraints analyzed in the detailed report include:
- West-Coast Subsea-Cable Landings
- 400 MW Southern-CA Solar plus BESS PPAs
- Lengthy Power-Delivery Queue (48-60 Months)
For complete list of drivers and restraints, kindly check the Table Of Contents.
Segment Analysis
Hyperscale sites led the Northern California data center market's expansion, posting a 6.12% CAGR through 2031 as single-tenant campuses balloon beyond 300 MW. This form factor thrives because GPU training clusters become more efficient when network hops are minimized, and power management is centralized. Large facilities accounted for 42.42% of the Northern California data center market share in 2025. Large facilities between 50 MW and 150 MW retain relevance for mixed-tenant clouds that still handle enterprise lift-and-shift workloads. Medium-scale builds of 10-50 MW increasingly serve regional edge on-ramps for streaming and SaaS gateways. Small installations under 10 MW persist for disaster-recovery, IoT aggregation, and latency-critical financial trading. The Northern California data center market continues to tilt toward vertical designs that stack multiple 4 MW halls on scarce parcels, optimizing land costs while maintaining clear paths for power and chilled water retrofits.
Second-generation hyperscale campuses in Santa Clara incorporate 30-foot clear heights and reinforced floor slabs to accommodate immersion tanks without structural upgrades. Developers site step-down substations within property lines to avoid meter-fee markups, and redundant 230 kV feeders branch into radial 34.5 kV loops. Modular block construction shortens build schedules from 24 to 18 months, an increasingly significant differentiator as customer pipelines advance. With such dynamics, hyperscale capacity now represents the most contested slice of the Northern California data center market, drawing joint ventures between infrastructure funds and cloud providers to pool land, capital, and staffing.
Tier 3 remained dominant in 2025 with 48.38% Northern California data center market share, a legacy of enterprise hosting norms that tolerated brief maintenance windows. Tier 4 capacity, however, accelerates at 6.32% CAGR because GPU inference workloads crash when milliseconds of interruption occur. Financial market regulators and hyperscalers alike insist on 99.995% uptime, steering new builds toward 2N+1 electrical topologies, concurrently maintainable switchgear, and dual active chillers. Construction premiums of roughly 40% are offset by lower service-level-agreement penalties and reduced unplanned outage costs.
Seismic engineering further pushes designs to Tier 4 thanks to Zone 4b requirements that mandate base isolation or moment-frame structures capable of absorbing 0.5 g peak ground acceleration. Operators adopt triple redundant fuel systems and automated load-shedding controls that prioritize AI inference workloads over batch analytics. Skills scarcity remains an obstacle because Tier IV-certified technicians command premium wages; nevertheless, owners now fund apprenticeship programs to sustain pipelines of electrical and mechanical specialists who can keep fault-tolerant environments online.
Complete Report Scope:
- By Data Center Size
- Small
- Medium
- Large
- Hyperscale
- By Tier Type
- Tier 1 and 2
- Tier 3
- Tier 4
- By Data Center Type
- Hyperscale / Self-Built
- Enterprise / Edge
- Colocation
- Non-Utilized
- Utilized
- Retail Colocation
- Wholesale Colocation
- By End User
- BFSI
- IT and ITES
- E-Commerce
- Government
- Manufacturing
- Media and Entertainment
- Telecom
- Other End Users
List of Companies Covered in this Report:
- CoreSite Realty Corporation
- Cyxtera Technologies, Inc.
- Aligned Data Centers, LLC
- Vantage Data Centers, LLC
- Iron Mountain Data Centers
- STACK Infrastructure, Inc.
- Switch, Inc.
- NTT Global Data Centers Americas, Inc.
- Evoque Data Center Solutions, LLC
- DataBank, Ltd.
- QTS Realty Trust, LLC
- EdgeCore Digital Infrastructure, LLC
- EdgeConneX, Inc.
- Flexential Corp.
- H5 Data Centers, LLC
- Lumen Technologies, Inc.
- Stream Data Centers, LLC
- T5 Data Centers, LLC
- Digital Realty
- Nautilus Data Technologies, Inc.
- CyrusOne LLC
- Element Critical, Inc.
Additional Benefits:
- The market estimate (ME) sheet in Excel format
- 3 months of analyst support
TABLE OF CONTENTS
1 INTRODUCTION
- 1.1 Study Assumptions and Market Definition
- 1.2 Scope of the Study
2 RESEARCH METHODOLOGY
3 EXECUTIVE SUMMARY
4 MARKET LANDSCAPE
- 4.1 Market Overview
- 4.2 Market Drivers
- 4.2.1 AI-centric Hyperscale Tranche Demand
- 4.2.2 Surging Film-Render and Streaming Workloads
- 4.2.3 West-Coast Subsea-Cable Landings (Hawaiki Nui, CAP-1)
- 4.2.4 400 MW Southern-CA Solar + BESS PPAs
- 4.2.5 Revitalisation of Hollywood Sound Stages into Edge DCs
- 4.2.6 LA "Clean Grid 2045" Incentives for On-site Micro-SMRs
- 4.3 Market Restraints
- 4.3.1 Scarce 230 kV Interconnects on PG&E Grid
- 4.3.2 Lengthy Power-Delivery Queue (48-60 Months)
- 4.3.3 Rising Seismic-Design CAPEX Premiums (Zone 4b)
- 4.3.4 Shortage of Tier IV-Certified Technicians and Electricians
- 4.4 Market Outlook
- 4.4.1 IT Load Capacity
- 4.4.2 Raised Floor Space
- 4.4.3 Colocation Revenue
- 4.4.4 Installed Racks
- 4.4.5 Rack Space Utilisation
- 4.4.6 Submarine Cable
- 4.5 Key Industry Trends
- 4.5.1 Smartphone Users
- 4.5.2 Data Traffic per Smartphone
- 4.5.3 Mobile Data Speed
- 4.5.4 Broadband Data Speed
- 4.5.5 Fiber Connectivity Network
- 4.5.6 Regulatory Framework
- 4.6 Value Chain and Distribution Channel Analysis
- 4.7 Porter's Five Forces Analysis
- 4.7.1 Threat of New Entrants
- 4.7.2 Bargaining Power of Suppliers
- 4.7.3 Bargaining Power of Buyers
- 4.7.4 Threat of Substitutes
- 4.7.5 Competitive Rivalry
- 4.8 Impact of Macroeconomic Factors on the Market
5 MARKET SIZE AND GROWTH FORECASTS (MEGAWATT)
- 5.1 By Data Center Size
- 5.1.1 Small
- 5.1.2 Medium
- 5.1.3 Large
- 5.1.4 Hyperscale
- 5.2 By Tier Type
- 5.2.1 Tier 1 and 2
- 5.2.2 Tier 3
- 5.2.3 Tier 4
- 5.3 By Data Center Type
- 5.3.1 Hyperscale / Self-Built
- 5.3.2 Enterprise / Edge
- 5.3.3 Colocation
- 5.3.3.1 Non-Utilized
- 5.3.3.2 Utilized
- 5.3.3.2.1 Retail Colocation
- 5.3.3.2.2 Wholesale Colocation
- 5.4 By End User
- 5.4.1 BFSI
- 5.4.2 IT and ITES
- 5.4.3 E-Commerce
- 5.4.4 Government
- 5.4.5 Manufacturing
- 5.4.6 Media and Entertainment
- 5.4.7 Telecom
- 5.4.8 Other End Users
6 COMPETITIVE LANDSCAPE
- 6.1 Market Share Analysis
- 6.2 Company Landscape
- 6.3 Company Profiles (Includes Global Level Overview, Market Level Overview, Core Segments, Financials as Available, Strategic Information, Market Rank/Share, Products and Services, and Recent Developments)
- 6.3.1 CoreSite Realty Corporation
- 6.3.2 Cyxtera Technologies, Inc.
- 6.3.3 Aligned Data Centers, LLC
- 6.3.4 Vantage Data Centers, LLC
- 6.3.5 Iron Mountain Data Centers
- 6.3.6 STACK Infrastructure, Inc.
- 6.3.7 Switch, Inc.
- 6.3.8 NTT Global Data Centers Americas, Inc.
- 6.3.9 Evoque Data Center Solutions, LLC
- 6.3.10 DataBank, Ltd.
- 6.3.11 QTS Realty Trust, LLC
- 6.3.12 EdgeCore Digital Infrastructure, LLC
- 6.3.13 EdgeConneX, Inc.
- 6.3.14 Flexential Corp.
- 6.3.15 H5 Data Centers, LLC
- 6.3.16 Lumen Technologies, Inc.
- 6.3.17 Stream Data Centers, LLC
- 6.3.18 T5 Data Centers, LLC
- 6.3.19 Digital Realty
- 6.3.20 Nautilus Data Technologies, Inc.
- 6.3.21 CyrusOne LLC
- 6.3.22 Element Critical, Inc.
7 MARKET OPPORTUNITIES AND FUTURE OUTLOOK
- 7.1 White-Space and Unmet-Need Assessment

 資料中心:研究訂閱
 全快閃資料中心市場:全球市場預測(2026-2032)
 人工智慧資料中心的光纖檢測、清洗和認證系統的市場規模、佔有率和成長預測(2026-2032 年)面向人工智慧資料中心的高密度光纖連接基礎設施的市場規模、佔有率和成長預測(2026-2032 年)
 2026年全球資料中心市場報告資料中心匯流排市場:依產品類型、應用、資料中心類型、最終用戶、國家及地區分類-全球產業分析、市場規模、市場佔有率及2026年至2033年預測
 資料中心發展—日本版,2026
 全球資料中心匯流排市場:依導體類型、空間類型、額定電流、IT負載、電源、資料中心類型和地區分類-預測至2032年
 亞特蘭大資料中心:市場佔有率分析、產業趨勢與統計及成長預測(2026-2031 年)倫敦資料中心:市場佔有率分析、產業趨勢與統計及成長預測(2026-2031 年)