

 |
市場調查報告書
商品編碼
2119589
紐約資料中心:市場佔有率分析、產業趨勢與統計及成長預測(2025-2031 年)New York Data Center - Market Share Analysis, Industry Trends & Statistics, Growth Forecasts (2025 - 2031) |
||||||

※ 本網頁內容可能與最新版本有所差異。詳細情況請與我們聯繫。
根據 Mordor Intelligence 預測,紐約資料中心市場規模預計將在 2025 年達到 854.5 兆瓦,到 2031 年達到 1,154.2 兆瓦,預測期內複合年成長率為 5.14%。
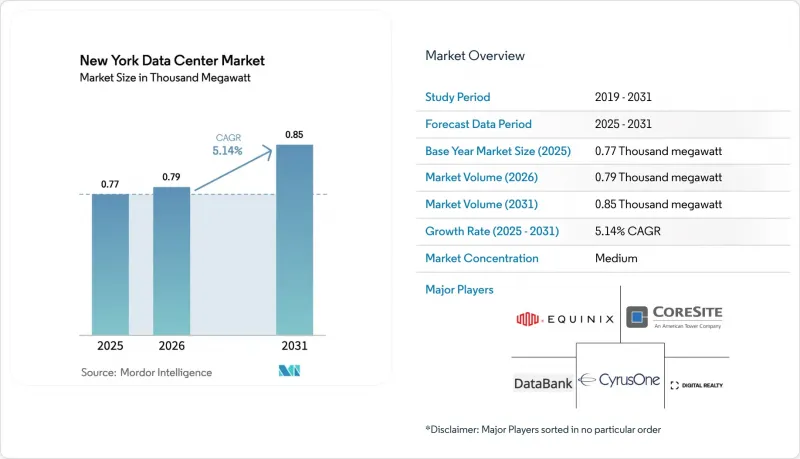
本報告按規模(小規模、中型、大型、超大型)、等級(Tier I-II、Tier III、Tier IV)和運作狀態(運作中、非運作)對資料中心進行分類。市場預測以價值(兆瓦)為單位。
紐約資料中心市場趨勢與洞察
擴展超大規模雲端運營的基礎
AWS、微軟和Google已宣布計劃在都市區建造容量達數百兆瓦的園區,通常還會配備專用的 400G 互連節點,用於邊緣工作負載。光是 Digital Realty 一家公司在 2024 年第三季就獲得了價值 5.21 億美元的新租賃協議,平均收益率高達 12%,這凸顯了客戶願意為近距離容量支付溢價。每個機架的功率密度已接近 50 千瓦,而能夠進行浸沒式冷卻的閒置頻段如今已成為超大規模 RFP(徵求提案)中的標準要求。營運商正在確保簽訂長期可再生能源購買協議並配備電池能源儲存系統,以固定價格保障容量。這些項目的規模和速度正在擴大全球富裕的房地產所有者與小規模的本地供應商之間的差距。
資本市場延遲優勢
高頻交易平台以微秒為單位衡量距離,這推動了對主要交易所方圓 50 英里範圍內設施的需求。納斯達克的託管機房訂單確認循環時間不到 50 微秒,而位於錫考克斯的 Equinix NY4 機房的機架月租金接近 3,500 美元。這些設施主要採用裸機部署而非虛擬化實例,從而避免了虛擬機器管理程式的開銷。以接近性為導向的定價模式使業主能夠避免託管服務普遍的商品化,並維持較高的EBITDA獲利率。交易所營運的設施,例如位於馬霍瓦的紐約證券交易所園區,進一步將市場細分為按延遲分層的叢集。
曼哈頓房地產和建築成本
曼哈頓中心區域的維修工程成本通常超過每平方英尺400美元,是郊區平均成本的兩倍,這給預期收益帶來了壓力。同時,諸如擁有1320套公寓的SoMA重建項目等住宅改造項目,也加劇了合適建築供應的緊張。工業和商業稅收抵免計劃(ICAP)的稅收優惠政策在96街以南基本上無法享受,導致新開發項目紛紛轉向布魯克林和皇后區。位於外城區的業主如果能夠提供配備齊全的毛坯辦公空間,便會與超大規模企業簽訂預租協議,從而避免支付中城的高昂租金。
細分市場分析
到2024年,小規模資料中心將佔據44%的市場佔有率,這反映出企業託管部署和多租戶設施在支援紐約多元化商業生態系統中的主導地位。大型/超大規模設施是成長最快的細分市場,到2030年複合年成長率將達到6.1%,這主要得益於雲端服務供應商和人工智慧工作負載對高功率密度和專用冷卻基礎設施的需求。這種規模分佈反映了市場從傳統企業託管向支援現代數位應用的超大規模架構的演變。
中型資料中心(15-50兆瓦)是許多金融服務部署的基礎,它們既能為高頻交易系統提供所需的容量,又能保持客製化配置的柔軟性。微型資料中心(小於5兆瓦)滿足邊緣運算應用和備份設施等特定細分市場的需求,但隨著各機構將業務整合到更大、更有效率的設施中,其市場佔有率持續下降。 Related Companies公司450億美元的開發平臺主要集中在大型資料中心,其中一些專案規模超過100兆瓦,以滿足超大規模資料中心的需求(Data Center Dynamics)。大型資料中心的發展趨勢源自於電力採購、冷卻效率和營運管理的規模經濟效益,超大規模部署的電源使用效率(PUE)低於1.2,而小規模資料中心的PUE則為1.5-1.8。
其他好處:
- Excel格式的市場預測(ME)表
- 3個月的分析師支持
目錄
第1章:引言
- 研究假設和市場定義
- 調查範圍
第2章:調查方法
第3章執行摘要
第4章 市場狀況
- 市場概覽
- 市場促進因素
- 擴展超大規模雲端部署的範圍
- 資本市場中的延遲優勢(靠近華爾街的邊緣節點)
- 紐約州CLCPA可再生能源信用額度和綠色電價
- 透過將海底光纜「AquaComms AEx」和「Confluence-1」登陸陸地,實現了更高的光纖密度。
- 將市中心的空置辦公大樓改造成資料中心。
- 面向地方政府的微電網和現場燃料電池項目
- 市場限制因素
- 曼哈頓房地產價格和建築成本
- 第97號地方法律規定的碳排放上限
- 工會成員電工短缺
- 布魯克林皇后變電所容量瓶頸
- 價值供應鏈分析
- 監理情勢
- 技術展望
第5章 市場規模與成長預測
- 按資料中心規模
- 小規模
- 中號
- 大規模
- 超大型
- 超大規模
- 層級特定
- 一級和二級
- Tier III
- Tier IV
- 按運作狀態
- 無法運作
- 運作中
- 搭配類型
- 零售
- 批發的
- 超大規模
- 最終用戶
- BFSI
- 資訊科技/通訊
- 媒體與娛樂
- 政府/教育
- 醫療保健和生命科學
- 其他最終用戶
- 搭配類型
第6章 競爭情勢
- 市佔率分析
- 公司簡介
- Metanet, Inc.
- ColoHouse Netherlands BV
- ServerMania Inc.
- Digital Realty Trust Inc.
- DataGryd Datacenters LLC
- H5 Data Centers
- fifteenfortyseven Critical Systems Realty, LLC
- Blue Hill Data Services, Inc.
- iTEL Networks Inc.
- DataBank Holdings Ltd.
- Telehouse International Corporation of Europe Ltd
- Equinix Inc.
- Lumen Technologies
- FirstLight Fiber, Inc
- Superb Internet Corp.(CherryRoad Technologies)
- Cogent Communications Holdings, Inc.
- 365 Data Centers
- CyrusOne LLC
- Crown Castle Inc.
- Zenlayer Inc.
- Sentinel Data Centers, LLC
- Centrilogic
- DataVerge(COLOGUARD ENTERPRISE SOLUTIONS LLC)
第7章 市場機會與未來展望
According to Mordor Intelligence, the new york data center market size stands at 854.5 MW in 2025 and is projected to reach 1,154.2 MW by 2031, representing a 5.14% CAGR over the forecast period.
This report is Segmented by Data Center Size (Small, Medium, Large, Mega), Tier Standard (Tier I-II, Tier III, Tier IV), and Absorption (Utilized, Non-Utilized). The Market Forecasts are Provided in Terms of Value (MW).
New York Data Center Market Trends and Insights
Hyperscale Cloud Footprint Expansion
AWS, Microsoft, and Google have each committed multi-hundred-megawatt campuses in the metro, often pairing them with dedicated 400 G interconnect nodes for edge workloads. Digital Realty alone booked USD 521 million of new leases in Q3 2024, with an average yield of 12%, underscoring customer willingness to pay premiums for proximate capacity. Power density per rack is moving toward 50 kW, and immersion-ready white space is now a standard requirement in hyperscale RFPs. Operators are locking in long-term renewable power purchase agreements and battery energy storage to guarantee capacity at fixed pricing. The scale and speed of these projects are widening the gap between well-capitalized global landlords and smaller regional providers.
Capital-Markets Latency Advantage
High-frequency trading desks measure distance in microseconds, driving demand for facilities within a 50-mile ring of the major exchanges. NASDAQ's co-location suite reports order-acknowledge loops below 50 μs, while racks at Equinix NY4 in Secaucus command monthly rents near USD 3,500. Bare-metal deployments rather than virtualized instances dominate these footprints, eliminating hypervisor overhead. Proximity-driven pricing shields landlords from broader colocation commoditization, sustaining premium EBITDA margins. Exchange-operated facilities such as the NYSE campus in Mahwah further segment the market into latency-tiered clusters.
Manhattan Real-Estate and Construction Costs
Core Manhattan retrofit projects often exceed USD 400 per square foot, double the outer-borough average, shrinking pro-forma returns. Competing residential conversions-such as the 1,320-unit SoMA redevelopment-tighten the supply of suitable buildings. Tax abatements under the Industrial and Commercial Abatement Program rarely apply south of 96th Street, tilting new developments toward Brooklyn and Queens. Landlords able to deliver powered shell space in the outer boroughs are winning hyperscale pre-leases that bypass Midtown sticker shock.
Other drivers and restraints analyzed in the detailed report include:
- NY CLCPA Renewable-Energy Credits and Green Tariffs
- Fiber Densification via Subsea Cable Landings
- Local Law 97 Carbon-Emission Caps
For complete list of drivers and restraints, kindly check the Table Of Contents.
Segment Analysis
Small data centers command 44% market share in 2024, reflecting the predominance of enterprise colocation deployments and multi-tenant facilities that serve New York's diverse business ecosystem. Large/hyperscale facilities represent the fastest-growing segment at 6.1% CAGR through 2030, driven by cloud service providers and AI workload requirements that demand massive power densities and specialized cooling infrastructure. The size distribution reflects the market's evolution from traditional enterprise hosting toward hyperscale architectures that support modern digital applications.
Medium-sized facilities (15-50 MW) serve as the backbone for many financial services deployments, offering the capacity needed for high-frequency trading systems while maintaining the flexibility for custom configurations. Micro data centers (<5 MW) fill specialized niches including edge computing applications and backup facilities, though their market share continues to decline as organizations consolidate operations into larger, more efficient facilities. Related Companies' USD 45 billion development pipeline focuses primarily on large-scale facilities, with individual projects exceeding 100 MW to serve hyperscale requirements Data Center Dynamics. The trend toward larger facilities is driven by economies of scale in power procurement, cooling efficiency, and operational management, with hyperscale deployments achieving Power Usage Effectiveness ratios below 1.2 compared to 1.5-1.8 for smaller facilities.
Complete Report Scope:
- By Data Center Size
- Small
- Medium
- Large
- Mega
- Massive
- By Tier Type
- Tier I and II
- Tier III
- Tier IV
- By Absorption
- Non-Utilized
- Utilized
- Colocation Type
- Retail
- Wholesale
- Hyperscale
- End-User
- BFSI
- IT and Telecom
- Media and Entertainment
- Government and Education
- Healthcare and Life Sciences
- Other End Users
- Colocation Type
List of Companies Covered in this Report:
- Metanet, Inc.
- ColoHouse Netherlands B.V.
- ServerMania Inc.
- Digital Realty Trust Inc.
- DataGryd Datacenters LLC
- H5 Data Centers
- fifteenfortyseven Critical Systems Realty, LLC
- Blue Hill Data Services, Inc.
- iTEL Networks Inc.
- DataBank Holdings Ltd.
- Telehouse International Corporation of Europe Ltd
- Equinix Inc.
- Lumen Technologies
- FirstLight Fiber, Inc
- Superb Internet Corp. (CherryRoad Technologies)
- Cogent Communications Holdings, Inc.
- 365 Data Centers
- CyrusOne LLC
- Crown Castle Inc.
- Zenlayer Inc.
- Sentinel Data Centers, LLC
- Centrilogic
- DataVerge (COLOGUARD ENTERPRISE SOLUTIONS LLC)
Additional Benefits:
- The market estimate (ME) sheet in Excel format
- 3 months of analyst support
TABLE OF CONTENTS
1 INTRODUCTION
- 1.1 Study Assumptions and Market Definition
- 1.2 Scope of the Study
2 RESEARCH METHODOLOGY
3 EXECUTIVE SUMMARY
4 MARKET LANDSCAPE
- 4.1 Market Overview
- 4.2 Market Drivers
- 4.2.1 Hyperscale cloud footprint expansion
- 4.2.2 Capital-markets latency advantage (edge nodes near Wall St.)
- 4.2.3 NY CLCPA renewable-energy credits and green tariffs
- 4.2.4 Fiber densification via subsea "AquaComms AEx" and "Confluence-1" landings
- 4.2.5 Vacant Midtown office-to-data-center conversions
- 4.2.6 Municipal micro-grids and on-site fuel-cells program
- 4.3 Market Restraints
- 4.3.1 Manhattan real-estate and construction costs
- 4.3.2 Local Law 97 carbon-emission caps
- 4.3.3 Unionized electrical-labor shortage
- 4.3.4 Brooklyn-Queens substation capacity bottleneck
- 4.4 Value / Supply-Chain Analysis
- 4.5 Regulatory Landscape
- 4.6 Technological Outlook
5 MARKET SIZE AND GROWTH FORECASTS
- 5.1 By Data Center Size
- 5.1.1 Small
- 5.1.2 Medium
- 5.1.3 Large
- 5.1.4 Mega
- 5.1.5 Massive
- 5.2 By Tier Type
- 5.2.1 Tier I and II
- 5.2.2 Tier III
- 5.2.3 Tier IV
- 5.3 By Absorption
- 5.3.1 Non-Utilized
- 5.3.2 Utilized
- 5.3.2.1 Colocation Type
- 5.3.2.1.1 Retail
- 5.3.2.1.2 Wholesale
- 5.3.2.1.3 Hyperscale
- 5.3.2.2 End-User
- 5.3.2.2.1 BFSI
- 5.3.2.2.2 IT and Telecom
- 5.3.2.2.3 Media and Entertainment
- 5.3.2.2.4 Government and Education
- 5.3.2.2.5 Healthcare and Life Sciences
- 5.3.2.2.6 Other End Users
- 5.3.2.1 Colocation Type
6 COMPETITIVE LANDSCAPE
- 6.1 Market Share Analysis
- 6.2 Company Profiles (includes Global Level Overview, Market Level Overview, Core Segments, Financials as available, Strategic Information, Market Rank/Share, Products and Services, Recent Developments)
- 6.2.1 Metanet, Inc.
- 6.2.2 ColoHouse Netherlands B.V.
- 6.2.3 ServerMania Inc.
- 6.2.4 Digital Realty Trust Inc.
- 6.2.5 DataGryd Datacenters LLC
- 6.2.6 H5 Data Centers
- 6.2.7 fifteenfortyseven Critical Systems Realty, LLC
- 6.2.8 Blue Hill Data Services, Inc.
- 6.2.9 iTEL Networks Inc.
- 6.2.10 DataBank Holdings Ltd.
- 6.2.11 Telehouse International Corporation of Europe Ltd
- 6.2.12 Equinix Inc.
- 6.2.13 Lumen Technologies
- 6.2.14 FirstLight Fiber, Inc
- 6.2.15 Superb Internet Corp. (CherryRoad Technologies)
- 6.2.16 Cogent Communications Holdings, Inc.
- 6.2.17 365 Data Centers
- 6.2.18 CyrusOne LLC
- 6.2.19 Crown Castle Inc.
- 6.2.20 Zenlayer Inc.
- 6.2.21 Sentinel Data Centers, LLC
- 6.2.22 Centrilogic
- 6.2.23 DataVerge (COLOGUARD ENTERPRISE SOLUTIONS LLC)
7 MARKET OPPORTUNITIES AND FUTURE OUTLOOK
- 7.1 White-Space and Unmet-Need Assessment

 亞特蘭大資料中心:市場佔有率分析、產業趨勢與統計及成長預測(2026-2031 年)倫敦資料中心:市場佔有率分析、產業趨勢與統計及成長預測(2026-2031 年)北加州資料中心:市佔率分析、產業趨勢與統計及成長預測(2026-2031 年)北維吉尼亞資料中心:市場佔有率分析、產業趨勢與統計及成長預測(2026-2031 年)奧斯汀資料中心:市場佔有率分析、產業趨勢與統計及成長預測(2026-2031 年)奧斯陸資料中心:市場佔有率分析、產業趨勢與統計資料、成長預測(2026-2031 年)新澤西州資料中心:市場佔有率分析、行業趨勢和統計數據以及成長預測(2026-2031 年)清奈資料中心:市場佔有率分析、產業趨勢與統計及成長預測(2026-2032)芝加哥資料中心:市場佔有率分析、產業趨勢與統計及成長預測(2026-2031 年)達拉斯資料中心:市場佔有率分析、產業趨勢與統計及成長預測(2026-2031 年)