


 |
市場調查報告書
商品編碼
2119594
亞特蘭大資料中心:市場佔有率分析、產業趨勢與統計及成長預測(2026-2031 年)Atlanta Data Center - Market Share Analysis, Industry Trends & Statistics, Growth Forecasts (2026 - 2031) |
||||||

※ 本網頁內容可能與最新版本有所差異。詳細情況請與我們聯繫。
據 Mordor Intelligence 稱,2026 年亞特蘭大資料中心市場規模(以 IT 安裝電力容量計)預計將達到 1.82 GW,高於 2025 年的 0.92 GW。
此外,2031 年的預測表明,IT 安裝功率容量將達到 7.68 GW,從 2026 年到 2031 年的複合年成長率為 26.95%。
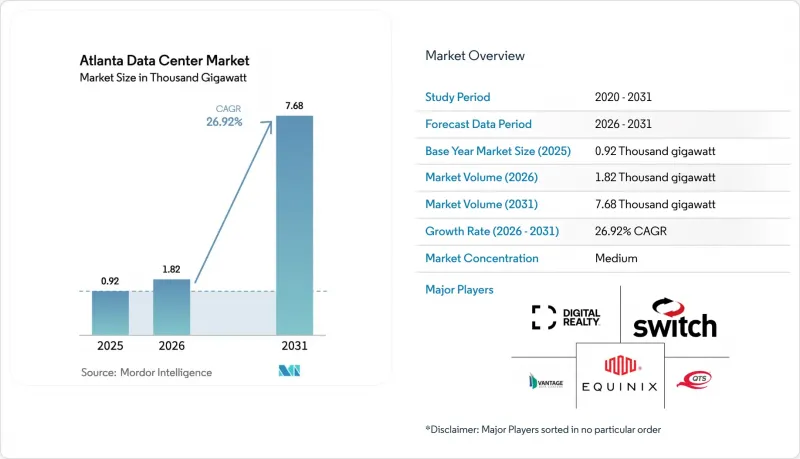
本報告按規模(小規模、中型、大型、超大型、巨型)、等級(Tier 1 & 2、Tier 3、Tier 4)和資料中心類型(雲端服務供應商(CSP)、託管等)對資料中心進行分類。市場預測以美元計價。
亞特蘭大資料中心市場的趨勢與洞察
AI/雲端主導的超大規模建設:重新定義電力需求
亞特蘭大最新的超大規模資料中心園區採用超過 40 千瓦的機架密度設計,以滿足人工智慧訓練叢集的需求。光是微軟就投資了 18 億美元,在園區內建造了三個總裝置容量總合324 兆瓦的設施。根據電力研究院 (EPRI) 的數據,人工智慧目前已佔全美資料中心電力消耗量的 10% 至 20%,這意味著到 2030 年,該產業的電力需求可能達到美國發電量的 9.1%。由於配備了液冷系統、額外的開關設備和現場變電站,這些新建設施的造價較高,而現有資料中心則面臨維修的壓力。這些設施集中在南部都會區,形成了一個專用的公用設施區域,冗餘電網、環路光纖和占地 100 英畝的土地在此匯聚。
邊緣運算和延遲敏感型工作負載:推動在都市區的部署
行動遊戲、遠端醫療和金融交易平台正在亞特蘭大市中心建立一個微型設施網路。美國鐵塔公司(American Tower)在桃樹中心(Peachtree Center)附近增設了邊緣節點,將跳數減少到5毫秒以內。 Vapor IO和康卡斯特(Comcast)正在試行最後一公里邊緣服務,以與現有佈線基礎設施整合。 EdgeConneX在市政廳方圓3英里內運營兩個16兆瓦的站點。這些部署正在降低人工智慧推理、總合媒體和自動駕駛汽車遙測的網路延遲,使亞特蘭大都會區成為核心和邊緣連接的樞紐。
電力供應前置作業時間:關鍵基礎設施的瓶頸
喬治亞電力公司預測,到2035年,工業用電需求將成長17倍,其中資料中心將佔成長的80%。高壓輸電線路擴建的平均前置作業時間接近四年,迫使工程分階段進行,並需要在現場安裝燃氣渦輪機。大都會圈的市長警告說,到2030年,需要新增8.2吉瓦的裝置容量才能滿足訂單速度。新的州法規要求大型專案共同承擔變電站升級的費用,以保護住宅用戶免受電價上漲的影響。
細分市場分析
到2025年,巨型資料中心將佔亞特蘭大資料中心市場佔有率的53.12%,相當於467.5兆瓦的IT運作中容量。隨著已公佈的擴建計畫運作,預計到2020年代中期,這一主導地位將推動亞特蘭大資料中心市場的巨型資料中心建設規模達到1.57吉瓦。規模經濟將使營運商能夠降低電力成本,並在機房層級而非行層級部署支援SCADA的配電系統。亞馬遜網路服務(AWS)在喬治亞投資110億美元的項目包含多個超過100兆瓦的資料中心,為園區級容錯能力提供了藍圖。 「大型」(20-100兆瓦)資料中心市場預計將以28.73%的年成長率成長,因為第二大雲端服務供應商和SaaS供應商都在尋求面向未來的資料中心位置。同時,「中型」和「大型」資料中心在私有雲端遷移工作負載、邊緣快取和基於合規性的隔離區等方面繼續發揮至關重要的作用。小規模設施(小於 5 兆瓦)正在將重點轉移到電信營運商和研究設施的邊緣叢集,在這些集群中,接近性比瓦級容量更重要。
從經濟角度來看,該巨型園區透過整合屋頂熱交換迴路和現場冷水機組,將PUE值維持在1.2左右。土地整合策略透過將地塊合併為200英畝的超級園區,減少了每兆瓦供電所需的市政批准數量。該策略還支持多棟建築分階段開發,使資本支出與預租協議相匹配,從而維持開發商的內部收益率(IRR)。未來五年,隨著人工智慧機架密度超過80kW,專用電力隧道成為必需,亞特蘭大的資料中心市場預計將再向超大型和巨型資料中心傾斜12個百分點。
到 2025 年,三級資料中心將占到運作占地面積的 65.72%,鞏固其作為關鍵任務型且對成本高度敏感部署的標準地位。隨著企業逐步淘汰自建伺服器機房,預計到 2031 年,亞特蘭大資料中心市場分配給三級資料中心的容量將超過 2.42 吉瓦。同時,四級資料中心正以 28.54% 的複合年成長率成長,這主要得益於無法容忍單點故障的機器學習叢集、金融科技清算系統以及國防相關工作負載的需求。營運商透過提供服務等級協定 (SLA) 來證明其更高資本支出 (CAPEX) 的合理性,這些協定的特點是 99.999% 的運轉率(五個九)和更短的平均修復時間 (MTTR)。 Flexential 位於阿爾法利塔的資料中心體現了四級資料中心的經濟性,採用液冷、上流式散熱系統,以及每平方英尺 1500 瓦的功率密度。
一級和二級設施主要用作檔案儲存、臨時存放區和災害復原中心,但隨著價格差距縮小,其市場佔有率正在下降。在設計趨勢方面,三級設施正在整合一些四級設施的元素,例如雙電源供電、分段式母線槽和電池能源儲存系統,以確保資產的未來潛力,同時避免承擔四級設施的全部成本。
其他好處:
- Excel格式的市場預測(ME)表
- 3個月的分析師支持
目錄
第1章:引言
- 研究假設和市場定義
- 調查範圍
第2章:調查方法
第3章執行摘要
第4章 市場狀況
- 市場概覽
- 市場促進因素
- AI/雲端主導的超大規模建設
- 邊緣運算和延遲敏感型工作負載
- 喬治亞的稅收優惠和可再生能源優惠政策
- 新星地區人工智慧電力供應緊張的加劇正在改變需求。
- I-285 和 I-20 沿線的剩餘暗纖
- 經默特爾比奇登陸點升級海底電纜
- 市場限制因素
- 電源供應前置作業時間
- 土地和建築成本上漲
- 預計將對冷卻水的使用進行限制。
- 高密度建築業熟練勞動力短缺
- 數位基礎設施指標
- 智慧型手機用戶數量
- 每部智慧型手機的資料通訊
- 行動資料通訊速度
- 寬頻資料通訊速度
- 價值供應鏈分析
- 監理情勢
- 技術展望
- 評估宏觀經濟趨勢對市場的影響
- 波特五力模型
第5章 市場規模及成長預測(兆瓦)
- 按資料中心規模
- 小規模
- 中等的
- 大規模
- 超大規模
- 層級類型
- 一級和二級
- 三級
- 第四級
- 依資料中心類型
- 雲端服務供應商(CSP)
- 企業級、模組化、邊緣運算
- 搭配
- 未使用的
- 用過的
- 搭配類型
- 零售
- 批發的
- 搭配類型
- 按最終用戶行業分類
- 雲端運算和資訊技術
- 溝通
- 媒體與娛樂
- 政府
- BFSI
- 製造業
- 電子商務
- 其他最終用戶
第6章 競爭情勢
- 市場集中度
- 策略趨勢
- 市佔率分析(兆瓦)
- 公司簡介
- QTS Realty Trust
- Vantage Data Centers Management Company, LLC
- EDC VENTURE LLC(Edged)
- Digital Realty Trust Inc.
- Quadranet Systems Limited
- H5 Data Centers
- DataBank Holdings Ltd.
- EVODC, LLC(Evocative)
- Krypt
- Lumen Technologies
- Cogent Communications Holdings, Inc.
- Assurant, Inc.
- Csquare(Phoenix Infrastructure LLC)
- Summit Hosting
- EdgeConneX, Inc.
- Equinix Inc.
- Apotech Group
- Vault Networks, Inc.
- Coloblox Data Centers
- CoreSite
- Enzu Inc.
第7章 市場機會與未來展望
According to Mordor Intelligence, the atlanta data center market size in 2026 is estimated at 1.82 GW of installed IT power, up from 0.92 GW in 2025, with 2031 projections showing 7.68 GW of installed IT power, growing at a 26.95% CAGR over 2026-2031.
This report is Segmented by Data Center Size (Small, Medium, Large, Massive, Mega), Tier Type (Tier 1&2, Tier 3, Tier 4), and Data Center Type (Cloud Service Providers (CSPs), Colocation Type, and More). The Market Forecasts are Provided in Terms of Value (USD).
Atlanta Data Center Market Trends and Insights
AI / Cloud-Led Hyperscale Builds: Reshaping Power Requirements
Atlanta's newest hyperscale campuses are being engineered for rack densities exceeding 40 kW to satisfy AI training clusters. Microsoft alone is investing USD 1.8 billion in three local facilities totaling 324 MW. Electric Power Research Institute notes AI already accounts for 10-20% of data-center electricity draw nationwide, a share that could push sector demand to 9.1% of U.S. generation by 2030. Premium pricing follows the newest builds owing to their liquid cooling, extra switchgear and on-site substations, while legacy halls face retrofit pressures. The clustering of these sites in the southern metro is forming purpose-built utility zones where redundant transmission, looped fiber and 100-acre parcels converge.
Edge-Computing and Latency-Sensitive Workloads: Driving Urban Deployments
Mobile gaming, tele-health and financial-trading platforms are spurring a lattice of micro-facilities across downtown Atlanta. American Tower has added edge nodes near Peachtree Center to keep hop counts under five milliseconds. Vapor IO and Comcast are piloting last-mile edge services to dovetail with existing cable plant. EdgeConneX operates two sites totaling 16 MW within a three-mile radius of city hall. These deployments trim network latency for AI inference, interactive media and autonomous-vehicle telemetry, positioning metro Atlanta as both a core and edge nexus.
Utility Power-Delivery Lead-Times: Critical Infrastructure Bottleneck
Georgia Power expects industrial electricity demand to multiply 17-fold by 2035, with data centers absorbing 80% of that growth. Average lead times for high-voltage extensions approach four years, forcing phased build-outs and on-site gas turbine deployments. Metro mayors warn that 8.2 GW of extra capacity is required by 2030 to keep pace with bookings. New state rules now compel large projects to co-fund sub-station upgrades to shield residential customers from rate hikes.
Other drivers and restraints analyzed in the detailed report include:
- Georgia Tax and Renewable-Energy Incentives: Fiscal Catalysts
- Surging AI Power Constraints in NoVA Divert Demand: Geographic Redistribution
- Escalating Land and Construction Costs: Economic Pressure Points
For complete list of drivers and restraints, kindly check the Table Of Contents.
Segment Analysis
Mega sites held 53.12% of Atlanta data center market share in 2025, translating into 467.5 MW of active IT capacity in 2025. This dominance pushes the Atlanta data center market size for mega builds toward 1.57 GW by mid-decade as announced expansions come online. Economies of scale allow operators to undercut power costs and deploy SCADA-enabled distribution at room scale rather than row scale. Amazon Web Services' USD 11 billion Georgia program involves multiple 100 MW+ blocks and sets a blueprint for campus-style resiliency. The Massive tier (20-100 MW) is forecast to climb 28.73% annually as second-tier clouds and SaaS vendors secure future-proven footprints. Meanwhile, Medium and Large categories remain relevant for private-cloud transition workloads, edge caching and compliance-driven isolation zones. Smaller (sub-5 MW) halls have pivoted toward telco edge clusters and research labs that prize proximity over watt scale.
Economically, mega campuses secure PUE values near 1.2 by integrating rooftop heat-exchanger loops and on-site chilled-water plants. Land aggregation tactics bundle parcels into 200-acre super sites, reducing municipal approvals per megawatt delivered. The strategy also supports multi-building phasing that aligns capital draws with pre-leased commitments, preserving developer IRRs. Over the next five years, the Atlanta data center market is expected to shift another 12 percentage points toward mega and massive stock as AI rack densities exceed 80 kW and require specialized power trenways.
Tier 3 inventory occupied 65.72% of active floor space in 2025, underlining its status as the standard for mission-critical yet cost-sensitive deployments. The Atlanta data center market size allocated to Tier 3 halls is projected to surpass 2.42 GW by 2031 as enterprises retire on-premises server rooms. However, Tier 4 is registering a 28.54% CAGR, buoyed by machine-learning clusters, fintech clearing systems and defense workloads that cannot tolerate a single point of failure. Operators justify the capex premium by commanding service-level agreements featuring five-nines uptime and shorter mean-time-to-repair. Flexential's Alpharetta site illustrates Tier 4 economics with liquid cooling, up-flow containment and 1,500 W per square foot densities.
Tier 1 and Tier 2 footprints cater mainly to archival storage, staging areas and disaster-recovery seats, but their share is sliding as price differentials narrow. Design trends show Tier 3 sites integrating selective Tier 4 attributes-dual utility feeds, segmented busways and battery-energy-storage systems-to future-proof assets without a full Tier 4 price tag.
Complete Report Scope:
- By Data Center Size
- Small
- Medium
- Large
- Hyperscale
- By Tier Type
- Tier 1 and 2
- Tier 3
- Tier 4
- By Data Center Type
- Cloud Service Providers (CSPs)
- Enterprise, Modular and Edge
- Colocation
- Non-Utilized
- Utilized
- Colocation Type
- Retail
- Wholesale
- Colocation Type
- By End User Industry
- Cloud and IT
- Telecom
- Media and Entertainment
- Government
- BFSI
- Manufacturing
- E-Commerce
- Other End User
List of Companies Covered in this Report:
- QTS Realty Trust
- Vantage Data Centers Management Company, LLC
- EDC VENTURE LLC (Edged)
- Digital Realty Trust Inc.
- Quadranet Systems Limited
- H5 Data Centers
- DataBank Holdings Ltd.
- EVODC, LLC (Evocative)
- Krypt
- Lumen Technologies
- Cogent Communications Holdings, Inc.
- Assurant, Inc.
- Csquare (Phoenix Infrastructure LLC)
- Summit Hosting
- EdgeConneX, Inc.
- Equinix Inc.
- Apotech Group
- Vault Networks, Inc.
- Coloblox Data Centers
- CoreSite
- Enzu Inc.
Additional Benefits:
- The market estimate (ME) sheet in Excel format
- 3 months of analyst support
TABLE OF CONTENTS
1 INTRODUCTION
- 1.1 Study Assumptions and Market Definition
- 1.2 Scope of the Study
2 RESEARCH METHODOLOGY
3 EXECUTIVE SUMMARY
4 MARKET LANDSCAPE
- 4.1 Market Overview
- 4.2 Market Drivers
- 4.2.1 AI / cloud-led hyperscale builds
- 4.2.2 Edge-computing and latency-sensitive workloads
- 4.2.3 Georgia tax and renewable-energy incentives
- 4.2.4 Surging AI power constraints in NoVA divert demand
- 4.2.5 Surplus dark-fiber along I-285 and I-20 corridors
- 4.2.6 Sub-sea cable upgrade via Myrtle Beach landing
- 4.3 Market Restraints
- 4.3.1 Utility power-delivery lead-times
- 4.3.2 Escalating land and construction costs
- 4.3.3 Prospective water-usage restrictions for cooling
- 4.3.4 Skilled labor gap for high-density builds
- 4.4 Digital Infrastructure Indicators
- 4.4.1 Smartphone Users
- 4.4.2 Data Traffic per Smartphone
- 4.4.3 Mobile Data Speed
- 4.4.4 Broadband Data Speed
- 4.5 Value / Supply-Chain Analysis
- 4.6 Regulatory Landscape
- 4.7 Technological Outlook
- 4.8 Assessment of the impact of Macro Economic Trends on the Market
- 4.9 Porter's Five Forces
- 4.9.1 Bargaining Power of Suppliers
- 4.9.2 Bargaining Power of Buyers
- 4.9.3 Threat of New Entrants
- 4.9.4 Threat of Substitutes
- 4.9.5 Competitive Rivalry
5 MARKET SIZE AND GROWTH FORECASTS (MW)
- 5.1 By Data Center Size
- 5.1.1 Small
- 5.1.2 Medium
- 5.1.3 Large
- 5.1.4 Hyperscale
- 5.2 By Tier Type
- 5.2.1 Tier 1 and 2
- 5.2.2 Tier 3
- 5.2.3 Tier 4
- 5.3 By Data Center Type
- 5.3.1 Cloud Service Providers (CSPs)
- 5.3.2 Enterprise, Modular and Edge
- 5.3.3 Colocation
- 5.3.3.1 Non-Utilized
- 5.3.3.2 Utilized
- 5.3.3.2.1 Colocation Type
- 5.3.3.2.1.1 Retail
- 5.3.3.2.1.2 Wholesale
- 5.3.3.2.1 Colocation Type
- 5.4 By End User Industry
- 5.4.1 Cloud and IT
- 5.4.2 Telecom
- 5.4.3 Media and Entertainment
- 5.4.4 Government
- 5.4.5 BFSI
- 5.4.6 Manufacturing
- 5.4.7 E-Commerce
- 5.4.8 Other End User
6 COMPETITIVE LANDSCAPE
- 6.1 Market Concentration
- 6.2 Strategic Moves
- 6.3 Market Share Analysis (MW)
- 6.4 Company Profiles (includes Global level Overview, Market level overview, Core Segments, Financials as available, Strategic Information, Market Rank/Share for key companies, Products and Services, and Recent Developments)
- 6.4.1 QTS Realty Trust
- 6.4.2 Vantage Data Centers Management Company, LLC
- 6.4.3 EDC VENTURE LLC (Edged)
- 6.4.4 Digital Realty Trust Inc.
- 6.4.5 Quadranet Systems Limited
- 6.4.6 H5 Data Centers
- 6.4.7 DataBank Holdings Ltd.
- 6.4.8 EVODC, LLC (Evocative)
- 6.4.9 Krypt
- 6.4.10 Lumen Technologies
- 6.4.11 Cogent Communications Holdings, Inc.
- 6.4.12 Assurant, Inc.
- 6.4.13 Csquare (Phoenix Infrastructure LLC)
- 6.4.14 Summit Hosting
- 6.4.15 EdgeConneX, Inc.
- 6.4.16 Equinix Inc.
- 6.4.17 Apotech Group
- 6.4.18 Vault Networks, Inc.
- 6.4.19 Coloblox Data Centers
- 6.4.20 CoreSite
- 6.4.21 Enzu Inc.
7 MARKET OPPORTUNITIES AND FUTURE OUTLOOK
- 7.1 White-space and Unmet-need Assessment

 資料中心:研究訂閱
 全快閃資料中心市場:全球市場預測(2026-2032)
 人工智慧資料中心的光纖檢測、清洗和認證系統的市場規模、佔有率和成長預測(2026-2032 年)面向人工智慧資料中心的高密度光纖連接基礎設施的市場規模、佔有率和成長預測(2026-2032 年)
 2026年全球資料中心市場報告資料中心匯流排市場:依產品類型、應用、資料中心類型、最終用戶、國家及地區分類-全球產業分析、市場規模、市場佔有率及2026年至2033年預測
 資料中心發展—日本版,2026
 全球資料中心匯流排市場:依導體類型、空間類型、額定電流、IT負載、電源、資料中心類型和地區分類-預測至2032年
 倫敦資料中心:市場佔有率分析、產業趨勢與統計及成長預測(2026-2031 年)北加州資料中心:市佔率分析、產業趨勢與統計及成長預測(2026-2031 年)