


 |
市場調查報告書
商品編碼
2119612
奧斯汀資料中心:市場佔有率分析、產業趨勢與統計及成長預測(2026-2031 年)Austin Data Center - Market Share Analysis, Industry Trends & Statistics, Growth Forecasts (2026 - 2031) |
||||||

※ 本網頁內容可能與最新版本有所差異。詳細情況請與我們聯繫。
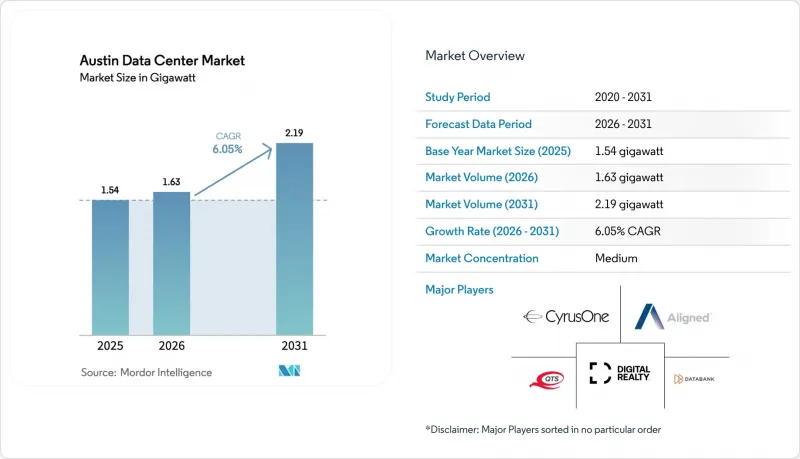
根據 Mordor Intelligence 估計,奧斯汀資料中心市場在 2025 年將達到 1.54 吉瓦,從 2026 年的 1.63 吉瓦成長到 2031 年的 2.19 吉瓦,預計在預測期(2026-2031 年)內複合年成長率為 6.05%。
本報告按資料中心規模(小規模、中型、大型、超大型、巨型)、層級(Tier 1 & 2、Tier 3、Tier 4)和資料中心類型(託管、雲端服務供應商(CSP)、企業級、模組化、邊緣)進行分類。市場預測以美元 (USD) 為單位。
奧斯汀資料中心市場趨勢與洞察
超大規模資料中心業者從達拉斯和休士頓走廊遷出
儘管德克薩斯州中部地區的土地價格低於達拉斯-沃斯堡地區的平均水平,但ERCOT的排隊數據顯示,奧斯汀附近擁有更大的互聯容量。 Alphabet和微軟已承諾實施多站點擴建計劃,優先選擇能夠容納100兆瓦新增容量的鄰近地塊。這一位置優勢將減少該州最大商業叢集的延誤,並使營運商能夠充分利用西德克薩斯的風能和近負載太陽能發電。隨著韋科以北電網擁塞狀況的加劇,開發商正將工程南移,導致赫特、泰勒和喬治城周邊地區的園區建設工程激增。一項橫跨墨西哥灣沿岸的新型海底電纜登陸夥伴關係將進一步減少往返拉丁美洲的延誤,使奧斯汀對尋求跨區域災害復原的超大規模超大規模資料中心業者更具吸引力。
由於矽山半導體產業的擴張,企業雲端業務正在外包。
三星持續向泰勒的製造地投資450億美元,並對邊緣分析提出了前所未有的要求。在2奈米製程節點上,每小時會產生Terabyte的遙測數據,需要即時計算來進行良率分析。 AMD在本地AI加速器研發方面的投入進一步推動了這一需求,同時,從光阻劑供應商到後端測試供應商,整個半導體供應鏈都需要接近性資料擷取。因此,奧斯汀的資料中心市場正在成為支撐該地區半導體生態系統的平行基礎設施的支柱,為設計中心、晶圓廠和雲端AI叢集之間提供低延遲連接。在預測期內,預計每增加一個製造製程節點,將產生30-50兆瓦的額外運算需求,從而強化製造規模擴張和資料中心成長之間的良性循環。
電網波動性和發電限制風險
根據ERCOT的預測,到2031年,尖峰負載可能達到218吉瓦,其中資料中心預計將佔新增需求的近40%。普拉格維爾和馬諾附近138千伏線路的局部堵塞,會在西區風力發電量急劇下降時偶爾觸發負載削減指令。一些業者目前正在增設30-50兆瓦的後錶燃氣渦輪機裝置,以確保N+1供電,但監管機構仍對由此帶來的排放量增加持謹慎態度。 2025年5月,德克薩斯州立法機構擴大了公共產業委員會的權限,使其能夠審查新的大型負載接入申請,這可能會延長核准流程。在ERCOT最終確定旨在穩定備用容量的市場設計改革方案之前,限電風險將嚴重影響短期建設進度,並減緩奧斯汀資料中心市場的成長勢頭。
細分市場分析
預計2026年至2031年間,大型資料中心將吸引累積86.5億美元的資本投資,使其成為奧斯汀資料中心市場成長最快的領域。即使到了2025年,大型資料中心仍將佔總裝置容量的43.12%,但10年前建造的殼體結構設計難以容納超過80千瓦的人工智慧機架。 Aligned Data Centers公司採用DeltaFlow液冷系統的兩層樓板式建築,可實現超過140千瓦的機架密度,這種配置深受人工智慧叢集的青睞。大型園區通常佔地250至500英畝,為現場400千伏變電站提供空間,以確保多吉瓦級的擴充性。 ERCOT針對單一業主總體規劃開發的簡化互聯研究也促進了成長,與分散式擴建相比,可將前置作業時間縮短8個月。因此,超大規模部署目前佔據了開發平臺的最大佔有率,推動其複合年成長率達到 9.05%,超過了奧斯汀資料中心市場的整體表現。小規模的設施繼續服務於邊緣運算和對延遲要求極高的工作負載,但為了與高密度巨型園區保持競爭力,它們現在也開始採用模組化液冷機箱。
從長遠來看,一旦目前正在建設中的1.1吉瓦項目於2028年全面運作,該巨型園區預計將佔據奧斯汀資料中心市場至少55%的佔有率。園區營運商已簽署為期15年的再生能源購電協議(PPA),並享有批量折扣,使其每千瓦時總能源成本比中型設施的平均成本低12%。這一成本差異促使人工智慧租戶更傾向於簽署30年土地租賃協議,並降低了開發商的客戶流失風險。同時,《晶片與資訊安全法案》(CHIPS Act)下的聯邦激勵措施正在加強半導體工廠擴張與該地區運算設施位置的連結。由此形成的生態系統已將該巨型園區打造為美國中南部地區人工智慧應用的核心基礎設施。
其他好處:
- Excel格式的市場預測(ME)表
- 3個月的分析師支持
目錄
第1章:引言
- 研究假設和市場定義
- 調查範圍
第2章:調查方法
第3章執行摘要
第4章 市場狀況
- 市場概覽
- 市場促進因素
- 超大規模資料中心業者從達拉斯和休士頓走廊遷出
- 由於矽山半導體生產擴張,企業雲端服務正在外包
- 德克薩斯州對關鍵任務設施的銷售稅和財產稅豁免
- ERCOT 對壅塞區域的改革促成了成本更低的可再生能源購電協議 (PPA)。
- 自動駕駛汽車測試叢集導致邊緣運算需求增加
- 5G 密度的快速成長正在推動對微邊緣共址的需求上升。
- 市場限制因素
- 電網波動性和發電量減少的風險
- 降低地下水位和停止使用冷卻水的措施
- 威廉森縣和特拉維斯縣的地價飆升。
- 關鍵設施運作和維護(O&M)方面專業人員短缺
- 價值供應鏈分析
- 監理情勢
- 技術展望
- 投資和產能管道分析
- 波特五力分析
- 市場宏觀經濟趨勢的評估
第5章 市場規模及成長預測(兆瓦)
- 按資料中心規模
- 小規模
- 中號
- 大規模
- 超大規模
- 超大型
- 層級類型
- 一級和二級
- 三級
- 第四級
- 依資料中心類型
- 雲端服務供應商(CSP)
- 企業級、模組化、邊緣運算
- 搭配
- 用過的
- 託管類型
- 零售
- 批發的
- 超大規模
- 最終用戶
- 雲端IT
- 溝通
- 媒體與娛樂
- 政府
- BFSI
- 製造業
- 電子商務
- 其他
- 託管類型
- 用過的
第6章 競爭情勢
- 市場集中度
- 策略趨勢
- 市佔率分析
- 公司簡介
- Digital Realty Trust Inc.
- CyrusOne LLC
- DataBank Ltd.
- Switch Inc.
- Sabey Data Center Properties LLC
- QTS Realty Trust Inc.
- Equinix Inc.
- Aligned Data Centers
- EdgeConneX Inc.
- NTT Global Data Centers Americas Inc.
- Compass Datacenters LLC
- Stream Data Centers LP
- Flexential Corp.
- TierPoint LLC
- CoreSite Realty Corp.
- Iron Mountain Data Centers
- Google LLC(Self-build)
- Amazon Web Services Inc.(Self-build)
- Microsoft Corp.(Self-build)
- Meta Platforms Inc.(Self-build)
第7章 市場機會與未來展望
According to Mordor Intelligence, the austin data center market size was valued at 1.54 gigawatts in 2025 and estimated to grow from 1.63 gigawatts in 2026 to reach 2.19 gigawatts by 2031, at a CAGR of 6.05% during the forecast period (2026-2031).
This report is Segmented by Data Center Size (Small, Medium, Large, Massive, Mega), Tier Type (Tier 1&2, Tier 3, Tier 4), Data Center Type(Colocation, Cloud Service Providers (CSPs), Enterprise, Modular, and Edge). The Market Forecasts are Provided in Terms of Value (USD).
Austin Data Center Market Trends and Insights
Hyperscaler migration from Dallas and Houston corridors
Central Texas land prices remain below Dallas-Fort Worth averages, while ERCOT queue data shows greater available interconnection capacity near Austin. Alphabet and Microsoft already committed to multi-site expansion programs that prioritize contiguous parcels capable of supporting 100 megawatt increment builds. The proximity advantage reduces latency to the state's largest enterprise clusters and allows operators to blend West Texas wind with solar power generated closer to load. As grid congestion worsens north of Waco, developers are shifting pipelines southward, leading to a surge in campus announcements around Hutto, Taylor, and Georgetown. New subsea cable landing partnerships through the Gulf Coast further shorten round-trip latency to Latin America, adding to Austin's appeal for hyperscalers seeking multi-region disaster recovery.
Enterprise cloud off-load from "Silicon Hills" semiconductor expansion
Samsung's ongoing USD 45 billion commitment to the Taylor fabrication complex has introduced unprecedented edge-analytics requirements. Process nodes at 2 nanometers generate telemetry in terabytes per hour, demanding real-time compute for yield analysis. AMD's investment in local AI accelerator RandD intensifies that need, while the broader semiconductor supply chain-from photoresist suppliers to backend test vendors-requires proximity-based data ingestion. The Austin data center market is therefore becoming a parallel infrastructure backbone for the region's chip ecosystem, providing low-latency links between design centers, fabs, and cloud AI clusters. Over the forecast period, each additional fabrication phase could translate into 30-50 megawatts of incremental compute demand, reinforcing a virtuous cycle between manufacturing scale-up and data center growth.
Power-grid volatility and curtailment risk
ERCOT forecasts indicate peak load could hit 218 gigawatts by 2031, with data centers accounting for nearly 40% of incremental demand. Local congestion at the 138 kV layer around Pflugerville and Manor forces occasional load-shed directives when wind output in the West Zone collapses. Some operators now add behind-the-meter gas turbines sized at 30-50 megawatts to assure N+1 supply, but regulators remain wary of the emissions trade-off. In May 2025, the Texas Legislature granted the Public Utility Commission expanded authority to scrutinize new large-load interconnection requests, potentially lengthening approval cycles. Until ERCOT finalizes its market-design reform aimed at firming reserve margins, curtailment risk will weigh on near-term build schedules, tempering the Austin data center market growth trajectory.
Other drivers and restraints analyzed in the detailed report include:
- Texas sales- and property-tax abatements for mission-critical facilities
- Cheap renewable PPAs via ERCOT congestion-zone reforms
- Shrinking water table and cooling-water moratoriums
For complete list of drivers and restraints, kindly check the Table Of Contents.
Segment Analysis
Mega facilities are on track to capture USD 8.65 billion cumulative capital deployment between 2026 and 2031, representing the fastest-growing slice of the Austin data center market. Massive sites still retained a 43.12% share of installed megawatts in 2025, yet their decade-old shell designs struggle to host AI racks exceeding 80 kilowatts. Aligned Data Centers' 2-story slab-on-grade buildings with DeltaFlow liquid cooling achieve rack densities above 140 kilowatts, a configuration favored for generative-AI clusters. Mega campuses typically span 250-500 acres, providing space for on-site 400 kV substations that ensure multi-gigawatt scalability. Growth also benefits from ERCOT's simplified interconnection studies for single-owner master-planned developments, trimming lead time by eight months compared with piecemeal expansion. As a result, mega-scale deployments command the highest development pipeline share, underpinning an expected 9.05% CAGR that outpaces the overall Austin data center market. Smaller facilities continue to serve edge and latency-critical workloads, but they now adopt modular liquids cooling pods to stay competitive against high-density mega campuses.
Long-term, mega campuses should anchor at least 55% of the Austin data center market size once the current tranche of 1.1 gigawatts under construction fully energizes by 2028. Campus operators secure 15-year renewable PPAs at volume discounts, enabling total energy cost per kWh that is 12% below averages paid by medium facilities. This cost spread encourages AI tenants to commit to 30-year ground leases, reducing churn risk for developers. Meanwhile, federal incentives under the CHIPS Act strengthen the link between semiconductor plant expansions and co-located compute estates. The resulting ecosystem positions mega campuses as the backbone infrastructure for South-Central United States AI proliferation.
Complete Report Scope:
- By Data Center Size
- Small
- Medium
- Large
- Massive
- Mega
- By Tier Type
- Tier 1 and 2
- Tier 3
- Tier 4
- By Data Center Type
- Cloud Service Providers (CSPs)
- Enterprise, Modular and Edge
- Colocation
- Utilized
- Colocation Type
- Retail
- Wholesale
- Hyperscale
- End User
- Cloud and IT
- Telecom
- Media and Entertainment
- Government
- BFSI
- Manufacturing
- E-Commerce
- Other End User
- Colocation Type
- Utilized
List of Companies Covered in this Report:
- Digital Realty Trust Inc.
- CyrusOne LLC
- DataBank Ltd.
- Switch Inc.
- Sabey Data Center Properties LLC
- QTS Realty Trust Inc.
- Equinix Inc.
- Aligned Data Centers
- EdgeConneX Inc.
- NTT Global Data Centers Americas Inc.
- Compass Datacenters LLC
- Stream Data Centers LP
- Flexential Corp.
- TierPoint LLC
- CoreSite Realty Corp.
- Iron Mountain Data Centers
- Google LLC (Self-build)
- Amazon Web Services Inc. (Self-build)
- Microsoft Corp. (Self-build)
- Meta Platforms Inc. (Self-build)
Additional Benefits:
- The market estimate (ME) sheet in Excel format
- 3 months of analyst support
TABLE OF CONTENTS
1 INTRODUCTION
- 1.1 Study Assumptions and Market Definition
- 1.2 Scope of the Study
2 RESEARCH METHODOLOGY
3 EXECUTIVE SUMMARY
4 MARKET LANDSCAPE
- 4.1 Market Overview
- 4.2 Market Drivers
- 4.2.1 Hyperscaler migration from Dallas and Houston corridors
- 4.2.2 Enterprise cloud off-load from "Silicon Hills" semiconductor expansion
- 4.2.3 Texas sales- and property-tax abatements for mission-critical facilities
- 4.2.4 Cheap renewable PPAs via ERCOT's congestion-zone reforms
- 4.2.5 Increasing edge-compute demand from autonomous-vehicle testing cluster
- 4.2.6 Rapid 5G densification raising micro-edge colocation needs
- 4.3 Market Restraints
- 4.3.1 Power-grid volatility and curtailment risk
- 4.3.2 Shrinking water table and cooling-water moratoriums
- 4.3.3 Escalating Williamson- and Travis-County land valuations
- 4.3.4 Specialized workforce shortage in critical-facility OandM
- 4.4 Value / Supply-Chain Analysis
- 4.5 Regulatory Landscape
- 4.6 Technological Outlook
- 4.7 Investment and Capacity Pipeline Analysis
- 4.8 Porter's Five Forces Analysis
- 4.8.1 Threat of New Entrants
- 4.8.2 Bargaining Power of Suppliers
- 4.8.3 Bargaining Power of Buyers
- 4.8.4 Threat of Substitutes
- 4.8.5 Competitive Rivalry
- 4.9 Assessment of Macro Economic Trends on the Market
5 MARKET SIZE AND GROWTH FORECASTS (MW)
- 5.1 By Data Center Size
- 5.1.1 Small
- 5.1.2 Medium
- 5.1.3 Large
- 5.1.4 Massive
- 5.1.5 Mega
- 5.2 By Tier Type
- 5.2.1 Tier 1 and 2
- 5.2.2 Tier 3
- 5.2.3 Tier 4
- 5.3 By Data Center Type
- 5.3.1 Cloud Service Providers (CSPs)
- 5.3.2 Enterprise, Modular and Edge
- 5.3.3 Colocation
- 5.3.3.1 Utilized
- 5.3.3.1.1 Colocation Type
- 5.3.3.1.1.1 Retail
- 5.3.3.1.1.2 Wholesale
- 5.3.3.1.1.3 Hyperscale
- 5.3.3.1.2 End User
- 5.3.3.1.2.1 Cloud and IT
- 5.3.3.1.2.2 Telecom
- 5.3.3.1.2.3 Media and Entertainment
- 5.3.3.1.2.4 Government
- 5.3.3.1.2.5 BFSI
- 5.3.3.1.2.6 Manufacturing
- 5.3.3.1.2.7 E-Commerce
- 5.3.3.1.2.8 Other End User
- 5.3.3.1.1 Colocation Type
- 5.3.3.1 Utilized
6 COMPETITIVE LANDSCAPE
- 6.1 Market Concentration
- 6.2 Strategic Moves
- 6.3 Market Share Analysis
- 6.4 Company Profiles (includes Global level Overview, Market level Overview, Core Segments, Financials as available, Strategic Information, Market Rank/Share, Products and Services, Recent Developments)
- 6.4.1 Digital Realty Trust Inc.
- 6.4.2 CyrusOne LLC
- 6.4.3 DataBank Ltd.
- 6.4.4 Switch Inc.
- 6.4.5 Sabey Data Center Properties LLC
- 6.4.6 QTS Realty Trust Inc.
- 6.4.7 Equinix Inc.
- 6.4.8 Aligned Data Centers
- 6.4.9 EdgeConneX Inc.
- 6.4.10 NTT Global Data Centers Americas Inc.
- 6.4.11 Compass Datacenters LLC
- 6.4.12 Stream Data Centers LP
- 6.4.13 Flexential Corp.
- 6.4.14 TierPoint LLC
- 6.4.15 CoreSite Realty Corp.
- 6.4.16 Iron Mountain Data Centers
- 6.4.17 Google LLC (Self-build)
- 6.4.18 Amazon Web Services Inc. (Self-build)
- 6.4.19 Microsoft Corp. (Self-build)
- 6.4.20 Meta Platforms Inc. (Self-build)
7 MARKET OPPORTUNITIES AND FUTURE OUTLOOK
- 7.1 White-space and Unmet-need Assessment

 亞特蘭大資料中心:市場佔有率分析、產業趨勢與統計及成長預測(2026-2031 年)倫敦資料中心:市場佔有率分析、產業趨勢與統計及成長預測(2026-2031 年)北加州資料中心:市佔率分析、產業趨勢與統計及成長預測(2026-2031 年)北維吉尼亞資料中心:市場佔有率分析、產業趨勢與統計及成長預測(2026-2031 年)奧斯陸資料中心:市場佔有率分析、產業趨勢與統計資料、成長預測(2026-2031 年)新澤西州資料中心:市場佔有率分析、行業趨勢和統計數據以及成長預測(2026-2031 年)清奈資料中心:市場佔有率分析、產業趨勢與統計及成長預測(2026-2032)紐約資料中心:市場佔有率分析、產業趨勢與統計及成長預測(2025-2031 年)芝加哥資料中心:市場佔有率分析、產業趨勢與統計及成長預測(2026-2031 年)達拉斯資料中心:市場佔有率分析、產業趨勢與統計及成長預測(2026-2031 年)