


 |
市場調查報告書
商品編碼
2119632
達拉斯資料中心:市場佔有率分析、產業趨勢與統計及成長預測(2026-2031 年)Dallas Data Center - Market Share Analysis, Industry Trends & Statistics, Growth Forecasts (2026 - 2031) |
||||||

※ 本網頁內容可能與最新版本有所差異。詳細情況請與我們聯繫。
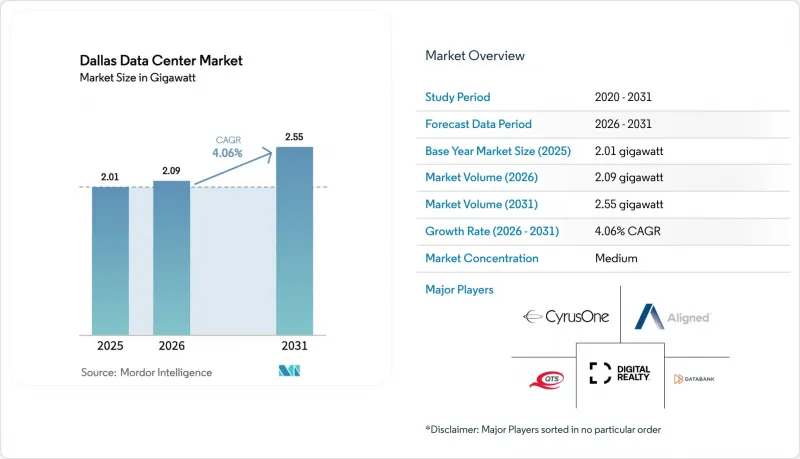
根據 Mordor Intelligence 預測,達拉斯資料中心市場規模預計在 2025 年達到 2.01 GW,從 2026 年的 2.09 GW 成長到 2031 年的 2.55 GW。
預測期(2026-2031 年)的複合年成長率預計為 4.06%。
本報告按資料中心規模(小規模、中型、大型、超大型、巨型)、層級(Tier 1 & 2、Tier 3、Tier 4)和資料中心類型(託管、雲端服務供應商(CSP)、企業級、模組化、邊緣運算)進行分類。市場預測以美元計價。
達拉斯資料中心市場趨勢與洞察
超大規模資料中心業者從達拉斯和休士頓走廊遷出
為了降低美國骨幹網路的延遲,並利用達拉斯比休士頓更豐富的營運商資源,超大規模營運商目前正集中部署在達拉斯資料中心市場。谷歌正在其位於洛杉磯中部紅橡樹園區的200多萬平方英尺的設施中建造新設施,而微軟則在歐文市建造一個包含四個設施的綜合體。冬季風暴「烏裡」過後,這種整合趨勢加速,營運商優先考慮電力資源多元化且輸電互聯更強大的地區。隨後,達拉斯市中心郊區變電站周圍的電網擴建表明,為了保護工作負載免受電力供應限制的影響,營運商正在轉向現場發電和儲能模式。
因半導體工廠擴張而卸載企業雲端服務
德州儀器投資300億美元的謝爾曼半導體製造廠引領德克薩斯州中部半導體計畫的浪潮,這些計畫需要超低延遲的雲端服務來進行流程控制。半導體製造商現在紛紛在其生產線50英里範圍內租用專用託管機房,新的資料中心集群正在達拉斯和德克薩斯州之間的I-35走廊沿線形成。隨著人工智慧驅動的製造進一步增加資料量,到2030年,確保容量並專注於接近性將成為一項戰略要求。能夠將靈活的電源供應與可實現低於5毫秒延遲的線路相結合的營運商,正開始獲得長期企業合約。
電網波動性和發電量減少的風險
到2030年,ERCOT的尖峰需求可能成長78%,這主要歸因於達拉斯資料中心市場的成長。這將提高備用容量需求,迫使營運商實施成本高昂的需求面管理措施和現場發電。據Oncor公司稱,目前有59吉瓦的資料中心負載正在等待併網,而且有跡象表明饋線升級的前置作業時間將會延長(oncor.com)。超大規模資料中心業者正在透過部署專用燃氣渦輪機、燃料電池和電池陣列來應對這一挑戰,以確保其人工智慧訓練叢集即使在ERCOT發出節能請求時也運作,但小規模的運營商則面臨著資金方面的障礙,這可能會延緩新建設項目的進度。
細分市場分析
規模在 250 至 1000 兆瓦之間的巨型資料中心預計將以 7.35% 的複合年成長率 (CAGR) 推動達拉斯大型資料中心市場成長,這主要得益於 Crusoe、DataBank 和超大規模雲端公司的投資承諾。這一細分市場的崛起具有經濟邏輯:GPU叢集以千兆瓦級規模聚合時,能夠實現更高的電力利用效率和更簡化的網路拓撲。巨型資料中心開發商通常會選擇靠近雙層 345 千伏輸電線路的超過 500 英畝的廣闊地塊,並透過在施工開始前數月分階段升級變電站來縮短供電時間。大規模可再生能源購電協議 (PPA) 可以對沖 ERCOT 即時電價飆升的風險,從而為巨型資料中心營運商帶來成本優勢,並吸引高密度人工智慧租戶。
大型資料中心(100-250兆瓦)仍將是達拉斯資料中心市場最大的組成部分,到2025年將佔據42.90%的市場佔有率,並繼續發揮其作為雲端存取樞紐和金融服務叢集的核心作用。這些多租戶機房解決了大規模資本投資的不合理問題,同時也能滿足那些無法容忍邊緣節點延遲的工作負載。同時,中小型的閒置頻段部署可作為災害復原的地理冗餘,但隨著企業將運算密集型任務遷移到超大規模核心區域,其需求正在停滯不前。整合壓力可能會加速房地產投資信託基金(REITs)對老舊、小規模的資料中心的收購,這些REITs希望在光纖走廊附近獲得互補容量。
其他好處:
- Excel格式的市場預測(ME)表
- 3個月的分析師支持
目錄
第1章:引言
- 研究假設和市場定義
- 調查範圍
第2章:調查方法
第3章執行摘要
第4章 市場狀況
- 市場概覽
- 市場促進因素
- 超大規模資料中心業者從達拉斯和休士頓地區遷址
- 由於矽山半導體業務擴張,企業正在遷移到企業雲端。
- 德克薩斯州對關鍵任務設施的銷售稅和財產稅豁免
- ERCOT 對壅塞區域的改革促成了成本更低的可再生能源購電協議 (PPA)。
- 自動駕駛汽車測試叢集推動了對邊緣運算的需求成長
- 5G 密度的快速成長正在推動對微邊緣共址的需求上升。
- 市場限制因素
- 電網波動性和發電限制風險
- 降低地下水位和停止使用冷卻水的措施
- 威廉森縣和特拉維斯縣地價飆升
- 關鍵設施運作和維護(O&M)方面專業人員短缺
- 價值供應鏈分析
- 監理情勢
- 技術展望
- 投資和產能管道分析
- 波特五力分析
- 市場宏觀經濟趨勢的評估
第5章 市場規模及成長預測(兆瓦)
- 按資料中心規模
- 小規模
- 中號
- 大規模
- 超大規模
- 超大型
- 層級類型
- 一級和二級
- 三級
- 第四級
- 依資料中心類型
- 雲端服務供應商(CSP)
- 企業級、模組化、邊緣運算
- 搭配
- 用過的
- 託管類型
- 零售
- 批發的
- 超大規模
- 最終用戶
- 雲端IT
- 溝通
- 媒體與娛樂
- 政府
- BFSI
- 製造業
- 電子商務
- 其他
- 託管類型
- 用過的
第6章 競爭情勢
- 市場集中度
- 策略趨勢
- 市佔率分析
- 公司簡介
- Digital Realty Trust Inc.
- CyrusOne LLC
- DataBank Ltd.
- Switch Inc.
- Sabey Data Center Properties LLC
- QTS Realty Trust Inc.
- Equinix Inc.
- Aligned Data Centers
- EdgeConneX Inc.
- NTT Global Data Centers Americas Inc.
- Compass Datacenters LLC
- Stream Data Centers LP
- Flexential Corp.
- TierPoint LLC
- CoreSite Realty Corp.
- Iron Mountain Data Centers
- Google LLC(Self-build)
- Amazon Web Services Inc.(Self-build)
- Microsoft Corp.(Self-build)
- Meta Platforms Inc.(Self-build)
第7章 市場機會與未來展望
According to Mordor Intelligence, the dallas data center market size was valued at 2.01 GW in 2025 and estimated to grow from 2.09 GW in 2026 to reach 2.55 GW by 2031, at a CAGR of 4.06% during the forecast period (2026-2031).
This report is Segmented by Data Center Size (Small, Medium, Large, Massive, Mega), Tier Type (Tier 1&2, Tier 3, Tier 4), Data Center Type(Colocation, Cloud Service Providers (CSPs), Enterprise, Modular, and Edge). The Market Forecasts are Provided in Terms of Value (USD).
Dallas Data Center Market Trends and Insights
Hyperscaler migration from Dallas & Houston corridors
Hyperscale operators now concentrate deployment in the Dallas data center market to reduce latency across national backbones to leverage richer carrier diversity than Houston offers. Google has assembled more than 2 million ft2 across Midlothian Red Oak campuses, while Microsoft is progressing with a four-facility Irving complex. This consolidation accelerated after Winter Storm Uri, prompting operators to favor regions with multi-fuel power portfolios stronger transmission interconnections. Subsequent l-banking around substations outside central Dallas indicates a move toward self-generation onsite energy-storage models that insulate workloads from curtailment events.
Enterprise cloud off-load from semiconductor build-out
Texas Instruments' USD 30 billion Sherman fabrication plant has catalyzed a wave of semiconductor projects in Central Texas, those factories require ultra-low-latency cloud services for process controls. Fabricators now contract for dedicated colocation halls within 50 miles of production lines, anchoring new dem along the I-35 corridor between Dallas. AI-enabled manufacturing further multiplies data volumes, making proximity-based capacity a strategic necessity through 2030. Operators that can pair flexible power with sub-5-millisecond latency corridors st to capture long-duration enterprise contracts.
Power-grid volatility and curtailment risk
Peak ERCOT dem could rise 78% by 2030, much of it from the Dallas data center market, raising reserve-margin requirements forcing operators into expensive dem response or onsite generation. Oncor reports 59 GW of data-center load in interconnection queues, foreshadowing longer lead times for feeder upgrades oncor.com. Hyperscalers answer with dedicated gas turbines, fuel cells, battery arrays that keep AI training clusters online when ERCOT issues conservation notices, but smaller providers face capital hurdles that may slow new-build schedules.
Other drivers and restraints analyzed in the detailed report include:
- Texas sales- property-tax abatements
- Cheap renewable PPAs via ERCOT reforms
- Shrinking water table and cooling-water moratoriums
For complete list of drivers and restraints, kindly check the Table Of Contents.
Segment Analysis
Mega campuses typified by 250-1,000 MW footprints are on pace to lift the Dallas data center market size for large-format builds at a 7.35% CAGR, supported by pledges from Crusoe, DataBank, hyperscale clouds. The segment's rise follows economic logic: GPU clusters achieve superior power-utilization efficiency simpler network topologies when aggregated at gigawatt scale. Mega-site developers routinely secure l tracts exceeding 500 acres near dual 345-kV transmission loops, then layer in substation upgrades months before ground-breaking to compress energization timelines. Extensive renewable PPAs hedge exposure to ERCOT real-time pricing spikes, giving Mega operators an opex edge that attracts high-density AI tenants.
Massive facilities (100-250 MW) remain the Dallas data center market's largest cohort with a 42.90% share in 2025 continue to anchor cloud-on-ramp hubs financial-services clusters. Their multi-tenant halls accommodate workloads that cannot tolerate the latency introduced by edge nodes yet do not justify mega-scale capex. Small medium white-space deployments, meanwhile, supply disaster-recovery geo-redundancy roles but face flat dem as enterprises migrate high-compute tasks into hyperscale core regions. Consolidation pressures will likely accelerate acquisitions of older small facilities by REITs seeking bolt-on capacity near fiber corridors.
Complete Report Scope:
- By Data Center Size
- Small
- Medium
- Large
- Massive
- Mega
- By Tier Type
- Tier 1 and 2
- Tier 3
- Tier 4
- By Data Center Type
- Cloud Service Providers (CSPs)
- Enterprise, Modular and Edge
- Colocation
- Utilized
- Colocation Type
- Retail
- Wholesale
- Hyperscale
- End User
- Cloud and IT
- Telecom
- Media and Entertainment
- Government
- BFSI
- Manufacturing
- E-Commerce
- Other End User
- Colocation Type
- Utilized
List of Companies Covered in this Report:
- Digital Realty Trust Inc.
- CyrusOne LLC
- DataBank Ltd.
- Switch Inc.
- Sabey Data Center Properties LLC
- QTS Realty Trust Inc.
- Equinix Inc.
- Aligned Data Centers
- EdgeConneX Inc.
- NTT Global Data Centers Americas Inc.
- Compass Datacenters LLC
- Stream Data Centers LP
- Flexential Corp.
- TierPoint LLC
- CoreSite Realty Corp.
- Iron Mountain Data Centers
- Google LLC (Self-build)
- Amazon Web Services Inc. (Self-build)
- Microsoft Corp. (Self-build)
- Meta Platforms Inc. (Self-build)
Additional Benefits:
- The market estimate (ME) sheet in Excel format
- 3 months of analyst support
TABLE OF CONTENTS
1 INTRODUCTION
- 1.1 Study Assumptions & Market Definition
- 1.2 Scope of the Study
2 RESEARCH METHODOLOGY
3 EXECUTIVE SUMMARY
4 MARKET LANDSCAPE
- 4.1 Market Overview
- 4.2 Market Drivers
- 4.2.1 Hyperscaler migration from Dallas & Houston corridors
- 4.2.2 Enterprise cloud off-load from "Silicon Hills" semiconductor expansion
- 4.2.3 Texas sales- and property-tax abatements for mission-critical facilities
- 4.2.4 Cheap renewable PPAs via ERCOT's congestion-zone reforms
- 4.2.5 Increasing edge-compute demand from autonomous-vehicle testing cluster
- 4.2.6 Rapid 5G densification raising micro-edge colocation needs
- 4.3 Market Restraints
- 4.3.1 Power-grid volatility & curtailment risk
- 4.3.2 Shrinking water table & cooling-water moratoriums
- 4.3.3 Escalating Williamson- & Travis-County land valuations
- 4.3.4 Specialized workforce shortage in critical-facility O&M
- 4.4 Value / Supply-Chain Analysis
- 4.5 Regulatory Landscape
- 4.6 Technological Outlook
- 4.7 Investment & Capacity Pipeline Analysis
- 4.8 Porter's Five Forces Analysis
- 4.8.1 Threat of New Entrants
- 4.8.2 Bargaining Power of Suppliers
- 4.8.3 Bargaining Power of Buyers
- 4.8.4 Threat of Substitutes
- 4.8.5 Competitive Rivalry
- 4.9 Assessment of Macro Economic Trends on the Market
5 MARKET SIZE AND GROWTH FORECASTS (MW)
- 5.1 By Data Center Size
- 5.1.1 Small
- 5.1.2 Medium
- 5.1.3 Large
- 5.1.4 Massive
- 5.1.5 Mega
- 5.2 By Tier Type
- 5.2.1 Tier 1 and 2
- 5.2.2 Tier 3
- 5.2.3 Tier 4
- 5.3 By Data Center Type
- 5.3.1 Cloud Service Providers (CSPs)
- 5.3.2 Enterprise, Modular and Edge
- 5.3.3 Colocation
- 5.3.3.1 Utilized
- 5.3.3.1.1 Colocation Type
- 5.3.3.1.1.1 Retail
- 5.3.3.1.1.2 Wholesale
- 5.3.3.1.1.3 Hyperscale
- 5.3.3.1.2 End User
- 5.3.3.1.2.1 Cloud and IT
- 5.3.3.1.2.2 Telecom
- 5.3.3.1.2.3 Media and Entertainment
- 5.3.3.1.2.4 Government
- 5.3.3.1.2.5 BFSI
- 5.3.3.1.2.6 Manufacturing
- 5.3.3.1.2.7 E-Commerce
- 5.3.3.1.2.8 Other End User
- 5.3.3.1.1 Colocation Type
- 5.3.3.1 Utilized
6 COMPETITIVE LANDSCAPE
- 6.1 Market Concentration
- 6.2 Strategic Moves
- 6.3 Market Share Analysis
- 6.4 Company Profiles (includes Global level Overview, Market level Overview, Core Segments, Financials as available, Strategic Information, Market Rank/Share, Products & Services, Recent Developments)
- 6.4.1 Digital Realty Trust Inc.
- 6.4.2 CyrusOne LLC
- 6.4.3 DataBank Ltd.
- 6.4.4 Switch Inc.
- 6.4.5 Sabey Data Center Properties LLC
- 6.4.6 QTS Realty Trust Inc.
- 6.4.7 Equinix Inc.
- 6.4.8 Aligned Data Centers
- 6.4.9 EdgeConneX Inc.
- 6.4.10 NTT Global Data Centers Americas Inc.
- 6.4.11 Compass Datacenters LLC
- 6.4.12 Stream Data Centers LP
- 6.4.13 Flexential Corp.
- 6.4.14 TierPoint LLC
- 6.4.15 CoreSite Realty Corp.
- 6.4.16 Iron Mountain Data Centers
- 6.4.17 Google LLC (Self-build)
- 6.4.18 Amazon Web Services Inc. (Self-build)
- 6.4.19 Microsoft Corp. (Self-build)
- 6.4.20 Meta Platforms Inc. (Self-build)
7 MARKET OPPORTUNITIES AND FUTURE OUTLOOK
- 7.1 White-space & Unmet-need Assessment

 亞特蘭大資料中心:市場佔有率分析、產業趨勢與統計及成長預測(2026-2031 年)倫敦資料中心:市場佔有率分析、產業趨勢與統計及成長預測(2026-2031 年)北加州資料中心:市佔率分析、產業趨勢與統計及成長預測(2026-2031 年)北維吉尼亞資料中心:市場佔有率分析、產業趨勢與統計及成長預測(2026-2031 年)奧斯汀資料中心:市場佔有率分析、產業趨勢與統計及成長預測(2026-2031 年)奧斯陸資料中心:市場佔有率分析、產業趨勢與統計資料、成長預測(2026-2031 年)新澤西州資料中心:市場佔有率分析、行業趨勢和統計數據以及成長預測(2026-2031 年)清奈資料中心:市場佔有率分析、產業趨勢與統計及成長預測(2026-2032)紐約資料中心:市場佔有率分析、產業趨勢與統計及成長預測(2025-2031 年)芝加哥資料中心:市場佔有率分析、產業趨勢與統計及成長預測(2026-2031 年)