

 |
市場調查報告書
商品編碼
2119596
北維吉尼亞資料中心:市場佔有率分析、產業趨勢與統計及成長預測(2026-2031 年)Northern Virginia Data Center - Market Share Analysis, Industry Trends & Statistics, Growth Forecasts (2026 - 2031) |
||||||

※ 本網頁內容可能與最新版本有所差異。詳細情況請與我們聯繫。
據 Mordor Intelligence 稱,預計到 2026 年,維吉尼亞北部的資料中心市場規模將達到 20.32 GW,高於 2025 年的 16.05 GW。
此外,預計到 2031 年的裝置容量將達到 43.52 吉瓦,這意味著從 2026 年到 2031 年的複合年成長率為 3.38%。
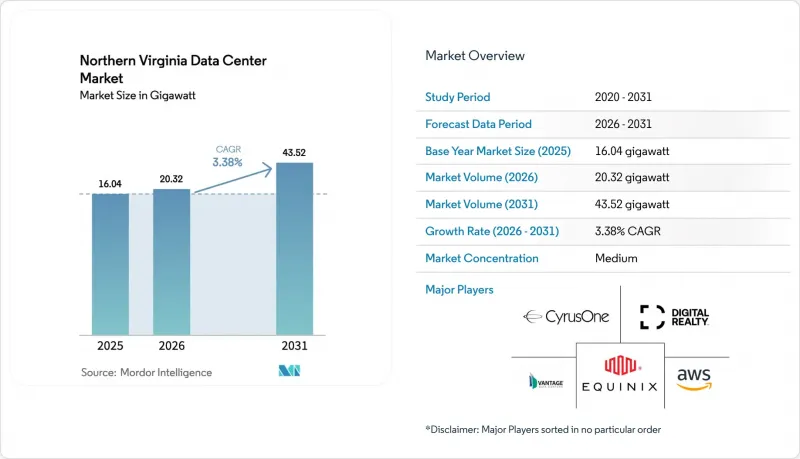
本報告按規模(小規模、中型、大型、超大型、巨型)、層級(Tier 1 & 2、Tier 3、Tier 4)和資料中心類型(託管、雲端服務供應商(CSP)、企業級、模組化、邊緣)對資料中心進行分類。市場預測以美元計價。
北維吉尼亞資料中心市場的趨勢與洞察
超大規模雲的快速擴張
到2024年,亞馬遜網路服務(AWS)將在維吉尼亞北部營運超過50個資料中心,微軟也在馬納薩斯開發總合約400萬平方英尺的專案。這清楚地表明了超超大規模資料中心業者傾向於集中資源的規模。雖然這種集中化有利於低延遲互聯和規模經濟,但也增加了Dominion Energy對區域電網的依賴。傳統的託管服務提供者正在重新設計園區。光是Digital Realty的阿什本平台目前就可容納632兆瓦的IT負載容量。加強園區區間佈線和安裝專用變電站已成為專案的標準配置,以100兆瓦為單位的電力預留也不再罕見。然而,Dominion決定在2024年暫停新的併網申請,凸顯了電網擁塞即使是對資金最雄厚的公司也會造成影響。
史上最高的纖維密度與互連性
由於 MAE-East 的歷史傳承,阿什本位於 337 個活躍對等互聯點的核心位置,這些互聯點覆蓋 16 個 Equinix 站點,在全球任何大都會圈都實現了無與倫比的低延遲。這種高密度網路迫使那些需要低於 1 毫秒往返延遲的雲端服務和人工智慧供應商落腳於同一光纖服務區域內,進一步推高了土地價格。例如,Active Infrastructure 公司在利斯堡佔地 362 英畝的園區提案,將用戶側可再生能源與本地光纖環路相結合,展現了一種應對電網風險和連接價值的綜合方法。暗纖環路、連網機房和海底回程傳輸的結合,進一步鞏固了該地區作為全球骨幹網路重要組成部分的地位。
Dominion Energy的電網限制
Dominion能源公司2024年綜合資源計畫預測,未來15年電力負載將成長85%,僅維持供電能力就需要3.4吉瓦離岸風電、12吉瓦太陽能發電和4.5吉瓦儲能。由於電力供應暫時中斷至2026年1月,導致市場兩極化:已獲得電力供應保障的項目以溢價交易,而新的開發項目則需排隊等候。 PJM互聯公司已收到92份電網升級競標,總金額可能高達510億美元,凸顯了補救措施的規模。開發商擴大呼籲實施現場燃氣渦輪機、電池儲能或可再生能源購電協議(PPA),並捆綁專用饋線,以緩解併網的不確定性。然而,這些變通方案不僅增加了建設的複雜性,而且在授權核准過程中可能面臨更嚴格的審查。
細分市場分析
到2025年,超大規模資料中心將佔北維吉尼亞資料中心市場佔有率的53.20%,預計到2031年將以3.85%的複合年成長率成長。 「蓋恩斯維爾的格羅夫」資料中心佔地四分之一英里,需要為15萬戶家庭供電,這清楚地展現了營運商透過擴大暖通空調、發電機和保全行動所能實現的經濟效益。雖然大中型資料中心仍然吸引那些重視地理分散性的公司租賃,但千兆瓦級園區帶來的資本集中正在推動投資向規模曲線的高階發展。
超大規模設計正推動建築結構朝多層鋼骨方向發展,雖然最佳化了有限的土地空間,但也增加了機械結構的複雜性。 STACK Infrastructure 的斯塔福德科技園區(Stafford Technology Campus)就是一個鮮明的例子,該園區佔地 500 英畝,擁有 19 棟水冷式建築和 300 兆瓦的電池備用容量,總裝置容量達 1 吉瓦。考慮到其預計容量,到 2030 年,光是該園區就將佔據北維吉尼亞資料中心市場 7% 的佔有率。儘管來自當地社區日益嚴格的審查可能會減緩這一進程,但將容量集中在光纖交叉口附近的經濟合理性確保了大型設施將繼續成為基礎設施的主流形式。
其他好處:
- Excel格式的市場預測(ME)表
- 3個月的分析師支持
目錄
第1章:引言
- 研究假設和市場定義
- 調查範圍
第2章:調查方法
第3章執行摘要
第4章 市場狀況
- 市場概覽
- 市場促進因素
- 超大規模雲的快速擴張
- 創紀錄的最高光纖密度和互連性
- 稅收優惠以及銷售稅和使用稅的豁免
- AI/ML 和 GPU叢集的激增
- 企業對全天候運作的需求(邊緣運算和低延遲)
- 向永續/可再生能源購電協議(PPA)過渡
- 市場限制因素
- Dominion Energy的電網限制
- 勞登縣/威廉王子縣暫停土地使用和分區規劃
- 建築成本和電力設備成本不斷上漲
- 先進冷卻技術的用水限制
- 價值供應鏈分析
- 監理情勢
- 技術展望
- 波特五力分析
- 市場宏觀經濟趨勢的評估
第5章 市場規模及成長預測(兆瓦)
- 按資料中心規模
- 小規模
- 中等的
- 大規模
- 超大規模
- 層級類型
- 一級和二級
- 三級
- 第四級
- 依資料中心類型
- 雲端服務供應商(CSP)
- 企業級、模組化、邊緣運算
- 搭配
- 未使用的
- 用過的
- 搭配類型
- 零售
- 批發的
- 最終用戶
- 雲端運算和資訊技術
- 溝通
- 媒體與娛樂
- 政府
- BFSI
- 製造業
- 電子商務
- 其他最終用戶
- 搭配類型
第6章 競爭情勢
- 市場集中度
- 策略趨勢
- 市佔率分析
- 公司簡介
- Amazon Web Services, Inc.
- Microsoft Corporation
- Digital Realty Trust Inc.
- QTS Realty Trust, LLC
- Meta
- CyrusOne LLC
- STACK INFRASTRUCTURE
- CloudHQ LLC
- Equinix Inc.
- Aligned Data Centers
- Google LLC
- Menlo Equities LLC
- Vantage Data Centers Management Company, LLC
- NTT DATA GROUP Corporation
- Iron Mountain Information Management, LLC
- CoreSite
- Cologix, Inc.
- Yondr Group
- Corscale, LLC
- Csquare(Phoenix Infrastructure LLC)
- PowerHouse Data Centers
- DataBank Holdings Ltd.
第7章 市場機會與未來展望
According to Mordor Intelligence, northern virginia data center market size in 2026 is estimated at 20.32 GW, growing from the 2025 value of 16.05 GW, with 2031 projections showing 43.52 GW, growing at a 3.38% CAGR over 2026-2031.
This report is Segmented by Data Center Size (Small, Medium, Large, Massive, Mega), Tier Type (Tier 1&2, Tier 3, Tier 4), Data Center Type(Colocation, Cloud Service Providers (CSPs), Enterprise, Modular, and Edge). The Market Forecasts are Provided in Terms of Value (USD).
Northern Virginia Data Center Market Trends and Insights
Rapid Hyperscale Cloud Expansion
Amazon Web Services operated more than 50 facilities in Northern Virginia by 2024, and Microsoft has underway projects totaling nearly 4 million ft2 in Manassas, underscoring the scale at which hyperscalers prefer to concentrate capacity. Concentration supports low-latency interconnection and economies of scale but magnifies regional reliance on Dominion Energy's grid. Traditional colocation providers are redesigning campuses; Digital Realty's Ashburn platform alone now supports 632 MW of IT load capacity. Heightened inter-campus cabling and dedicated substations have become routine project features, and power reservations for 100 MW blocks are no longer exceptional. However, Dominion's 2024 moratorium on new connections spotlighted how transmission congestion can slow even the deepest corporate wallets.
Record-High Fiber Density and Interconnection
The MAE-East legacy places Ashburn at the center of 337 active peering points across 16 Equinix sites, creating latency metrics few global metros can match.This dense network forces any cloud or AI provider needing sub-millisecond round-trip times to locate inside the same fiber catchment, reinforcing land price escalation. Proposals such as Active Infrastructure's 362-acre Leesburg campus couple behind-the-meter renewables with local fiber loops, illustrating a combined approach to grid risk and connectivity value. The combination of dark fiber loops, meet-me rooms, and subsea cable backhaul continues to elevate the region's indispensability for global backbone traffic.
Dominion Energy Grid Constraints
Dominion's 2024 Integrated Resource Plan projects an 85% rise in load over 15 years, necessitating 3.4 GW offshore wind, 12 GW solar, and 4.5 GW storage just to maintain supply adequacy. Temporary connection pauses through January 2026 created a bifurcated market where power-entitled projects trade at premiums, while greenfield sites wait in the queue. PJM Interconnection fielded 92 bids for transmission upgrades that could reach USD 51 billion, highlighting the scale of remediation. Developers increasingly request on-site gas turbines, battery storage, or renewable PPAs bundled with dedicated feeders to mitigate connection uncertainty. Yet such work-arounds add construction complexity and may face additional permitting scrutiny.
Other drivers and restraints analyzed in the detailed report include:
- Tax Incentives and Sales-and-Use-Tax Exemptions
- Surge in AI/ML and GPU Clusters
- Land-Use and Zoning Moratoria in Loudoun/Prince William
For complete list of drivers and restraints, kindly check the Table Of Contents.
Segment Analysis
Hyperscale facilities held 53.20% of the Northern Virginia data center market share in 2025 and will expand at a 3.85% CAGR through 2031. The Grove at Gainesville stretches a quarter-mile and needs power for 150,000 homes, illustrating the economies operators achieve when scaling HVAC plants, generators, and security operations. Large and medium footprints still secure lease wins from enterprises that value geographic diversity, yet the capital gravity of multi-gigawatt campuses is drawing investment toward the top end of the scale curve.
Hyperscale design also shifts construction toward multi-story steel superstructures that optimize scarce land but elevate mechanical complexity. STACK Infrastructure's 1 GW Stafford Technology Campus underscores this trend, covering 500 acres while accommodating 19 buildings engineered for liquid cooling and 300 MW battery reserves. Given its forecast capacity, the campus alone accounts for 7% of the Northern Virginia data center market in 2030. Rising community scrutiny may temper the pace, but the economic logic of aggregating capacity near fiber crossroads ensures that mega facilities will remain the defining form factor.
Complete Report Scope:
- By Data Center Size
- Small
- Medium
- Large
- Hyperscale
- By Tier Type
- Tier 1 and 2
- Tier 3
- Tier 4
- By Data Center Type
- Cloud Service Providers (CSPs)
- Enterprise, Modular and Edge
- Colocation
- Non-Utilized
- Utilized
- Colocation Type
- Retail
- Wholesale
- End User
- Cloud and IT
- Telecom
- Media and Entertainment
- Government
- BFSI
- Manufacturing
- E-Commerce
- Other End User
- Colocation Type
List of Companies Covered in this Report:
- Amazon Web Services, Inc.
- Microsoft Corporation
- Digital Realty Trust Inc.
- QTS Realty Trust, LLC
- Meta
- CyrusOne LLC
- STACK INFRASTRUCTURE
- CloudHQ LLC
- Equinix Inc.
- Aligned Data Centers
- Google LLC
- Menlo Equities LLC
- Vantage Data Centers Management Company, LLC
- NTT DATA GROUP Corporation
- Iron Mountain Information Management, LLC
- CoreSite
- Cologix, Inc.
- Yondr Group
- Corscale, LLC
- Csquare (Phoenix Infrastructure LLC)
- PowerHouse Data Centers
- DataBank Holdings Ltd.
Additional Benefits:
- The market estimate (ME) sheet in Excel format
- 3 months of analyst support
TABLE OF CONTENTS
1 INTRODUCTION
- 1.1 Study Assumptions and Market Definition
- 1.2 Scope of the Study
2 RESEARCH METHODOLOGY
3 EXECUTIVE SUMMARY
4 MARKET LANDSCAPE
- 4.1 Market Overview
- 4.2 Market Drivers
- 4.2.1 Rapid hyperscale cloud expansion
- 4.2.2 Record-high fiber density and interconnection
- 4.2.3 Tax incentives and sales-and-use-tax exemptions
- 4.2.4 Surge in AI / ML and GPU clusters
- 4.2.5 Corporate demand for 24X7 uptime (edge and latency)
- 4.2.6 Shift to sustainable / renewable power PPAs
- 4.3 Market Restraints
- 4.3.1 Dominion Energy grid constraints
- 4.3.2 Land-use and zoning moratoria in Loudoun/Prince William
- 4.3.3 Escalating construction and power-equipment costs
- 4.3.4 Water-use restrictions for advanced cooling
- 4.4 Value / Supply-Chain Analysis
- 4.5 Regulatory Landscape
- 4.6 Technological Outlook
- 4.7 Porter's Five Forces Analysis
- 4.7.1 Threat of New Entrants
- 4.7.2 Threat of Substitutes
- 4.7.3 Bargaining Power of Suppliers
- 4.7.4 Bargaining Power of Buyers
- 4.7.5 Competitive Rivalry
- 4.8 Assessment of Macro Economic Trends on the Market
5 MARKET SIZE AND GROWTH FORECASTS (MW)
- 5.1 By Data Center Size
- 5.1.1 Small
- 5.1.2 Medium
- 5.1.3 Large
- 5.1.4 Hyperscale
- 5.2 By Tier Type
- 5.2.1 Tier 1 and 2
- 5.2.2 Tier 3
- 5.2.3 Tier 4
- 5.3 By Data Center Type
- 5.3.1 Cloud Service Providers (CSPs)
- 5.3.2 Enterprise, Modular and Edge
- 5.3.3 Colocation
- 5.3.3.1 Non-Utilized
- 5.3.3.2 Utilized
- 5.3.3.2.1 Colocation Type
- 5.3.3.2.1.1 Retail
- 5.3.3.2.1.2 Wholesale
- 5.3.3.2.2 End User
- 5.3.3.2.2.1 Cloud and IT
- 5.3.3.2.2.2 Telecom
- 5.3.3.2.2.3 Media and Entertainment
- 5.3.3.2.2.4 Government
- 5.3.3.2.2.5 BFSI
- 5.3.3.2.2.6 Manufacturing
- 5.3.3.2.2.7 E-Commerce
- 5.3.3.2.2.8 Other End User
- 5.3.3.2.1 Colocation Type
6 COMPETITIVE LANDSCAPE
- 6.1 Market Concentration
- 6.2 Strategic Moves
- 6.3 Market Share Analysis
- 6.4 Company Profiles (includes Global level Overview, Market level overview, Core Segments, Financials as available, Strategic Information, Market Rank/Share for key companies, Products and Services, and Recent Developments)
- 6.4.1 Amazon Web Services, Inc.
- 6.4.2 Microsoft Corporation
- 6.4.3 Digital Realty Trust Inc.
- 6.4.4 QTS Realty Trust, LLC
- 6.4.5 Meta
- 6.4.6 CyrusOne LLC
- 6.4.7 STACK INFRASTRUCTURE
- 6.4.8 CloudHQ LLC
- 6.4.9 Equinix Inc.
- 6.4.10 Aligned Data Centers
- 6.4.11 Google LLC
- 6.4.12 Menlo Equities LLC
- 6.4.13 Vantage Data Centers Management Company, LLC
- 6.4.14 NTT DATA GROUP Corporation
- 6.4.15 Iron Mountain Information Management, LLC
- 6.4.16 CoreSite
- 6.4.17 Cologix, Inc.
- 6.4.18 Yondr Group
- 6.4.19 Corscale, LLC
- 6.4.20 Csquare (Phoenix Infrastructure LLC)
- 6.4.21 PowerHouse Data Centers
- 6.4.22 DataBank Holdings Ltd.
7 MARKET OPPORTUNITIES AND FUTURE OUTLOOK
- 7.1 White-space and Unmet-Need Assessment

 亞特蘭大資料中心:市場佔有率分析、產業趨勢與統計及成長預測(2026-2031 年)雅加達資料中心:市場佔有率分析、產業趨勢與統計資料、成長預測(2026-2032 年)
 資料中心測試市場報告:趨勢、預測與競爭分析(至2035年)
 資料中心市場分析及預測(至2035年):類型、產品、服務、技術、組件、應用、部署、最終用戶、功能、解決方案中東和非洲資料中心房地產:市場佔有率分析、行業趨勢和統計數據以及成長預測(2026-2031 年)南美洲資料中心房地產:市場佔有率分析、產業趨勢與統計及成長預測(2026-2031 年)亞太地區資料中心房地產:市場佔有率分析、產業趨勢與統計及成長預測(2026-2031 年)北美資料中心房地產:市場佔有率分析、產業趨勢與統計及成長預測(2026-2031 年)歐洲資料中心房地產:市場佔有率分析、產業趨勢與統計及成長預測(2026-2031 年)資料中心房地產:市場佔有率分析、產業趨勢與統計、成長預測(2026-2031)