

 |
市場調查報告書
商品編碼
2119592
清奈資料中心:市場佔有率分析、產業趨勢與統計及成長預測(2026-2032)Chennai Data Center - Market Share Analysis, Industry Trends & Statistics, Growth Forecasts (2026 - 2032) |
||||||

※ 本網頁內容可能與最新版本有所差異。詳細情況請與我們聯繫。
根據 Mordor Intelligence 預測,清奈資料中心市場將從 2025 年的 550 兆瓦成長到 2026 年的 670 兆瓦,然後從 2026 年到 2032 年以 21.19% 的複合年成長率成長,到 2032 年達到 2110 兆瓦。
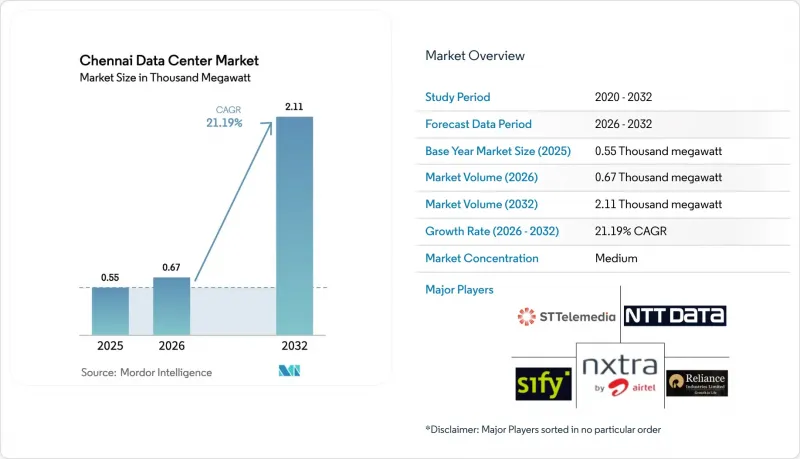
本報告按規模(小規模、中型、大型、超大型、特大型)、等級(Tier 1 & 2、Tier 3 和 Tier 4)和使用率(託管類型、終端用戶行業利用率和未利用率)對資料中心進行分類。市場預測以兆瓦 (MW) 容量為單位。
清奈資料中心市場的趨勢與洞察
海底電纜的登陸擴大了國際頻寬。
隨著包括SEA-ME-WE-6和MIST在內的五個新增系統的投入使用,清奈目前可直接連接總合420 TBPS的頻寬,從而降低了與新加坡和馬賽之間的延遲,並將該市打造成為區域災害復原中心。有線電視營運商正在將登陸站與超大規模園區共址,以建立垂直整合的連接和運算叢集,從而吸引OTT和金融科技工作負載。充足的頻寬也鞏固了清奈在人工智慧訓練資料中心市場中的地位,高容量國際線路正被用於大量資料擷取。自2016年以來,印度的有線電視容量成長了九倍,清奈的出站流量佔有率也持續上升。
泰米爾納德邦可再生能源開放接入走廊
泰米爾納德邦擁有34.7吉瓦的可再生能源資產,涵蓋風能、太陽能和水力發電,為營運商提供了一條經濟高效的途徑,以實現其100%清潔能源目標。資料中心購電協議受惠於優惠的輸電費率和儲能條款,可降低高達12%的營運成本。 STT GDC在清奈園區超過60%的電力來自綠色能源,而Equinix的目標是到2030年實現100%清潔能源。這條可再生能源走廊有助於降低未來碳排放法規帶來的風險,並使永續性成為超大規模資料中心託管競標中的一項競爭優勢。
大金清奈地區缺少超過25英畝的連片土地
隨著城市擴張,IT走廊沿線的優質土地日益稀缺,導致土地購置成本上漲15%至20%,迫使業者建造高層建築或郊區園區。 Yotta公司佔地13英畝的資料中心採用模組化設計,每層可容納2萬個機架;而ESR公司則在奧拉加丹(Oragadam)提供了80英畝土地,以抵消沿海地區飆升的地價。除非出現衛星叢集,否則土地短缺可能會減緩清奈資料中心市場的成長。
細分市場分析
2025年,大型資料中心在清奈資料中心市佔率中佔比45.32%,這得益於均衡的資本投資和近岸連結的優勢。預計到2032年,這一龐大的細分市場將以23.12%的複合年成長率成長,為清奈資料中心市場規模貢獻782.6兆瓦。超大規模企業正在部署液冷人工智慧叢集,租用容量超過10兆瓦的連續機房;而普通企業則在大型園區內租賃小規模的機房,用於滿足合規性要求的工作負載。
位於清奈的龐大園區整合了現場變電站和直接可再生能源,從而減少了電力延遲和碳排放。 AdaniConneX 的旗艦園區將 400 千伏開關站與 18 兆瓦太陽能發電廠結合,可在不降低額定輸出功率的情況下實現 30 千瓦機架運作。 NTT 的清奈2 號設施優先採用模組化電力系統,可根據人工智慧需求的激增進行分階段擴容。
其他好處:
- Excel格式的市場預測(ME)表
- 3個月的分析師支持
目錄
第1章:引言
- 研究假設和市場定義
- 調查範圍
第2章:調查方法
第3章執行摘要
第4章 市場狀況
- 市場概覽
- 市場促進因素
- 海底電纜的登陸正在擴大國際頻寬。
- 泰米爾納德邦可再生能源開放通道
- 銀行、金融服務和保險 (BFSI)、OTT 和 GCC 營運商採用「雲端優先」策略
- 基於泰米爾納德邦發展中心政策的州級激勵措施
- AI/LLM 機架密度超過 30 kW 時,需要對閒置頻段維修。
- 冷鏈物流正在轉型為數據驅動的自動化樞紐。
- 市場限制因素
- 大金清奈地區25英畝或以上連片地塊短缺
- 230千伏併網系統的交付時間超過24個月。
- 季風引發洪水的風險以及東岸走廊沿海地區的海岸帶管理區核准。
- 具備 Uptime-Tier 認證的試運行人員短缺
- 價值供應鏈分析
- 監理情勢
- 技術展望
- 波特五力模型
第5章 市場規模及成長預測(價值和兆瓦)
- 按資料中心規模
- 小規模
- 中號
- 大規模
- 超大型
- 超大規模
- 層級特定
- 一級和二級
- Tier III
- Tier IV
- 按使用狀態
- 用過的
- 搭配類型
- 超大規模
- 零售
- 批發的
- 終端用戶產業
- BFSI
- 雲端服務供應商
- 電子商務
- 政府
- 製造業
- 媒體與娛樂
- 溝通
- 其他最終用戶
- 搭配類型
- 未使用的
- 用過的
第6章 競爭情勢
- 市佔率分析
- 企業狀況
- 公司簡介
- AdaniConneX
- Brookfield Infrastructure
- CapitaLand Data Centres(Ascendas)
- CtrlS Datacenters
- Equinix
- NTT Global Data Centers
- Nxtra by Airtel
- Reliance Data Centers
- Sify Technologies
- ST Telemedia GDC India
- Yotta Infrastructure
- Tata Communications
- List of Companies Studied
第7章 市場機會與未來展望
According to Mordor Intelligence, the chennai data center market size is expected to grow from 0.55 Thousand MW in 2025 to 0.67 Thousand MW in 2026 and is forecast to reach 2.11 Thousand MW by 2032 at 21.19% CAGR over 2026-2032.
This report is Segmented by Data Center Size (Small, Medium, Large, Mega, Massive), Tier Standard (Tier 1 and 2, Tier 3, Tier 4), Absorption (Utilized by Colocation Type and End-User Industry, Non-Utilized). The Market Forecasts are Provided in Terms of MW Capacity.
Chennai Data Center Market Trends and Insights
Sub-sea cable landings multiply international bandwidth
Five additional systems, including SEA-ME-WE-6 and MIST, give Chennai direct access to 420 TBPS aggregate capacity, lowering latency to Singapore and Marseille while positioning the city as a regional disaster-recovery hub. Cable operators co-locate landing stations with hyperscale campuses, creating vertically integrated connectivity-to-compute clusters that attract OTT and fintech workloads. Bandwidth abundance also underpins the Chennai data center market's role in AI training, where large data ingests benefit from high-capacity international routes. Combined with India's nine-fold increase in cable capacity since 2016, Chennai's share of outbound traffic continues to rise.
Renewable-energy open-access corridors in Tamil Nadu
Tamil Nadu hosts 34.7 GW of renewable assets across wind, solar, and hydro, giving operators a cost-effective path to 100% clean energy targets. Data-center power purchase agreements benefit from favorable wheeling charges and banking provisions, cutting operating costs by up to 12%. STT GDC sources more than 60% green power for its Chennai campus, while Equinix targets 100% by 2030. Renewable corridors also de-risk future carbon regulations, making sustainability a competitive differentiator in hyperscale colocation bids.
Scarcity of contiguous greater than 25-acre parcels in Greater Chennai
Urban expansion has exhausted prime land along the IT corridor, raising acquisition costs by 15-20% and forcing operators toward multi-story vertical builds or suburban campuses. Yotta's 13-acre facility achieves 20,000-rack capacity through floor-wise modular design, while ESR offers 80 acres in Oragadam to offset coastal land premiums. Land scarcity could slow the Chennai data center market unless satellite clusters emerge.
Other drivers and restraints analyzed in the detailed report include:
- Cloud-first adoption by BFSI, OTT and GCC operators
- State incentives under Tamil Nadu DC policy
- 230 kV grid-tie lead times exceed 24 months
For complete list of drivers and restraints, kindly check the Table Of Contents.
Segment Analysis
Large facilities captured 45.32% of Chennai data center market share in 2025, supported by balanced capex and near-shore connectivity advantages. The massive segment is forecast to grow at 23.12% CAGR, contributing 782.6 MW to Chennai data center market size by 2032. Hyperscale clients reserve contiguous halls exceeding 10 MW to deploy liquid-cooled AI clusters, while enterprises lease smaller blocks within large campuses for compliance-ready workloads.
Chennai's massive campuses integrate on-site substations and direct renewable feeds, reducing power latency and carbon footprints. AdaniConneX's flagship campus pairs a 400 kV switchyard with an 18 MW solar plant, enabling 30 kW racks without derating. NTT's Chennai 2 facility prioritizes modular power trains, allowing phased expansion in response to AI demand surges.
Complete Report Scope:
- By Data Center Size
- Small
- Medium
- Large
- Mega
- Massive
- By Tier Standard
- Tier I and II
- Tier III
- Tier IV
- By Absorption
- Utilized
- By Colocation Type
- Hyperscale
- Retail
- Wholesale
- By End-User Industry
- BFSI
- Cloud Service Providers
- E-Commerce
- Government
- Manufacturing
- Media and Entertainment
- Telecom
- Other End Users
- By Colocation Type
- Non-Utilized
- Utilized
List of Companies Covered in this Report:
- AdaniConneX
- Brookfield Infrastructure
- CapitaLand Data Centres (Ascendas)
- CtrlS Datacenters
- Equinix
- NTT Global Data Centers
- Nxtra by Airtel
- Reliance Data Centers
- Sify Technologies
- ST Telemedia GDC India
- Yotta Infrastructure
- Tata Communications
Additional Benefits:
- The market estimate (ME) sheet in Excel format
- 3 months of analyst support
TABLE OF CONTENTS
1 INTRODUCTION
- 1.1 Study Assumptions and Market Definition
- 1.2 Scope of the Study
2 RESEARCH METHODOLOGY
3 EXECUTIVE SUMMARY
4 MARKET LANDSCAPE
- 4.1 Market Overview
- 4.2 Market Drivers
- 4.2.1 Sub-sea cable landings multiply international bandwidth
- 4.2.2 Renewable-energy open-access corridors in Tamil Nadu
- 4.2.3 Cloud-first adoption by BFSI, OTT and GCC operators
- 4.2.4 State incentives under Tamil Nadu DC policy
- 4.2.5 >=30 kW AI/LLM rack densities force white-space retrofits
- 4.2.6 Cold-chain logistics pivot to data-powered automation hubs
- 4.3 Market Restraints
- 4.3.1 Scarcity of contiguous > 25-acre parcels in Greater Chennai
- 4.3.2 230 kV grid-tie lead times exceed 24 months
- 4.3.3 Monsoon-flood and CRZ clearance risk along ECR coastline
- 4.3.4 Shortfall of Uptime-Tier-certified commissioning talent
- 4.4 Value / Supply-Chain Analysis
- 4.5 Regulatory Landscape
- 4.6 Technological Outlook
- 4.7 Porter's Five Forces
- 4.7.1 Threat of New Entrants
- 4.7.2 Bargaining Power of Buyers
- 4.7.3 Bargaining Power of Suppliers
- 4.7.4 Threat of Substitutes
- 4.7.5 Competitive Rivalry
5 MARKET SIZE AND GROWTH FORECASTS (VALUE AND MW)
- 5.1 By Data Center Size
- 5.1.1 Small
- 5.1.2 Medium
- 5.1.3 Large
- 5.1.4 Mega
- 5.1.5 Massive
- 5.2 By Tier Standard
- 5.2.1 Tier I and II
- 5.2.2 Tier III
- 5.2.3 Tier IV
- 5.3 By Absorption
- 5.3.1 Utilized
- 5.3.1.1 By Colocation Type
- 5.3.1.1.1 Hyperscale
- 5.3.1.1.2 Retail
- 5.3.1.1.3 Wholesale
- 5.3.1.2 By End-User Industry
- 5.3.1.2.1 BFSI
- 5.3.1.2.2 Cloud Service Providers
- 5.3.1.2.3 E-Commerce
- 5.3.1.2.4 Government
- 5.3.1.2.5 Manufacturing
- 5.3.1.2.6 Media and Entertainment
- 5.3.1.2.7 Telecom
- 5.3.1.2.8 Other End Users
- 5.3.1.1 By Colocation Type
- 5.3.2 Non-Utilized
- 5.3.1 Utilized
6 COMPETITIVE LANDSCAPE
- 6.1 Market Share Analysis
- 6.2 Company Landscape
- 6.3 Company Profiles (includes Global-level Overview, Market-level Overview, Core Segments, Financials as available, Strategic Information, Market Rank/Share for key companies, Products and Services, and Recent Developments)
- 6.3.1 AdaniConneX
- 6.3.2 Brookfield Infrastructure
- 6.3.3 CapitaLand Data Centres (Ascendas)
- 6.3.4 CtrlS Datacenters
- 6.3.5 Equinix
- 6.3.6 NTT Global Data Centers
- 6.3.7 Nxtra by Airtel
- 6.3.8 Reliance Data Centers
- 6.3.9 Sify Technologies
- 6.3.10 ST Telemedia GDC India
- 6.3.11 Yotta Infrastructure
- 6.3.12 Tata Communications
- 6.4 List of Companies Studied
7 MARKET OPPORTUNITIES AND FUTURE OUTLOOK
- 7.1 White-Space and Unmet-Need Assessment

 亞特蘭大資料中心:市場佔有率分析、產業趨勢與統計及成長預測(2026-2031 年)倫敦資料中心:市場佔有率分析、產業趨勢與統計及成長預測(2026-2031 年)北加州資料中心:市佔率分析、產業趨勢與統計及成長預測(2026-2031 年)北維吉尼亞資料中心:市場佔有率分析、產業趨勢與統計及成長預測(2026-2031 年)奧斯汀資料中心:市場佔有率分析、產業趨勢與統計及成長預測(2026-2031 年)奧斯陸資料中心:市場佔有率分析、產業趨勢與統計資料、成長預測(2026-2031 年)新澤西州資料中心:市場佔有率分析、行業趨勢和統計數據以及成長預測(2026-2031 年)紐約資料中心:市場佔有率分析、產業趨勢與統計及成長預測(2025-2031 年)芝加哥資料中心:市場佔有率分析、產業趨勢與統計及成長預測(2026-2031 年)達拉斯資料中心:市場佔有率分析、產業趨勢與統計及成長預測(2026-2031 年)