


 |
市場調查報告書
商品編碼
2125672
電力零售:市場佔有率分析、產業趨勢與統計、成長預測(2026-2031)Electricity Retailing - Market Share Analysis, Industry Trends & Statistics, Growth Forecasts (2026 - 2031) |
||||||

※ 本網頁內容可能與最新版本有所差異。詳細情況請與我們聯繫。
預計到 2025 年,零售電力市場規模將達到 3.04 兆美元,到 2031 年將達到 4.04 兆美元,而 2026 年為 3.19 兆美元,預測期內(2026-2031 年)複合年成長率為 4.86%。
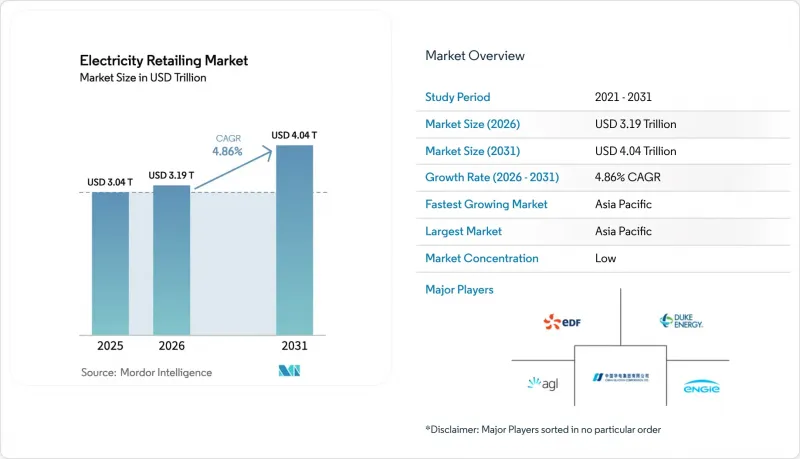
本報告按定價類型(固定費率、分時計費、動態/即時計費、綠色/可再生能源計費、訂閱模式)、最終用戶(住宅、商用、工業)和地區(北美、歐洲、亞太、南美、中東和非洲)進行細分。市場規模和預測均以美元計價。
全球電力零售市場趨勢與洞察
都市區電網電動車充電負載激增
電動車的普及正在再形成都市區電力需求曲線。預計到2025年,加州將有超過200萬輛電動車上路,到2035年這數字將達到1,250萬輛。北美電力公司報告稱,2024年充電基礎設施的支出幾乎比前一年加倍,這鮮明地表明了電氣化發展勢頭之強勁。負載柔軟性計畫使資料中心營運商能夠透過限制高峰時段的用電量來維持電網連接。德克薩斯州的一個虛擬電廠(VPP)先導計畫表明,透過在用電低谷時段充電、高峰時段放電,客戶的電費降低了40%。這些措施凸顯了電力零售市場正朝著更雙向、服務更豐富的模式發展。
一個利用數位技術進行電力供應商切換和價格比較的入口網站。
消費者已迅速獲得即時費率方案。到2025年,英國90%的家庭將了解分時電價,但只有不到一半的家庭考慮更換電價方案。在德國,一項旨在強制在2025年前引入動態電價的立法正在討論中,同時,一個新興的演算法顧問市場正在形成,這些顧問可以幫助終端用戶調整用電量,以匹配可再生能源的發電模式。那些打造了直覺易用的應用程式客戶體驗的零售商,在降低客戶解約率的同時,也吸引了精通數位技術的客戶,加劇了電力零售市場各平台之間的競爭。
受監管的違約金和價格上限給利潤率帶來了壓力。
在澳洲2025-2026年度的預設市場報價中,住宅價格上限提高了8.9%,以反映批發成本的上漲,這限制了零售商擴大利潤的空間。在德國,2024年家庭平均電費為每千瓦時0.4519歐元,但其中超過一半是稅費和附加費,這給零售商的差異化競爭能力帶來了壓力。韓國類似的干預措施使老牌大型電力公司韓國電力公司(KEPCO)背負了累積的債務負擔,凸顯了政策目標如何扭曲電力零售市場的風險收益狀況。
細分市場分析
在價格波動劇烈的情況下,固定固定費率計畫的複合年成長率為7.38%,這主要得益於企業在其供應鏈中追求低碳範圍2排放,以及消費者選擇基於氣候變遷價值觀的生活方式。西班牙家庭透過使用受監管的動態費率方案,將用電時間轉移到太陽能資源豐富的下午時段,每年可節省8-11%的電費。動態/可再生定價目前仍屬於小眾領域,但在智慧電錶幾乎涵蓋所有終端的地區,尤其是在瑞典和芬蘭,這種模式蓬勃發展。以ABB無需預付投資的電池組為代表的訂閱式「能源即服務(EaaS)」模式,體現了電力零售市場從簡單的產品銷售轉向整合解決方案的轉變。
在競爭激烈的市場環境中,數位互動和行為分析的重要性日益凸顯。投資人工智慧驅動的用量預測和遊戲化行動儀錶板的零售商,其客戶流失率比競爭對手低40%。在美國一些電力市場自由化的州,一些基於應用程式的品牌透過將可再生能源抵消與現金回饋忠誠度計畫相結合,贏得了千禧世代的青睞,這進一步表明,電力零售業差異化的關鍵在於客戶體驗,而非收費系統。
區域分析
亞太地區以46.02%的市場佔有率和5.72%的預計複合年成長率位居榜首,這主要得益於廣東省6500億千瓦時的跨省電力交易以及印度超過70吉瓦的可再生能源建設計畫。在日本和韓國,儘管價格上限存在不確定性,但批發和零售價格之間不斷擴大的差距正吸引利用金融科技的新興參與企業的注意。
在歐洲,結構性高稅和附加費仍然是一大挑戰,預計到2024年,德國家庭電費中將有54%用於支付這些費用。然而,電網的先進數位化為動態定價和需量反應奠定了基礎。北歐國家的零售商正利用近乎100%的智慧電錶普及率銷售按小時計費的綠色環保證書,這顯示創新正在抵消監管限制的影響。
北美地區經歷了前所未有的商業用電需求(光是Xcel Energy一家公司就審查了6.7吉瓦資料中心的併網提案)。同時,豐富的天然氣資源和可再生能源的快速發展緩解了批發價格的飆升。儘管各州的監管政策分散了風險收益,但良好的流動性和成熟的對沖策略為投資者提供了一個穩健的零售電力市場。
其他好處:
- Excel格式的市場預測(ME)表
- 3個月的分析師支持
目錄
第1章:引言
- 研究假設和市場定義
- 調查範圍
第2章:調查方法
第3章執行摘要
第4章 市場狀況
- 市場概覽
- 市場促進因素
- 都市區電網電動車充電負載激增
- 一個利用數位技術進行轉換和價格比較的入口網站。
- 智慧電錶的廣泛部署(歐盟、澳洲、日本)
- 零售商進入市場,整合電錶後置式 BESS(建築能源管理系統)。
- 利用區塊鏈進行P2P能源交易的試點項目
- 以企業為導向的全天候可再生能源購電協議正逐漸成為一種零售產品。
- 市場限制因素
- 受監管的違約金和價格上限正在給利潤率帶來壓力。
- 由於產消者(屋頂太陽能發電)的自用,負載降低
- 隨著家庭能源相關債務的增加,信用風險正在飆升。
- 在可再生能源佔比高的市場中,零售商需支付電網使用費。
- 供應鏈分析
- 監理情勢
- 技術展望
- 波特五力模型
第5章 市場規模與成長預測
- 按收費系統
- 固定費率/固定費率
- 基於時間的定價(ToU)
- 動態/即時
- 綠色/可再生能源衍生
- 訂閱式(EaaS)
- 最終用戶
- 住宅
- 商業
- 產業
- 按地區
- 北美洲
- 美國
- 加拿大
- 墨西哥
- 歐洲
- 德國
- 英國
- 法國
- 義大利
- 北歐國家
- 俄羅斯
- 其他歐洲國家
- 亞太地區
- 中國
- 印度
- 日本
- 韓國
- 東南亞國協
- 其他亞太國家
- 南美洲
- 巴西
- 阿根廷
- 其他南美國家
- 中東和非洲
- 沙烏地阿拉伯
- 阿拉伯聯合大公國
- 南非
- 埃及
- 其他中東和非洲國家
- 北美洲
第6章 競爭情勢
- 市場集中度
- 策略趨勢(併購、聯盟、購電協議)
- 市場佔有率分析(主要公司的市場排名和佔有率)
- 公司簡介
- State Grid Corporation of China
- Enel SpA
- Electricite de France(EDF)
- E.ON SE
- Iberdrola SA
- Engie SA
- Duke Energy Corp.
- Southern Company
- Xcel Energy
- AGL Energy Ltd.
- Origin Energy
- NRG Energy Inc.
- NextEra Energy
- KEPCO
- China Huadian Corp.
- Tata Power
- CLP Holdings
- Octopus Energy
- EnBW
- Fortum Oyj
第7章 市場機會與未來展望
According to Mordor Intelligence, the electricity retailing market size was valued at USD 3.04 trillion in 2025 and estimated to grow from USD 3.19 trillion in 2026 to reach USD 4.04 trillion by 2031, at a CAGR of 4.86% during the forecast period (2026-2031).
This report is Segmented by Tariff Type (Fixed/Flat-Rate, Time-Of-Use, Dynamic/Real-Time, Green/Renewable-Backed, and Subscription-Based), End-User (Residential, Commercial, and Industrial), and Geography (North America, Europe, Asia-Pacific, South America, and Middle East and Africa). The Market Sizes and Forecasts are Provided in Terms of Value (USD).
Global Electricity Retailing Market Trends and Insights
Surging EV-Charging Load in Urban Grids
Electric vehicle uptake is reshaping urban demand curves, with California expected to have more than 2 million EVs on the road by 2025 and projections indicating 12.5 million units on the road by 2035. North American utilities reported capital expenditures for charging infrastructure in 2024 that nearly doubled the prior-year outlays, underscoring the scale of electrification momentum. Load flexibility programs are enabling data-center operators to curtail usage at peak times to secure interconnection, and pilot virtual power plant (VPP) projects in Texas have demonstrated 40% customer-bill savings when batteries are charged during low-price hours and then discharged during system peaks.These initiatives highlight how the electricity retailing market is evolving toward bidirectional, service-rich models.
Digitally Enabled Switching & Price-Comparison Portals
Consumer access to real-time offers expanded rapidly; by 2025, 90% of UK households were aware of time-of-use tariffs, even though fewer than half were inclined to switch. Germany is legislating mandatory dynamic tariffs by 2025, creating space for algorithmic advisers that help end-users align their consumption with renewable output patterns. Retailers that built intuitive, app-based journeys achieved reduced churn while attracting digitally savvy customers, thereby accentuating platform competition across the electricity retailing market.
Margin Squeeze from Regulated Default Tariffs & Price Caps
The Australian Default Market Offer for 2025-26 increased residential tariff ceilings by up to 8.9%, reflecting higher wholesale-cost pass-through while restricting retailer margin upside. German household prices averaged EUR 0.4519 per kWh in 2024, with more than half attributable to taxes and levies, thereby compressing the retailer differentiation potential. Similar interventions in South Korea saddled incumbent KEPCO with mounting debt, underscoring how policy objectives can distort the electricity retailing market's risk-return profile.
Other drivers and restraints analyzed in the detailed report include:
- Universal Smart-Meter Roll-Outs (EU, AUS, JP)
- Retailer Entry into Behind-the-Meter BESS Aggregation
- Credit-Risk Spike Amid Rising Household Energy Debt
For complete list of drivers and restraints, kindly check the Table Of Contents.
Segment Analysis
Fixed/Flat-Rate plans maintained a 44.61% share in 2025 as households prioritised bill certainty amid price volatility. Green/Renewable-backed offers grew at a 7.38% CAGR, propelled by corporate supply chains seeking low-carbon Scope 2 footprints and consumers aligning their lifestyle choices with climate values. Spanish households on the regulated dynamic tariff saved 8-11% annually when shifting usage to solar-rich afternoon hours. Dynamic/Real-Time pricing, still niche, flourished where smart-meters covered virtually all endpoints, notably in Sweden and Finland. Subscription-style Energy-as-a-Service models, exemplified by ABB's zero-capex battery bundle, represent the electricity retailing market's shift from commodity sales to integrated solutions.
The competitive arena increasingly prizes digital engagement and behavioural insights. Retailers investing in AI-driven usage forecasting and gamified mobile dashboards report churn rates that are 40% lower than those of their peers. In deregulated US states, app-based brands have captured millennials by combining renewable offsets with cashback loyalty, reaffirming that customer experience, rather than tariff mechanics, drives differentiation across the electricity retailing industry.
Complete Report Scope:
- By Tariff Type
- Fixed/Flat-Rate
- Time-of-Use (ToU)
- Dynamic/Real-Time
- Green/Renewable-Backed
- Subscription-Based (EaaS)
- By End-User
- Residential
- Commercial
- Industrial
- By Geography
- North America
- United States
- Canada
- Mexico
- Europe
- Germany
- United Kingdom
- France
- Italy
- NORDIC Countries
- Russia
- Rest of Europe
- Asia-Pacific
- China
- India
- Japan
- South Korea
- ASEAN Countries
- Rest of Asia-Pacific
- South America
- Brazil
- Argentina
- Rest of South America
- Middle East and Africa
- Saudi Arabia
- United Arab Emirates
- South Africa
- Egypt
- Rest of Middle East and Africa
- North America
Geography Analysis
Asia-Pacific led with 46.02% share and a 5.72% CAGR outlook, undergirded by Guangdong's 650 billion kWh provincial exchange and India's renewable buildout pipeline exceeding 70 GW. Widening wholesale-retail spreads in Japan and South Korea attract fintech-enabled entrants despite tariff-cap uncertainties.
Europe grappled with structurally high taxes and levies that comprised 54% of German household bills in 2024; however, advanced grid digitalization offers a platform for dynamic pricing and demand response. Nordic retailers leverage near-100% smart-meter coverage to market hourly green certificates, illustrating how innovation offsets regulatory drag.
North America experienced unprecedented commercial load requests-Xcel Energy alone reviewed 6.7 GW of data center interconnection proposals-while abundant gas and accelerating renewables cushioned wholesale cost spikes. State-by-state regulation produces a mosaic of risk-return profiles, but healthy liquidity and sophisticated hedging underpin a robust electricity retailing market size for investors.
- State Grid Corporation of China
- Enel S.p.A.
- Electricite de France (EDF)
- E.ON SE
- Iberdrola SA
- Engie SA
- Duke Energy Corp.
- Southern Company
- Xcel Energy
- AGL Energy Ltd.
- Origin Energy
- NRG Energy Inc.
- NextEra Energy
- KEPCO
- China Huadian Corp.
- Tata Power
- CLP Holdings
- Octopus Energy
- EnBW
- Fortum Oyj
Additional Benefits:
- The market estimate (ME) sheet in Excel format
- 3 months of analyst support
TABLE OF CONTENTS
1 Introduction
- 1.1 Study Assumptions & Market Definition
- 1.2 Scope of the Study
2 Research Methodology
3 Executive Summary
4 Market Landscape
- 4.1 Market Overview
- 4.2 Market Drivers
- 4.2.1 Surging EV-charging load in urban grids
- 4.2.2 Digitally enabled switching & price-comparison portals
- 4.2.3 Universal smart-meter roll-outs (EU, AUS, JP)
- 4.2.4 Retailer entry into behind-the-meter BESS aggregation
- 4.2.5 Blockchain-based peer-to-peer energy trading pilots
- 4.2.6 Corporate 24/7 renewable PPAs becoming retail products
- 4.3 Market Restraints
- 4.3.1 Margin squeeze from regulated default tariffs & price caps
- 4.3.2 Load erosion from prosumer self-consumption (rooftop PV)
- 4.3.3 Credit-risk spike amid rising household energy debt
- 4.3.4 Grid-usage levies on retailers in high-RES markets
- 4.4 Supply-Chain Analysis
- 4.5 Regulatory Landscape
- 4.6 Technological Outlook
- 4.7 Porter's Five Forces
- 4.7.1 Bargaining Power of Suppliers
- 4.7.2 Bargaining Power of Consumers
- 4.7.3 Threat of New Entrants
- 4.7.4 Threat of Substitute Products & Services
- 4.7.5 Intensity of Competitive Rivalry
5 Market Size & Growth Forecasts
- 5.1 By Tariff Type
- 5.1.1 Fixed/Flat-Rate
- 5.1.2 Time-of-Use (ToU)
- 5.1.3 Dynamic/Real-Time
- 5.1.4 Green/Renewable-Backed
- 5.1.5 Subscription-Based (EaaS)
- 5.2 By End-User
- 5.2.1 Residential
- 5.2.2 Commercial
- 5.2.3 Industrial
- 5.3 By Geography
- 5.3.1 North America
- 5.3.1.1 United States
- 5.3.1.2 Canada
- 5.3.1.3 Mexico
- 5.3.2 Europe
- 5.3.2.1 Germany
- 5.3.2.2 United Kingdom
- 5.3.2.3 France
- 5.3.2.4 Italy
- 5.3.2.5 NORDIC Countries
- 5.3.2.6 Russia
- 5.3.2.7 Rest of Europe
- 5.3.3 Asia-Pacific
- 5.3.3.1 China
- 5.3.3.2 India
- 5.3.3.3 Japan
- 5.3.3.4 South Korea
- 5.3.3.5 ASEAN Countries
- 5.3.3.6 Rest of Asia-Pacific
- 5.3.4 South America
- 5.3.4.1 Brazil
- 5.3.4.2 Argentina
- 5.3.4.3 Rest of South America
- 5.3.5 Middle East and Africa
- 5.3.5.1 Saudi Arabia
- 5.3.5.2 United Arab Emirates
- 5.3.5.3 South Africa
- 5.3.5.4 Egypt
- 5.3.5.5 Rest of Middle East and Africa
- 5.3.1 North America
6 Competitive Landscape
- 6.1 Market Concentration
- 6.2 Strategic Moves (M&A, Partnerships, PPAs)
- 6.3 Market Share Analysis (Market Rank/Share for key companies)
- 6.4 Company Profiles (includes Global level Overview, Market level overview, Core Segments, Financials as available, Strategic Information, Products & Services, and Recent Developments)
- 6.4.1 State Grid Corporation of China
- 6.4.2 Enel S.p.A.
- 6.4.3 Electricite de France (EDF)
- 6.4.4 E.ON SE
- 6.4.5 Iberdrola SA
- 6.4.6 Engie SA
- 6.4.7 Duke Energy Corp.
- 6.4.8 Southern Company
- 6.4.9 Xcel Energy
- 6.4.10 AGL Energy Ltd.
- 6.4.11 Origin Energy
- 6.4.12 NRG Energy Inc.
- 6.4.13 NextEra Energy
- 6.4.14 KEPCO
- 6.4.15 China Huadian Corp.
- 6.4.16 Tata Power
- 6.4.17 CLP Holdings
- 6.4.18 Octopus Energy
- 6.4.19 EnBW
- 6.4.20 Fortum Oyj
7 Market Opportunities & Future Outlook
- 7.1 White-space & Unmet-Need Assessment

 日本電力產業:市場佔有率分析、產業趨勢與統計及成長預測(2026-2031年)歐洲電力市場:市場佔有率分析、產業趨勢與統計、成長預測(2026-2031 年)西班牙電力市場:市場佔有率分析、行業趨勢和統計數據、成長預測(2026-2031 年)電力:市場佔有率分析、行業趨勢和統計數據、成長預測(2026-2031 年)印度電力產業:市場佔有率分析、產業趨勢與統計、成長預測(2026-2031)馬來西亞電力:市場佔有率分析、產業趨勢與統計、成長預測(2026-2031)義大利發電:市佔率分析、產業趨勢與統計及成長預測(2026-2031 年)泰國電力市場:市場佔有率分析、產業趨勢與統計、成長預測(2026-2031)越南能源市場:市場佔有率分析、產業趨勢與統計、成長預測(2026-2031年)
 電力零售市場-全球產業規模、佔有率、趨勢、機會和預測:按市場結構、客戶類型、服務類型、支付方式、地區和競爭格局分類,2021-2031年