


 |
市場調查報告書
商品編碼
2124441
歐洲電力市場:市場佔有率分析、產業趨勢與統計、成長預測(2026-2031 年)Europe Power - Market Share Analysis, Industry Trends & Statistics, Growth Forecasts (2026 - 2031) |
||||||

※ 本網頁內容可能與最新版本有所差異。詳細情況請與我們聯繫。
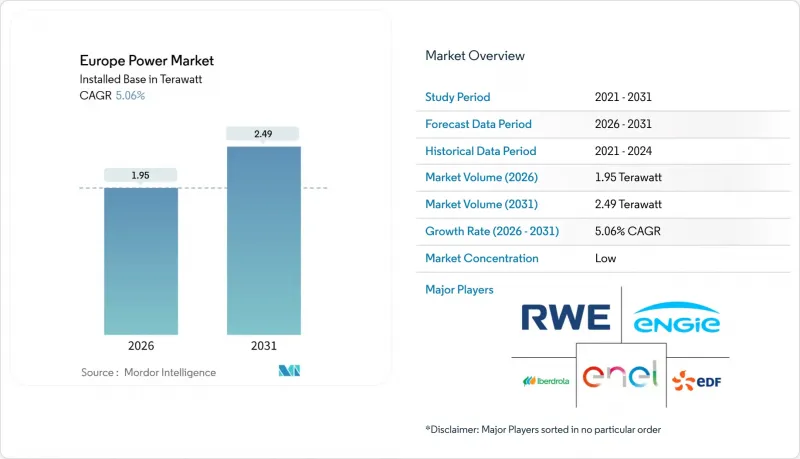
根據 Mordor Intelligence 預測,歐洲電力市場規模(以裝置容量計算)預計將從 2026 年的 1.95兆瓦擴大到 2031 年的 2.49兆瓦,在預測期(2026-2031 年)內複合年成長率為 5.06%。
本報告按能源類型(火力發電、核能、可再生能源)、終端用戶(公用事業、商業/工業、住宅)和地區(英國、德國、法國、西班牙、挪威、丹麥、瑞典、波蘭、俄羅斯和其他歐洲國家)進行細分。市場規模和預測以裝置容量(吉瓦,GW)為單位。
歐洲電力市場趨勢與洞察
歐盟的「Fit-for-55」和「REPowerEU」脫碳義務
2030年將可再生能源佔比提高到42.5%,到2050年實現淨零排放的強制性目標,鞏固了歐洲電力市場開發商的長期獲利前景。在德國,2020年至2023年新增太陽能年裝置容量達15吉瓦,陸域風電年裝置容量達10吉瓦,是年均裝置容量的三倍。簡化的核准程序,將優先領域的核准週期縮短至12個月,消除了先前長達五年的核准延誤。同時,歐盟再生能源計畫(REPowerEU)提供的3,000億歐元資金,正引導經濟復甦支出轉向加強電網建設和電池儲能。電力公司的投資組合也隨之調整,計畫將2026年預算的50%以上用於可再生能源和數位網路。電網法規現在更傾向於快速反應的電池儲能,預計2024年將新增10吉瓦時的儲能容量。分類框架也扮演了重要角色。 「不造成重大損害」的原則優先考慮具有回收和循環經濟計劃的項目,促使渦輪機製造商宣佈在法國和西班牙建立葉片回收生產線。
陸域風電和大規模太陽能發電的平準化電成本(LCOE)創歷史新低。
陸域風電的平準化度電成本(LCOE)為每兆瓦時35歐元,大型太陽能發電的平準化度電成本為每兆瓦時40歐元,兩者均比2024年煤炭和天然氣發電的基準價格低50%以上,這使得可再生能源成為歐洲電力市場的預設能源。效率的提升十分顯著。 6兆瓦陸上風力發電機的發電量比2020年的型號提高了30%,雙面太陽能板也使太陽能發電量提高了15%。西班牙2024年的競標為每兆瓦時28歐元,而英國最新一輪差價合約(CfD)購買的離岸風電價格為每兆瓦時44英鎊(56美元)。然而,平準化度電成本的下降也帶來了一個「價格悖論」。在丹麥,太陽能發電的高滲透率導致2024年中午批發電價出現負值長達42天。這加速了「電轉X」電解的普及,當年裝置容量達到2吉瓦。目前,專案的經濟可行性已將輔助服務收入納入考量,已成為投資者評估專案的新指標。
電力網路授權流程冗長以及鄰避效應(NIMBY,即「不要建在我家後院」)。
電網的平均建設週期為7至10年,但區域性挑戰通常會額外增加2至3年。德國700公里長的「南德連接線」(SuedLink)計畫就是一個典型的例子,該計畫預計於2028年開始發電,屆時將耗時13年建成,凸顯了歐洲電力市場面臨的一項重大挑戰。法國輸電系統營運商(TSO)的報告顯示,40%的項目面臨訴訟,尤其是在離岸風力發電陸上併網附近。在英國,有739吉瓦的併網項目正在等待核准,部分項目的等待時間長達15年,促使英國訂定了新的「一旦準備就緒即可併網」規則。在西班牙,指定區域的核准週期已縮短至18個月,但加泰隆尼亞和安達盧西亞的實施進度有所延遲,不不確定性依然很高。這項延誤導致德國在 2022 年至 2024 年間提案的12 吉瓦風能和太陽能發電工程崩潰,造成相當於 150 億歐元的資金停滯。
細分市場分析
至2025年,可再生能源將佔歐洲電力市場的59.40%,其部署規模將以8.51%的複合年成長率成長至2031年。離岸風電發揮主導作用,預計2024年新增裝置容量5吉瓦,另有25吉瓦計畫待建,其中丹麥的3.5吉瓦Hornsea Three計畫以及北海的多個風叢集最為突出。陸域風電預計2024年新增12吉瓦,西班牙、德國和瑞典為主要用戶。同時,大型太陽能發電新增裝置容量18吉瓦,其中西班牙貢獻了創紀錄的6吉瓦。水力發電裝置容量保持穩定,約200吉瓦,但奧地利一座1吉瓦抽水蓄能電站將於2024年投產,顯示人們對長期儲能的運作重新燃起。生質能、垃圾焚化發電、地熱能和潮汐能合計發電量佔總發電量的不到5%,但它們滿足了特定循環經濟和島嶼的需求。低成本可再生能源的湧入改變了發電格局,使火力發電廠承擔了調峰任務,導致其產能利用率從2015年的60%下降到30-40%。
傳統發電仍是電網穩定的基礎。天然氣燃氣渦輪機提供約200吉瓦的靈活備用電源,而與氫能相容的發電模式正在湧現,以減少殘餘碳排放。儘管德國已逐步淘汰核電,但核能發電在法國和英國仍佔有重要地位,全部區域裝置容量達120吉瓦。雖然燃煤發電廠的逐步淘汰將為減排創造空間,但在足夠的儲能設施投入運作之前,供不應求仍將持續存在。因此,歐洲電力市場靈活備用電源技術的規模正吸引投資者的關注,預計到2031年,抽水蓄能電站、電池儲能電站和與氫能相容的燃氣發電將佔新建設投資的15%以上。
其他好處:
- Excel格式的市場預測(ME)表
- 3個月的分析師支持
目錄
第1章:引言
- 研究假設和市場定義
- 調查範圍
第2章:調查方法
第3章執行摘要
第4章 市場狀況
- 市場概覽
- 市場促進因素
- 歐盟的「Fit-for-55」和「REPowerEU」計畫強制要求脫碳。
- 陸域風電和大規模太陽能發電的平準化電成本(LCOE)創歷史新低。
- 從2025年起,煤電和核能發電的淘汰速度將加快。
- 電網數位化(利用人工智慧進行預測性運作和維護)
- 資料中心電力需求激增(到 2030 年將超過 20 太瓦時)。
- 對適用於氫能的燃氣合併循環燃氣渦輪機進行改造,可實現靈活的備用電源供應。
- 市場限制因素
- 跨境互聯線路的運能正面臨壓力。
- 電力網路授權程序冗長以及鄰避效應(NIMBY)問題。
- 批發價格波動劇烈,給公用事業公司的利潤率帶來了壓力。
- 對可再生能源關鍵礦產供應鏈的依賴
- 供應鏈分析
- 監理情勢
- 技術展望
- 波特五力模型
第5章 市場規模與成長預測
- 透過電源
- 火力發電(煤炭、天然氣、石油和天然氣、柴油)
- 核能
- 可再生能源(太陽能、風能、水能、地熱能、生質能/廢棄物、潮汐能)
- 最終用戶
- 公用事業
- 商業和工業用途
- 住宅
- 依輸配電電壓等級(僅定性分析)
- 高壓輸電(230千伏特或以上)
- 次級輸電(69-161千伏特)
- 中壓配電(13.2–34.5 kV)
- 低壓配電(1千伏特或以下)
- 按地區
- 英國
- 德國
- 法國
- 西班牙
- 挪威
- 丹麥
- 瑞典
- 波蘭
- 俄羅斯
- 其他歐洲國家
第6章 競爭情勢
- 市場集中度
- 策略性措施(併購、合資、資金籌措、購電協議)
- 市場佔有率分析(主要公司的市場排名和佔有率)
- 公司簡介
- EDF
- Enel
- Iberdrola
- RWE
- Engie
- Statkraft
- Orsted
- National Grid
- Vattenfall
- E.ON
- Verbund
- Fortum
- SSE
- CEZ Group
- Terna
- TenneT
- Red Electrica(REE)
- Agder Energi
- Energinet
- REN
第7章 市場機會與未來展望
According to Mordor Intelligence, the Europe power market size in terms of installed base is expected to grow from 1.95 Terawatt in 2026 to 2.49 Terawatt by 2031, at a CAGR of 5.06% during the forecast period (2026-2031).
This report is Segmented by Power Source (Thermal, Nuclear, and Renewables), End User (Utilities, Commercial and Industrial, and Residential), and Geography (United Kingdom, Germany, France, Spain, Norway, Denmark, Sweden, Poland, Russia, and Rest of Europe). The Market Sizes and Forecasts are Provided in Terms of Installed Capacity (GW).
Europe Power Market Trends and Insights
EU Fit-for-55 & REPowerEU Decarbonization Mandates
Mandated renewable shares of 42.5% by 2030 and net-zero by 2050 have anchored long-term revenue visibility in the european power market for developers, pushing annual solar additions in Germany to 15 GW and onshore wind to 10 GW, triple the 2020-2023 run-rate. Streamlined permitting that caps approvals at 12 months in priority zones is easing deployment backlogs that once stretched five years, while EUR 300 billion of REPowerEU funds redirects recovery spending toward grid reinforcement and battery co-location. Utility investment portfolios are shifting in tandem, allocating more than 50% of 2026 budgets to renewables and digital networks. Grid codes now reward fast-acting battery storage, spurring 10 GWh of additions in 2024. The taxonomy framework is equally influential because "do-no-significant-harm" rules favor projects with recycling or circular-economy plans, leading turbine makers to announce blade-recycling lines in France and Spain.
Record-Low LCOE of Onshore Wind & Utility-Scale Solar
Onshore wind at EUR 35 per MWh and utility solar at EUR 40 per MWh undercut 2024 coal and gas benchmarks by more than 50%, turning renewables into the default capacity choice in the european power market. Efficiency gains are material: 6 MW onshore turbines yield 30% more output than 2020 machines, and bifacial panels raise solar yields by up to 15%. Spain's 2024 tender cleared at EUR 28 per MWh, while the United Kingdom's latest Contracts-for-Difference round delivered offshore wind at GBP 44 per MWh (USD 56). LCOE deflation has a price-paradox, though; high solar penetration in Denmark triggered midday negative wholesale prices on 42 days in 2024, accelerating power-to-X electrolyzer uptake that reached 2 GW that year. Project economics now embed ancillary-service revenue, adding new valuation levers for investors.
Lengthy Grid Permitting & NIMBY Opposition
Grid build-times average 7-10 years, with local challenges adding two to three years, evident in Germany's 700 km SuedLink that will be 13 years old by first power in 2028, highlighting a key challenge for the european power market. France's TSO reports that 40% of projects face lawsuits, especially near coastal landing points for offshore wind connections. In the United Kingdom, a connection queue of 739 GW stretches out to 15 years for some projects, prompting new "first ready, first connected" rules. Spain cut approval windows to 18 months in designated zones, yet implementation lags in Catalonia and Andalusia, keeping uncertainty high. The delays stranded 12 GW of German wind and solar proposals between 2022 and 2024, equal to EUR 15 billion of stalled capital.
Other drivers and restraints analyzed in the detailed report include:
- Accelerated Coal & Nuclear Phase-Outs Post-2025
- Digitalisation of Grids (AI-Enabled Predictive O&M)
- Congested Cross-Border Interconnector Capacity
For complete list of drivers and restraints, kindly check the Table Of Contents.
Segment Analysis
Renewables contributed 59.40% of the European power market in 2025, and their installed base is advancing at an 8.51% CAGR through 2031. Offshore wind is taking the lead, with 5 GW installed in 2024 and a 25 GW construction queue led by Denmark's 3.5 GW Hornsea Three and several North Sea clusters. Onshore wind added 12 GW in 2024, mainly in Spain, Germany, and Sweden, while utility solar added 18 GW, reflecting Spain's record 6 GW contribution. Hydro remains steady at roughly 200 GW, though Austria's 1 GW pumped-storage commissioning in 2024 highlighted renewed interest in long-duration storage. Biomass, waste-to-energy, geothermal, and tidal together stay below 5% of capacity but meet niche circular-economy and island-mode needs. The influx of low-variable-cost renewables is altering dispatch order, pushing thermal plants into peaker roles with 30%-40% capacity factors versus 60% in 2015.
Conventional generation still anchors system stability. Natural-gas turbines provide about 200 GW of flexible backup, and hydrogen-ready models are emerging to cut residual carbon. Nuclear remains prominent in France and the United Kingdom at 120 GW region-wide, despite Germany's exit. Retiring coal blocks free emissions headroom but leave adequacy gaps until sufficient storage comes online. The Europe power market size for flexible backup technologies is therefore gaining investor attention, with pumped-storage, battery farms, and hydrogen-ready gas expected to command more than 15% of new-build spending by 2031.
Complete Report Scope:
- By Power Source
- Thermal (Coal, Natural Gas, Oil and Diesel)
- Nuclear
- Renewables (Solar, Wind, Hydro, Geothermal, Biomass & Waste, Tidal)
- By End User
- Utilities
- Commercial and Industrial
- Residential
- By T&D Voltage Level (Qualitative Analysis only)
- High-Voltage Transmission (Above 230 kV)
- Sub-Transmission (69 to 161 kV)
- Medium-Voltage Distribution (13.2 to 34.5 kV)
- Low-Voltage Distribution (Up to 1 kV)
- By Geography
- United Kingdom
- Germany
- France
- Spain
- Norway
- Denmark
- Sweden
- Poland
- Russia
- Rest of Europe
List of Companies Covered in this Report:
- EDF
- Enel
- Iberdrola
- RWE
- Engie
- Statkraft
- Orsted
- National Grid
- Vattenfall
- E.ON
- Verbund
- Fortum
- SSE
- CEZ Group
- Terna
- TenneT
- Red Electrica (REE)
- Agder Energi
- Energinet
- REN
Additional Benefits:
- The market estimate (ME) sheet in Excel format
- 3 months of analyst support
TABLE OF CONTENTS
1 Introduction
- 1.1 Study Assumptions & Market Definition
- 1.2 Scope of the Study
2 Research Methodology
3 Executive Summary
4 Market Landscape
- 4.1 Market Overview
- 4.2 Market Drivers
- 4.2.1 EU Fit-for-55 & REPowerEU decarbonization mandates
- 4.2.2 Record-low LCOE of onshore wind & utility-scale solar
- 4.2.3 Accelerated coal & nuclear phase-outs post-2025
- 4.2.4 Digitalisation of grids (AI-enabled predictive O&M)
- 4.2.5 Data-centre electricity demand surge (>20 TWh by 2030)
- 4.2.6 Hydrogen-ready CCGT retrofits unlocking flexible backup
- 4.3 Market Restraints
- 4.3.1 Congested cross-border interconnector capacity
- 4.3.2 Lengthy grid permitting & NIMBY opposition
- 4.3.3 Volatile wholesale prices eroding utility margins
- 4.3.4 Critical-mineral supply-chain exposure for renewables
- 4.4 Supply-Chain Analysis
- 4.5 Regulatory Landscape
- 4.6 Technological Outlook
- 4.7 Porter's Five Forces
- 4.7.1 Bargaining Power of Suppliers
- 4.7.2 Bargaining Power of Consumers
- 4.7.3 Threat of New Entrants
- 4.7.4 Threat of Substitutes
- 4.7.5 Competitive Rivalry
5 Market Size & Growth Forecasts
- 5.1 By Power Source
- 5.1.1 Thermal (Coal, Natural Gas, Oil and Diesel)
- 5.1.2 Nuclear
- 5.1.3 Renewables (Solar, Wind, Hydro, Geothermal, Biomass & Waste, Tidal)
- 5.2 By End User
- 5.2.1 Utilities
- 5.2.2 Commercial and Industrial
- 5.2.3 Residential
- 5.3 By T&D Voltage Level (Qualitative Analysis only)
- 5.3.1 High-Voltage Transmission (Above 230 kV)
- 5.3.2 Sub-Transmission (69 to 161 kV)
- 5.3.3 Medium-Voltage Distribution (13.2 to 34.5 kV)
- 5.3.4 Low-Voltage Distribution (Up to 1 kV)
- 5.4 By Geography
- 5.4.1 United Kingdom
- 5.4.2 Germany
- 5.4.3 France
- 5.4.4 Spain
- 5.4.5 Norway
- 5.4.6 Denmark
- 5.4.7 Sweden
- 5.4.8 Poland
- 5.4.9 Russia
- 5.4.10 Rest of Europe
6 Competitive Landscape
- 6.1 Market Concentration
- 6.2 Strategic Moves (M&A, JVs, Funding, PPAs)
- 6.3 Market Share Analysis (Market Rank/Share for key companies)
- 6.4 Company Profiles (includes Global-level Overview, Market-level Overview, Core Segments, Financials, Strategic Information, Products & Services, Recent Developments)
- 6.4.1 EDF
- 6.4.2 Enel
- 6.4.3 Iberdrola
- 6.4.4 RWE
- 6.4.5 Engie
- 6.4.6 Statkraft
- 6.4.7 Orsted
- 6.4.8 National Grid
- 6.4.9 Vattenfall
- 6.4.10 E.ON
- 6.4.11 Verbund
- 6.4.12 Fortum
- 6.4.13 SSE
- 6.4.14 CEZ Group
- 6.4.15 Terna
- 6.4.16 TenneT
- 6.4.17 Red Electrica (REE)
- 6.4.18 Agder Energi
- 6.4.19 Energinet
- 6.4.20 REN
7 Market Opportunities & Future Outlook
- 7.1 White-space & Unmet-need Assessment

 電力零售:市場佔有率分析、產業趨勢與統計、成長預測(2026-2031)日本電力產業:市場佔有率分析、產業趨勢與統計及成長預測(2026-2031年)西班牙電力市場:市場佔有率分析、行業趨勢和統計數據、成長預測(2026-2031 年)電力:市場佔有率分析、行業趨勢和統計數據、成長預測(2026-2031 年)印度電力產業:市場佔有率分析、產業趨勢與統計、成長預測(2026-2031)馬來西亞電力:市場佔有率分析、產業趨勢與統計、成長預測(2026-2031)義大利發電:市佔率分析、產業趨勢與統計及成長預測(2026-2031 年)泰國電力市場:市場佔有率分析、產業趨勢與統計、成長預測(2026-2031)越南能源市場:市場佔有率分析、產業趨勢與統計、成長預測(2026-2031年)
 電力零售市場-全球產業規模、佔有率、趨勢、機會和預測:按市場結構、客戶類型、服務類型、支付方式、地區和競爭格局分類,2021-2031年