


 |
市場調查報告書
商品編碼
2124349
電力:市場佔有率分析、行業趨勢和統計數據、成長預測(2026-2031 年)Power - Market Share Analysis, Industry Trends & Statistics, Growth Forecasts (2026 - 2031) |
||||||

※ 本網頁內容可能與最新版本有所差異。詳細情況請與我們聯繫。
根據 Mordor Intelligence 估計,2025 年電力市場規模為 10,290 吉瓦,預計到 2031 年將達到 16,830 吉瓦,而 2026 年為 11,170 吉瓦,預測期(2026-2031 年)的複合年成長率為 8.55%。
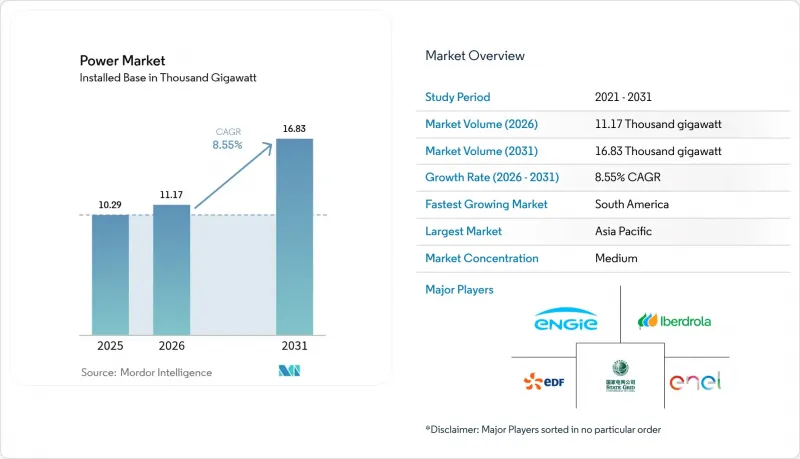
本報告按能源類型(火力發電、核能、可再生能源)、終端用戶(公共產業、工商業、住宅用戶)和地區(北美、歐洲、亞太、南美、中東和非洲)進行細分。市場規模和預測以裝置容量(吉瓦,GW)為單位。
全球電力市場趨勢與洞察
資料中心的電力需求急劇激增。
預計到2024年,資料中心的電力消耗量將達到460太瓦時(TWh),相當於阿根廷的年總負荷,佔全球電力消耗量的2%。目前,平均每個超大規模資料中心園區持續消耗100-200兆瓦(MW)的電力,迫使電力公司迅速重新協商併網規則,並升級變電站。 2024年,企業買家簽訂了23.7吉瓦(GW)的清潔能源契約,因為大型科技公司正從傳統的電力供應模式轉向確保全天候可再生能源供應。維吉尼亞的「資料中心走廊」已經運作了該州25%的發電量,迫使監管機構重新考慮容量市場參與規則[PJM.com]。這些集中負載增加了電壓不穩定的風險,推高了容量合約的溢價,最終轉嫁到零售電價上。因此,全球電力市場正在進行調整,以適應區域基本負載激增的情況,而這種現像在十年前並不常見。
工業供熱和交通電氣化
到2024年,電弧爐將佔新增鋼鐵產能的73%,歐洲40%的工業暖氣系統維修中,熱泵將取代天然氣。在交通運輸領域,1,410萬輛電動車使淨需求增加了85太瓦時(TWh),同時提供了280吉瓦時(GWh)的V2G(車輛到電網)儲能,有助於抑制晚間用電高峰。北歐電網清晰地展現了這種融合趨勢。電動車充電和工業熱泵循環的同步運行,導致一天中特定時段的用電量出現集中高峰,而精細化的定價訊號和基於人工智慧的電網運行則平衡了這些高峰。鋁提煉和化學聯合企業已經開始遷往風力資源豐富的地區,以利用廉價穩定的可再生能源,並透過簽署15至20年的購電協議來支持區域電網的擴建。隨著類似趨勢在全球蔓延,預計世界電力市場工業電力消耗量將持續成長 15-20%,每年需要投資 450 億美元加強電網建設以滿足此需求。
電網瓶頸和授權延遲
由於電網容量限制,原定於2024年動工的127吉瓦可再生能源項目被迫暫停,導致3,400億美元的投資延期。美國電網接取容量已膨脹至2,600吉瓦,是目前電網容量的五倍,平均審查週期為5.2年。歐洲跨境輸電線路在強風期間的運轉率高達95%,迫使電力公司減產47太瓦時,尤其是在西班牙和德國。為此,歐盟決策者已根據《淨零排放產業法案》採取措施,將已獲批項目的審查週期限制在12個月,但由於當地居民的反對,四分之一的高壓直流輸電項目仍處於延期狀態。如果這些瓶頸問題無法解決,可能會導致資本投資進一步延遲,投資者信心下降,從而阻礙全球電力市場脫碳進程。
細分市場分析
到2025年,可再生能源將佔總裝置容量的47.95%,預計到2031年將以13.70%的複合年成長率成長。這一成長得益於同年新增346吉瓦太陽能和116吉瓦風電的創紀錄裝置容量。在大多數地區,太陽能發電價格低於天然氣邊際價格,因此主導了白天的電力供應,並縮小了尖峰時段的價格差距。風電在夜間發揮補充作用,但由於15個國家的風電發電量佔國內電力結構的30%以上,併網挑戰日益嚴峻。離岸風力發電正以23.10%的複合年成長率成長,利用浮體式基礎在深海域佔據有利位置,並在日本、韓國和加州加速部署。同時,核能發電廠的運作以及小型模組化反應器的測試和運行,為可靠、低碳的發電提供了一條新興但具有戰略意義的途徑,這可能成為工業供熱合約的基礎。燃煤和燃油發電廠繼續退役或維修,並宣布將於 2024 年將 47 吉瓦的燃煤發電容量轉換為氫氣混燒,但其商業性可行性仍取決於碳價格超過每噸 80 美元。
可再生能源的高滲透率正促使規劃重點轉向柔軟性資產。預計2026年至2031年間,全球電網營運商需要總計2.8兆美元的投資,用於電池儲能、抽水蓄能、需量反應和聯網線路擴建。電池儲能將緩解白天太陽能發電的過剩,而跨境高壓直流輸電線路將把過剩的風電輸送到需求中心。隨著這些措施的推廣,全球電力市場將透過多元化的能源結構而非單一能源的主導地位,變得更加穩健。因此,可再生能源的快速成長將重塑整個全球電力系統的資本配置、法律規範和市場價格形成機制。
區域分析
至2025年,亞太地區將引領全球電力市場,佔全球發電裝置容量的44.20%。這主要得益於中國1411吉瓦和印度425吉瓦的裝置容量。屆時,中國將新增216吉瓦可再生能源裝置容量,超過德國的總裝置容量,同時也將新增47吉瓦燃煤電廠,以確保電網的慣性特性。相較之下,印度正在平衡其太陽能發電擴張目標與區域電池儲能競標,目標是2026年運作50吉瓦時的儲能容量。日本和韓國則依賴離岸風力發電和先進核能發電來減少對進口燃料的依賴。日本計畫在2040年將離岸風力發電裝置容量擴大到45吉瓦,而韓國正在進行一個12吉瓦的浮體式太陽能發電示範計畫。該地區併網負擔依然沉重,由於輸電能力限制,中國西北地區可再生能源棄電率超過 8.2%,凸顯了發展跨省高壓直流輸電線路的迫切需求。
南美洲已成為全球電力市場成長最快的地區,複合年成長率高達15.10%,這主要得益於智利的綠色氫能中心以及阿根廷和巴西對鋰電池電網儲能的需求。巴西擁有195吉瓦的裝置容量,利用低成本的風能和水力發電來實現採礦業和農業的脫碳。智利阿塔卡馬地區的太陽能發電快速發展,既滿足了採礦業的電力需求,也為氫氣出口終端提供了電力,使平準化成本保持在每兆瓦時30美元以下。除了可再生能源,阿根廷的瓦卡穆埃爾塔頁岩氣也為強勁的產能擴張提供了支持,穩定了一系列波動較大的發電廠。包括安地斯-太平洋高壓直流輸電線路在內的跨境聯網線路,促進了區域間電力交易,從而最佳化了雨季和旱季之間的水力發電。
到2025年,歐洲將佔全球發電裝置容量的22.80%,這得益於其在2022年天然氣危機後著力提升能源柔軟性和安全性。德國已新增17吉瓦可再生能源裝置容量,同時依靠從北歐水力發電和法國核能發電進口來平衡頻率調節。英國新增3.2吉瓦離岸風力發電,鞏固了其在浮體式基礎風電領域的領先地位。然而,成熟的電網正面臨日益嚴重的飽和,負電價時段不斷增加,儲能的經濟效益日益提升,批發市場正努力將結算週期調整為5分鐘的增量。北美、中東和非洲的市場佔有率落後於歐洲,但預計未來將實現可觀的成長。在美國,由於《通膨控制法案》(IRA)的稅額扣抵,該國計劃在2024年新增32吉瓦可再生能源裝置容量。阿拉伯聯合大公國也已在其2071年淨零排放藍圖中納入了5.6吉瓦的太陽能發電計畫。因此,區域多角化使全球電力市場能夠起到緩衝作用,抵禦特定地區發生的政策和資源衝擊。
其他好處
- Excel格式的市場預測(ME)表
- 3個月的分析師支持
目錄
第1章:引言
- 研究假設和市場定義
- 調查範圍
第2章:調查方法
第3章執行摘要
第4章 市場狀況
- 市場概覽
- 市場促進因素
- 資料中心電力需求的爆炸性成長
- 工業供熱和交通電氣化
- 政府相繼推出清潔能源補貼計畫(IRA、REPowerEU 等)
- 大型電池儲能系統的成本正在迅速下降。
- 跨境高壓直流(HVDC)超級電網的發展
- 綠色氫氣電解設備的擴建將增加基本負載需求。
- 市場限制因素
- 電網瓶頸和授權程序延誤
- 關鍵礦產供應鏈的波動性
- 在飽和電網中,可再生能源輸出的削減幅度增加
- 水力發電的氣候相關變異率
- 供應鏈分析
- 監理情勢
- 技術展望(智慧電網、儲能系統和人工智慧驅動的系統運作)
- 可再生能源細分概覽(2024 年)
- 發電容量展望(GW)
- 發電量預測(太瓦時)
- 初級能源消耗趨勢(百萬噸油當量)
- 波特五力模型
第5章 市場規模與成長預測
- 透過電源
- 火力發電(煤炭、天然氣、石油、柴油)
- 核能
- 可再生能源(太陽能、風能、水能、地熱能、生質能/廢棄物、潮汐能)
- 最終用戶
- 公共產業
- 商業和工業用途
- 住宅
- 依輸配電電壓等級(僅定性分析)
- 高壓輸電(230千伏特或以上)
- 次級輸電(69-161千伏特)
- 中壓配電(13.2-34.5kV)
- 低壓配電(1kV或以下)
- 按地區
- 北美洲
- 美國
- 加拿大
- 墨西哥
- 歐洲
- 英國
- 德國
- 法國
- 西班牙
- 北歐國家
- 俄羅斯
- 其他歐洲國家
- 亞太地區
- 中國
- 印度
- 日本
- 韓國
- 馬來西亞
- 泰國
- 印尼
- 越南
- 澳洲
- 其他亞太國家
- 南美洲
- 巴西
- 阿根廷
- 哥倫比亞
- 其他南美國家
- 中東和非洲
- 阿拉伯聯合大公國
- 沙烏地阿拉伯
- 南非
- 埃及
- 其他中東和非洲國家
- 北美洲
第6章 競爭情勢
- 市場集中度
- 策略趨勢(併購、合資、資金籌措、購電協議)
- 市場佔有率分析(主要公司的市場排名和佔有率)
- 公司簡介
- State Grid Corporation of China
- Engie SA
- Enel SpA
- Tokyo Electric Power Co. Holdings
- NTPC Ltd
- Dominion Energy
- China Huaneng Group
- Duke Energy
- E.ON SE
- Siemens Energy
- Hitachi Energy
- Electricite de France(EDF)
- Iberdrola SA
- Korea Electric Power Corp.(KEPCO)
- NextEra Energy
- Southern Company
- Exelon Corporation
- China Three Gorges Corp.
- Orsted A/S
- RWE AG
- General Electric Vernova
- Mitsubishi Electric
第7章 市場機會與未來展望
According to Mordor Intelligence, the power market size was valued at 10.29 Thousand gigawatt in 2025 and estimated to grow from 11.17 Thousand gigawatt in 2026 to reach 16.83 Thousand gigawatt by 2031, at a CAGR of 8.55% during the forecast period (2026-2031).
This report is Segmented by Power Source (Thermal, Nuclear, and Renewables) and End-User (Utilities, Commercial and Industrial, and Residential), and Geography (North America, Europe, Asia-Pacific, South America, and Middle East and Africa). The Market Sizes and Forecasts are Provided in Terms of Installed Capacity (GW).
Global Power Market Trends and Insights
Explosive Data-Center Electricity Demand Surge
Data centers consumed 460 TWh in 2024, equaling Argentina's entire annual load and representing 2% of world electricity. Average hyperscale campuses now draw 100-200 MW of continuous power, forcing utilities to renegotiate interconnection rules and fast-track substation upgrades. Corporate buyers contracted 23.7 GW of clean energy in 2024 as tech giants sidestepped traditional utility supply models to secure 24/7 renewables. Virginia's "data-center alley" already absorbs 25% of statewide generation, prompting regulators to revise capacity-market participation rules [PJM.com]. These concentrated loads heighten voltage-stability risk and drive premium capacity-contract pricing that flows through to retail tariffs. The global power market is therefore recalibrating around localized baseload spikes that were uncommon a decade ago.
Electrification of Industrial Heat & Transport
Electric arc furnaces captured 73% of new steel capacity in 2024, and heat pumps displaced natural gas in 40% of European industrial heating retrofits. On the mobility side, 14.1 million EVs added 85 TWh of net demand yet supplied 280 GWh of vehicle-to-grid storage that helped shave evening peaks. Nordic grids illustrate the convergence: synchronized EV charging and industrial heat-pump cycles create time-bundled consumption spikes that are balanced through granular tariff signals and AI-based dispatch. Aluminum smelters and chemical complexes are already relocating to wind-rich zones to capture cheap, firmed renewable power, locking in 15-20-year offtakes that underpin local transmission expansion. As similar patterns echo worldwide, the global power market anticipates sustained 15-20% rises in industrial consumption that call for USD 45 billion of annual distribution hardening.
Grid Bottlenecks & Permitting Delays
Transmission constraints sidelined 127 GW of shovel-ready renewables in 2024, translating into a USD 340 billion investment backlog. U.S. interconnection queues ballooned to 2,600 GW, five times the present grid capacity, with average study cycles extending 5.2 years. European cross-border lines ran at 95% utilization during windy hours, forcing 47 TWh of curtailment, particularly in Spain and Germany. Policymakers reacted by capping review periods to 12 months for pre-zoned projects under the EU Net-Zero Industry Act, yet community opposition still delays one in four HVDC builds. If unaddressed, these chokepoints could undercut the global power market's decarbonization pathway by deferring capital and eroding investor confidence.
Other drivers and restraints analyzed in the detailed report include:
- Government Clean-Energy Subsidy Waves
- Rapid Cost Decline in Utility-Scale Battery Storage
- Critical-Mineral Supply-Chain Volatility
For complete list of drivers and restraints, kindly check the Table Of Contents.
Segment Analysis
Renewables commanded 47.95% of 2025 installed capacity and are scaling at 13.70% CAGR through 2031, underpinned by a record 346 GW of new solar and 116 GW of wind commissioned during the year. Solar photovoltaics, cheaper than marginal gas in most regions, dominate daytime supply and compress peak-price spreads. Wind plays the complementary role during evening hours, though integration challenges rise as variable output surpasses 30% of national mixes in 15 countries. Offshore wind, growing at a 23.10% CAGR, captures deep-water sites through floating foundations, accelerating uptake in Japan, South Korea, and California. Simultaneously, nuclear restarts and small modular reactor pilots add a nascent but strategic avenue for firm, low-carbon generation that can anchor industrial heat contracts. Coal and oil plants continue to retire or retrofit; 47 GW of coal capacity announced hydrogen co-firing conversions in 2024, though commercial viability remains tied to carbon prices above USD 80 per ton.
High renewable penetration tilts planning toward flexibility assets. Grid operators worldwide will require USD 2.8 trillion in cumulative investment for batteries, pumped-hydro, demand response, and expanded interconnectors over 2026-2031. Battery storage integration softens solar midday oversupply, while cross-border HVDC links move surplus wind to load centers. As these levers scale, the global power market embeds resilience through diversified resource stacks rather than single-fuel dominance. The renewables boom, therefore, redefines capital allocation, regulatory frameworks, and merchant-price formation across global electricity systems.
Complete Report Scope:
- By Power-Generation Source
- Thermal (Coal, Natural Gas, Oil and Diesel)
- Nuclear
- Renewables (Solar, Wind, Hydro, Geothermal, Biomass & Waste, Tidal)
- By End-User
- Utilities
- Commercial and Industrial
- Residential
- By T&D Voltage Level (Qualitative Analysis only)
- High-Voltage Transmission (Above 230 kV)
- Sub-Transmission (69 to 161 kV)
- Medium-Voltage Distribution (13.2 to 34.5 kV)
- Low-Voltage Distribution (Up to 1 kV)
- By Geography
- North America
- United States
- Canada
- Mexico
- Europe
- United Kingdom
- Germany
- France
- Spain
- Nordic Countries
- Russia
- Rest of Europe
- Asia-Pacific
- China
- India
- Japan
- South Korea
- Malaysia
- Thailand
- Indonesia
- Vietnam
- Australia
- Rest of Asia-Pacific
- South America
- Brazil
- Argentina
- Colombia
- Rest of South America
- Middle East and Africa
- United Arab Emirates
- Saudi Arabia
- South Africa
- Egypt
- Rest of Middle East and Africa
- North America
Geography Analysis
Asia-Pacific led the global power market with 44.20% capacity share in 2025, anchored by China's 1,411 GW fleet and India's 425 GW. China commissioned 216 GW of new renewables during the year, more than Germany's installed base, yet also added 47 GW of coal to safeguard grid inertia. India, by contrast, balances solar ambition with regional battery tenders that target 50 GWh of storage by 2026. Japan and South Korea lean on offshore wind and advanced nuclear to curb imported-fuel dependence; Japan intends to reach 45 GW of offshore turbines by 2040, while South Korea experiments with 12 GW of floating solar. The region's integration strain remains high, with renewable curtailment surpassing 8.2% in northwest China due to limited transmission, underscoring the urgency of interprovincial HVDC lines.
South America emerged as the fastest-expanding slice of the global power market at 15.10% CAGR, propelled by green-hydrogen hubs in Chile and lithium-driven grid storage demand in Argentina and Brazil. Brazil boasts 195 GW of installed capacity, leveraging low-cost wind and hydro to decarbonize mining and agriculture. Chile's Atacama solar boom supplies both mining loads and hydrogen export terminals, achieving sub-USD 30/MWh levelized costs. Beyond renewables, Argentina's Vaca Muerta shale gas underpins firm capacity additions that stabilize an increasingly variable generation fleet. Cross-border interconnectors, including the Andes-Pacific HVDC, unlock regional trade that optimizes hydropower between wet and dry seasons.
Europe sustained 22.80% of global capacity in 2025, concentrating on flexibility and energy-security upgrades after the 2022 gas crisis. Germany installed 17 GW of renewables while leaning on Nordic hydro and French nuclear imports to balance frequency. The United Kingdom added 3.2 GW of offshore wind, cementing its leadership in floating foundations. Yet mature grids confront rising saturation; negative-price hours proliferate, storage economics improve, and wholesale markets scramble to reconfigure settlement periods to five minutes. North America and the Middle East & Africa lag in share but represent promising growth. The United States installed 32 GW of renewables in 2024, buoyed by IRA tax credits, and the UAE put 5.6 GW of solar into its 2071 net-zero roadmap. Regional diversification, therefore, buffers the global power market against policy or resource shocks in any single geography.
- State Grid Corporation of China
- Engie SA
- Enel SpA
- Tokyo Electric Power Co. Holdings
- NTPC Ltd
- Dominion Energy
- China Huaneng Group
- Duke Energy
- E.ON SE
- Siemens Energy
- Hitachi Energy
- Electricite de France (EDF)
- Iberdrola SA
- Korea Electric Power Corp. (KEPCO)
- NextEra Energy
- Southern Company
- Exelon Corporation
- China Three Gorges Corp.
- Orsted A/S
- RWE AG
- General Electric Vernova
- Mitsubishi Electric
Additional Benefits:
- The market estimate (ME) sheet in Excel format
- 3 months of analyst support
TABLE OF CONTENTS
1 Introduction
- 1.1 Study Assumptions & Market Definition
- 1.2 Scope of the Study
2 Research Methodology
3 Executive Summary
4 Market Landscape
- 4.1 Market Overview
- 4.2 Market Drivers
- 4.2.1 Explosive data-center electricity demand surge
- 4.2.2 Electrification of industrial heat & transport
- 4.2.3 Government clean-energy subsidy waves (IRA, REPowerEU, etc.)
- 4.2.4 Rapid cost decline in utility-scale battery storage
- 4.2.5 Cross-border HVDC super-grid build-outs
- 4.2.6 Green-hydrogen electrolyzer build-outs raising baseload demand
- 4.3 Market Restraints
- 4.3.1 Grid bottlenecks & permitting delays
- 4.3.2 Critical-mineral supply-chain volatility
- 4.3.3 Rising renewable curtailment in saturated grids
- 4.3.4 Climate-induced hydropower variability
- 4.4 Supply-Chain Analysis
- 4.5 Regulatory Landscape
- 4.6 Technological Outlook (Smart Grids, BESS, AI-enabled Dispatch)
- 4.7 Renewable Energy Mix Snapshot (2024)
- 4.8 Installed Power-Generation Capacity Outlook (GW)
- 4.9 Electricity Generation Outlook (TWh)
- 4.10 Primary Energy Consumption Trend (Mtoe)
- 4.11 Porter's Five Forces
- 4.11.1 Bargaining Power of Suppliers
- 4.11.2 Bargaining Power of Consumers
- 4.11.3 Threat of New Entrants
- 4.11.4 Threat of Substitutes
- 4.11.5 Intensity of Competitive Rivalry
5 Market Size & Growth Forecasts
- 5.1 By Power-Generation Source
- 5.1.1 Thermal (Coal, Natural Gas, Oil and Diesel)
- 5.1.2 Nuclear
- 5.1.3 Renewables (Solar, Wind, Hydro, Geothermal, Biomass & Waste, Tidal)
- 5.2 By End-User
- 5.2.1 Utilities
- 5.2.2 Commercial and Industrial
- 5.2.3 Residential
- 5.3 By T&D Voltage Level (Qualitative Analysis only)
- 5.3.1 High-Voltage Transmission (Above 230 kV)
- 5.3.2 Sub-Transmission (69 to 161 kV)
- 5.3.3 Medium-Voltage Distribution (13.2 to 34.5 kV)
- 5.3.4 Low-Voltage Distribution (Up to 1 kV)
- 5.4 By Geography
- 5.4.1 North America
- 5.4.1.1 United States
- 5.4.1.2 Canada
- 5.4.1.3 Mexico
- 5.4.2 Europe
- 5.4.2.1 United Kingdom
- 5.4.2.2 Germany
- 5.4.2.3 France
- 5.4.2.4 Spain
- 5.4.2.5 Nordic Countries
- 5.4.2.6 Russia
- 5.4.2.7 Rest of Europe
- 5.4.3 Asia-Pacific
- 5.4.3.1 China
- 5.4.3.2 India
- 5.4.3.3 Japan
- 5.4.3.4 South Korea
- 5.4.3.5 Malaysia
- 5.4.3.6 Thailand
- 5.4.3.7 Indonesia
- 5.4.3.8 Vietnam
- 5.4.3.9 Australia
- 5.4.3.10 Rest of Asia-Pacific
- 5.4.4 South America
- 5.4.4.1 Brazil
- 5.4.4.2 Argentina
- 5.4.4.3 Colombia
- 5.4.4.4 Rest of South America
- 5.4.5 Middle East and Africa
- 5.4.5.1 United Arab Emirates
- 5.4.5.2 Saudi Arabia
- 5.4.5.3 South Africa
- 5.4.5.4 Egypt
- 5.4.5.5 Rest of Middle East and Africa
- 5.4.1 North America
6 Competitive Landscape
- 6.1 Market Concentration
- 6.2 Strategic Moves (M&A, JVs, Funding, PPAs)
- 6.3 Market Share Analysis (Market Rank/Share for key companies)
- 6.4 Company Profiles (includes Global-level Overview, Market-level Overview, Core Segments, Financials, Strategic Information, Products & Services, Recent Developments)
- 6.4.1 State Grid Corporation of China
- 6.4.2 Engie SA
- 6.4.3 Enel SpA
- 6.4.4 Tokyo Electric Power Co. Holdings
- 6.4.5 NTPC Ltd
- 6.4.6 Dominion Energy
- 6.4.7 China Huaneng Group
- 6.4.8 Duke Energy
- 6.4.9 E.ON SE
- 6.4.10 Siemens Energy
- 6.4.11 Hitachi Energy
- 6.4.12 Electricite de France (EDF)
- 6.4.13 Iberdrola SA
- 6.4.14 Korea Electric Power Corp. (KEPCO)
- 6.4.15 NextEra Energy
- 6.4.16 Southern Company
- 6.4.17 Exelon Corporation
- 6.4.18 China Three Gorges Corp.
- 6.4.19 Orsted A/S
- 6.4.20 RWE AG
- 6.4.21 General Electric Vernova
- 6.4.22 Mitsubishi Electric
7 Market Opportunities & Future Outlook
- 7.1 White-Space & Unmet-Need Assessment

 電力零售:市場佔有率分析、產業趨勢與統計、成長預測(2026-2031)日本電力產業:市場佔有率分析、產業趨勢與統計及成長預測(2026-2031年)歐洲電力市場:市場佔有率分析、產業趨勢與統計、成長預測(2026-2031 年)西班牙電力市場:市場佔有率分析、行業趨勢和統計數據、成長預測(2026-2031 年)印度電力產業:市場佔有率分析、產業趨勢與統計、成長預測(2026-2031)馬來西亞電力:市場佔有率分析、產業趨勢與統計、成長預測(2026-2031)義大利發電:市佔率分析、產業趨勢與統計及成長預測(2026-2031 年)泰國電力市場:市場佔有率分析、產業趨勢與統計、成長預測(2026-2031)越南能源市場:市場佔有率分析、產業趨勢與統計、成長預測(2026-2031年)
 電力零售市場-全球產業規模、佔有率、趨勢、機會和預測:按市場結構、客戶類型、服務類型、支付方式、地區和競爭格局分類,2021-2031年