


 |
市場調查報告書
商品編碼
2121547
印度電力產業:市場佔有率分析、產業趨勢與統計、成長預測(2026-2031)India Power - Market Share Analysis, Industry Trends & Statistics, Growth Forecasts (2026 - 2031) |
||||||

※ 本網頁內容可能與最新版本有所差異。詳細情況請與我們聯繫。
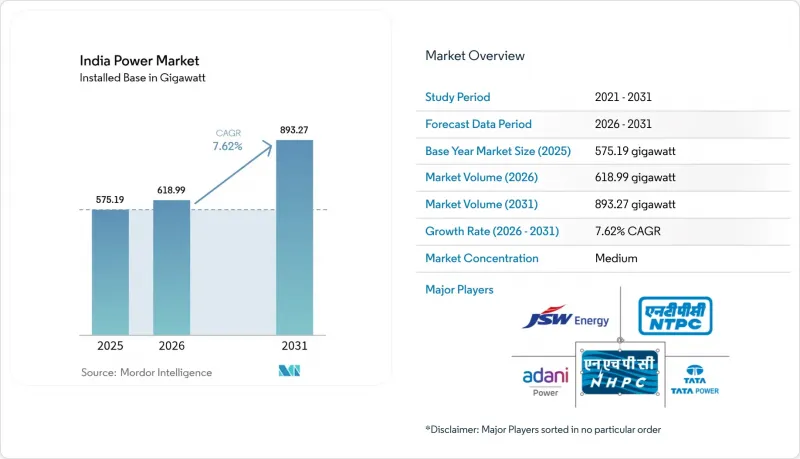
根據Mordor Intelligence預測,印度電力市場規模預計在2026年達到618.99吉瓦,高於2025年的575.19吉瓦。到2031年,該市場規模預計將達到893.27吉瓦,這意味著從2026年到2031年的複合年成長率將達到7.62%。
本報告按能源類型(火力發電、核能、可再生能源)和終端用戶(公用事業、商業/工業、居民)進行細分。市場規模和預測以裝置容量(GW)為單位。
印度電力市場趨勢與洞察
電力需求擴張
2024年,製造業產出復甦,鋼鐵、水泥和化學工業的電網總用電量年增7.2%,主要得益於新高爐、窯爐和裂解裝置的運作以及產能的擴張。同時,超大規模雲端服務供應商宣布將在孟買、海得拉巴和清奈建造1.5吉瓦的自有資料中心發電廠,以滿足人工智慧工作負載對近乎不間斷供電的需求。家庭冷凍需求也有所運轉率,平均供電可靠性超過90%,使得二、三線城市的空調普及率從個位數加倍。中央電力局(CEA)預測,除非引進新的、更有柔軟性的電源,否則到2027年,全國尖峰用電量將達到260吉瓦,部分邦的備用容量將低於7%。這些趨勢表明,印度的電力市場正處於供應主導的擴張階段,新增發電容量核准速度超過了純粹的GDP成長速度。
政府政策推動與改革
根據與生產連結獎勵計畫計劃,2024年印度政府撥款2,400億盧比,用於支持50吉瓦的綜合太陽能發電項目。預計到2026年,這將使印度對中國的電力進口依賴度降至40%。總理庫蘇姆農地太陽能發電計畫(PM-KUSUM)擴大了補貼範圍,惠及350萬台水泵,並新增了10吉瓦的日間發電容量。這確保了晚間用電高峰時段的輸電容量。 2020年《電力業務(消費者權益)條例》強制實施的分時電價制度鼓勵工業用戶將非關鍵負載轉移到日間太陽能發電高峰時段,從而緩解了古吉拉突邦等邦的電價波動。各邦的實施情況不盡相同,北方邦和比哈爾邦的進度落後約兩年,但領先地區已經實現了日間電價波動降低5%至10%。這些措施結合起來,促進了競爭性採購,加快了成本發現,並增強了人們對印度電力市場作為政策支持的轉型場所的信心。
關於配電公司(DISCOM)財務狀況的問題
2024會計年度,15家國營電力公司累計的技術和商業性虧損總合超過18%,發電企業的付款平均延遲120天,導致印度電力市場營運成本飆升。邦政府補貼的頻繁延遲迫使各公司以比政府債券殖利率高出200個基點的短期借款來彌補資金缺口,這給變壓器和配電線路的投資帶來了壓力。儘管「UDAY」債務交換計畫在2015年至2019年期間提供了暫時的緩解,但它未能實現降低虧損的目標,也未能徹底簡化政治敏感的收費系統。由於缺乏可靠的補貼資金託管系統,私人開發商傾向於選擇監管良好的邦,進一步加劇了區域投資差距。除非付款延遲大幅減少,否則印度電力市場將面臨重蹈2012年電網崩壞覆轍的風險。當時,財務困境引發了一系列營運疏忽。
細分市場分析
截至2025年,火力發電裝置容量將佔印度總裝置容量的59.70%,支撐著印度電力市場的基本負載。監管合規成本,特別是排煙脫硫設備的維修,已迫使8吉瓦老舊機組停產,這表明燃煤發電廠的成長速度在其技術壽命結束前就已趨於平緩。同時,核能發電預計將成為成長最快的領域,到2031年,其年均成長率將達到14.38%,主要得益於庫丹庫拉姆核電廠5號和6號機組以及10座國產壓水式反應爐(PHWR)的投產。
預計未來十年,印度的基本負載核能發電市場將成長11吉瓦,使其在總發電量中的比例達到4%。可再生能源持續保持最大絕對增幅,計畫每年新增15吉瓦核能發電裝置容量,古吉拉突邦沿海正在建造5吉瓦的離岸風力發電先導計畫。一座裝置容量約10吉瓦的抽水蓄能電廠已接近開發尾聲,可提供8小時穩定供給能力,並取代效率低的調峰柴油發電廠。隨著這些技術的融合,火力發電裝置容量預計將略有成長,煤炭發電佔有率預計將降至50%以下,這凸顯出印度電力市場正處於轉型期。
其他好處:
- Excel格式的市場預測(ME)表
- 3個月的分析師支持
目錄
第1章:引言
- 市場分析與定義的前提條件
- 分析範圍
第2章 分析方法
第3章執行摘要
第4章 市場狀況
- 市場概覽
- 市場促進因素
- 電力需求增加
- 政府政策推動與改革
- 可再生能源產能快速擴張
- 交通運輸和烹飪的電氣化
- 電力系統數位化和自動化的發展趨勢
- 綠色氫能試驗計畫正在推動市場需求。
- 市場限制因素
- 關於配電公司(DISCOM)財務狀況的問題
- 取得土地和環境許可的障礙
- 可再生能源波動帶來的電網穩定性挑戰
- 智慧電錶安裝資金短缺
- 供應鏈分析
- 監理情勢
- 技術展望
- 波特五力模型
- PESTLE分析
- 發電和電力消耗分析
第5章:預測市場規模與成長率
- 透過電源
- 火力發電(煤炭、天然氣、石油和天然氣、柴油)
- 核能
- 可再生能源(太陽能、風能、水力、地熱能、生質能/廢棄物、潮汐能)
- 最終用戶
- 公用事業
- 商業和工業用途
- 家用
- 輸配電電壓等級(僅定性分析)
- 高壓輸電(230千伏特或以上)
- 中壓輸電(69-161千伏特)
- 中壓配電(13.2–34.5 kV)
- 低壓配電(1千伏特或以下)
第6章 競爭情勢
- 市場集中度
- 策略趨勢(企業合併、聯盟、購電協議)
- 市場佔有率分析(主要公司的市場排名和市場佔有率)
- 公司簡介
- NTPC Ltd.
- Adani Power Ltd.
- Tata Power Company Ltd.
- Power Grid Corporation of India Ltd.
- JSW Energy Ltd.
- NHPC Ltd.
- NLC India Ltd.
- SJVN Ltd.
- Torrent Power Ltd.
- Reliance Power Ltd.
- Azure Power Global Ltd.
- ReNew Power Pvt. Ltd.
- Greenko Group
- Suzlon Energy Ltd.
- Bharat Heavy Electricals Ltd.
- CESC Ltd.
- Sterlite Power Transmission Ltd.
- GMR Energy Ltd.
- Jindal Steel & Power Ltd.
- ACME Solar Holdings
- Ayana Renewable Power
第7章 市場機會與未來展望
According to Mordor Intelligence, India power market size in 2026 is estimated at 618.99 gigawatt, growing from 2025 value of 575.19 gigawatt with 2031 projections showing 893.27 gigawatt, growing at 7.62% CAGR over 2026-2031.
This report is Segmented by Power Source (Thermal, Nuclear, and Renewables) and End-User (Utilities, Commercial and Industrial, and Residential). The Market Sizes and Forecasts are Provided in Terms of Installed Capacity (GW).
India Power Market Trends and Insights
Growing Electricity Demand
Manufacturing output rebounded in 2024, with steel, cement, and chemicals increasing combined grid draw 7.2% year on year as new furnaces, kilns, and crackers restarted or expanded capacity. Hyperscale cloud providers simultaneously announced 1.5 GW of captive data-center plants across Mumbai, Hyderabad, and Chennai to support AI workloads that require near-continuous power. Household cooling demand is also climbing, as air-conditioner penetration in tier-2 and tier-3 cities doubled from low single-digit baselines once average feeder reliability exceeded 90% up-time. The Central Electricity Authority projects national peak demand will reach 260 GW by 2027, compressing reserve margins below 7% in several states unless new flexible resources enter the stack. These dynamics position the India power market as a volume-driven expansion story where fresh capacity approvals outpace pure GDP trends.
Government Policy Push & Reforms
The Production Linked Incentive scheme disbursed INR 240 billion in 2024 to back 50 GW of integrated solar manufacturing, cutting Chinese import reliance to a projected 40% by 2026. The PM-KUSUM farm-solar program scaled subsidies to 3.5 million pumps, adding 10 GW of daytime generation that frees transmission headroom for evening peaks. Time-of-day tariffs mandated under the Electricity (Rights of Consumers) Rules 2020 now nudge industrial operators to shift non-critical loads into the mid-day solar belly, flattening the duck curve in states such as Gujarat. While implementation remains uneven, Uttar Pradesh and Bihar lag by roughly two years; early movers already record 5-10 % intraday volatility reductions. Collectively, these levers intensify competitive procurement and accelerate cost discovery, reinforcing confidence in the India power market as a policy-supported transition arena.
DISCOM Financial-Health Issues
Fifteen state utilities posted aggregate technical and commercial losses above 18% in fiscal 2024, delaying generator payments by an average of 120 days and inflating working-capital costs across the India power market. Subsidy transfers from state treasuries often arrive late, forcing companies to bridge gaps with short-term debt priced 200 basis points over sovereign yields, crowding out capex for transformers and feeders. UDAY debt swaps offered temporary relief between 2015 and 2019 but failed to enforce loss-reduction targets or politically sensitive tariff rationalization. Absent a credible escrow on subsidy flows, private developers prefer states with better discipline, deepening regional investment asymmetries. Unless payment backlogs shrink sharply, the India power market risks repeating the 2012 grid collapse episode, when financial distress cascaded into operational neglect.
Other drivers and restraints analyzed in the detailed report include:
- Rapid Renewable Capacity Additions
- Grid Digitalization & Automation Wave
- Grid-Stability Challenges from Variable Renewable Energy
For complete list of drivers and restraints, kindly check the Table Of Contents.
Segment Analysis
Thermal assets accounted for 59.70% of installed capacity in 2025, anchoring the baseload foundation of the India power market. Compliance costs, notably flue-gas desulfurization retrofits, have forced 8 GW of aging units offline, signaling a plateau even before coal plants exhaust their technical life. Conversely, nuclear additions averaging 14.38% annually to 2031 position the segment as the fastest grower, propelled by Kudankulam Units 5 and 6 and ten indigenously designed PHWRs.
The India power market size for baseload nuclear is projected to expand by 11 GW this decade, lifting nuclear's contribution to 4% of total capacity. Renewables continue to post the largest absolute additions, with solar alone slated for 15 GW per year and offshore wind emerging as a 5 GW pilot pipeline off the Gujarat coast. Pumped-storage hydro, nearly 10 GW in advanced stages, will provide eight-hour firming that can displace inefficient peaking diesel sets. As these technologies converge, coal's share will slide below 50% even as absolute thermal gigawatts inch higher, underscoring the transitional character of the India power market.
Complete Report Scope:
- By Power Source
- Thermal (Coal, Natural Gas, Oil and Diesel)
- Nuclear
- Renewables (Solar, Wind, Hydro, Geothermal, Biomass & Waste, Tidal)
- By End User
- Utilities
- Commercial and Industrial
- Residential
- By T&D Voltage Level (Qualitative Analysis only)
- High-Voltage Transmission (Above 230 kV)
- Sub-Transmission (69 to 161 kV)
- Medium-Voltage Distribution (13.2 to 34.5 kV)
- Low-Voltage Distribution (Up to 1 kV)
List of Companies Covered in this Report:
- NTPC Ltd.
- Adani Power Ltd.
- Tata Power Company Ltd.
- Power Grid Corporation of India Ltd.
- JSW Energy Ltd.
- NHPC Ltd.
- NLC India Ltd.
- SJVN Ltd.
- Torrent Power Ltd.
- Reliance Power Ltd.
- Azure Power Global Ltd.
- ReNew Power Pvt. Ltd.
- Greenko Group
- Suzlon Energy Ltd.
- Bharat Heavy Electricals Ltd.
- CESC Ltd.
- Sterlite Power Transmission Ltd.
- GMR Energy Ltd.
- Jindal Steel & Power Ltd.
- ACME Solar Holdings
- Ayana Renewable Power
Additional Benefits:
- The market estimate (ME) sheet in Excel format
- 3 months of analyst support
TABLE OF CONTENTS
1 Introduction
- 1.1 Study Assumptions & Market Definition
- 1.2 Scope of the Study
2 Research Methodology
3 Executive Summary
4 Market Landscape
- 4.1 Market Overview
- 4.2 Market Drivers
- 4.2.1 Growing electricity demand
- 4.2.2 Government policy push & reforms
- 4.2.3 Rapid renewable capacity additions
- 4.2.4 Electrification of transport & cooking
- 4.2.5 Grid digitalisation & automation wave
- 4.2.6 Green-hydrogen pilot programmes driving load
- 4.3 Market Restraints
- 4.3.1 DISCOM financial-health issues
- 4.3.2 Land & environmental-clearance hurdles
- 4.3.3 Grid-stability challenges from variable RE
- 4.3.4 Capital crunch for smart-meter rollout
- 4.4 Supply-Chain Analysis
- 4.5 Regulatory Landscape
- 4.6 Technological Outlook
- 4.7 Porter's Five Forces
- 4.7.1 Threat of New Entrants
- 4.7.2 Bargaining Power of Suppliers
- 4.7.3 Bargaining Power of Buyers
- 4.7.4 Threat of Substitutes
- 4.7.5 Competitive Rivalry
- 4.8 PESTLE Analysis
- 4.9 Electricity Generation & Consumption Analysis
5 Market Size & Growth Forecasts
- 5.1 By Power Source
- 5.1.1 Thermal (Coal, Natural Gas, Oil and Diesel)
- 5.1.2 Nuclear
- 5.1.3 Renewables (Solar, Wind, Hydro, Geothermal, Biomass & Waste, Tidal)
- 5.2 By End User
- 5.2.1 Utilities
- 5.2.2 Commercial and Industrial
- 5.2.3 Residential
- 5.3 By T&D Voltage Level (Qualitative Analysis only)
- 5.3.1 High-Voltage Transmission (Above 230 kV)
- 5.3.2 Sub-Transmission (69 to 161 kV)
- 5.3.3 Medium-Voltage Distribution (13.2 to 34.5 kV)
- 5.3.4 Low-Voltage Distribution (Up to 1 kV)
6 Competitive Landscape
- 6.1 Market Concentration
- 6.2 Strategic Moves (M&A, Partnerships, PPAs)
- 6.3 Market Share Analysis (Market Rank/Share for key companies)
- 6.4 Company Profiles (includes Global level Overview, Market level overview, Core Segments, Financials as available, Strategic Information, Products & Services, and Recent Developments)
- 6.4.1 NTPC Ltd.
- 6.4.2 Adani Power Ltd.
- 6.4.3 Tata Power Company Ltd.
- 6.4.4 Power Grid Corporation of India Ltd.
- 6.4.5 JSW Energy Ltd.
- 6.4.6 NHPC Ltd.
- 6.4.7 NLC India Ltd.
- 6.4.8 SJVN Ltd.
- 6.4.9 Torrent Power Ltd.
- 6.4.10 Reliance Power Ltd.
- 6.4.11 Azure Power Global Ltd.
- 6.4.12 ReNew Power Pvt. Ltd.
- 6.4.13 Greenko Group
- 6.4.14 Suzlon Energy Ltd.
- 6.4.15 Bharat Heavy Electricals Ltd.
- 6.4.16 CESC Ltd.
- 6.4.17 Sterlite Power Transmission Ltd.
- 6.4.18 GMR Energy Ltd.
- 6.4.19 Jindal Steel & Power Ltd.
- 6.4.20 ACME Solar Holdings
- 6.4.21 Ayana Renewable Power
7 Market Opportunities & Future Outlook
- 7.1 White-space & unmet-need assessment

 電力零售:市場佔有率分析、產業趨勢與統計、成長預測(2026-2031)日本電力產業:市場佔有率分析、產業趨勢與統計及成長預測(2026-2031年)歐洲電力市場:市場佔有率分析、產業趨勢與統計、成長預測(2026-2031 年)西班牙電力市場:市場佔有率分析、行業趨勢和統計數據、成長預測(2026-2031 年)電力:市場佔有率分析、行業趨勢和統計數據、成長預測(2026-2031 年)馬來西亞電力:市場佔有率分析、產業趨勢與統計、成長預測(2026-2031)義大利發電:市佔率分析、產業趨勢與統計及成長預測(2026-2031 年)泰國電力市場:市場佔有率分析、產業趨勢與統計、成長預測(2026-2031)越南能源市場:市場佔有率分析、產業趨勢與統計、成長預測(2026-2031年)
 電力零售市場-全球產業規模、佔有率、趨勢、機會和預測:按市場結構、客戶類型、服務類型、支付方式、地區和競爭格局分類,2021-2031年