

 |
市場調查報告書
商品編碼
2124708
日本電力產業:市場佔有率分析、產業趨勢與統計及成長預測(2026-2031年)Japan Power - Market Share Analysis, Industry Trends & Statistics, Growth Forecasts (2026 - 2031) |
||||||

※ 本網頁內容可能與最新版本有所差異。詳細情況請與我們聯繫。
根據 Mordor Intelligence 估計,2026 年日本電力市場規模將達到 397.34 吉瓦,比 2025 年的 393.33 吉瓦增加,預計到 2031 年將達到 417.99 吉瓦。
預計從 2026 年到 2031 年,年複合成長率將達到 1.02%。
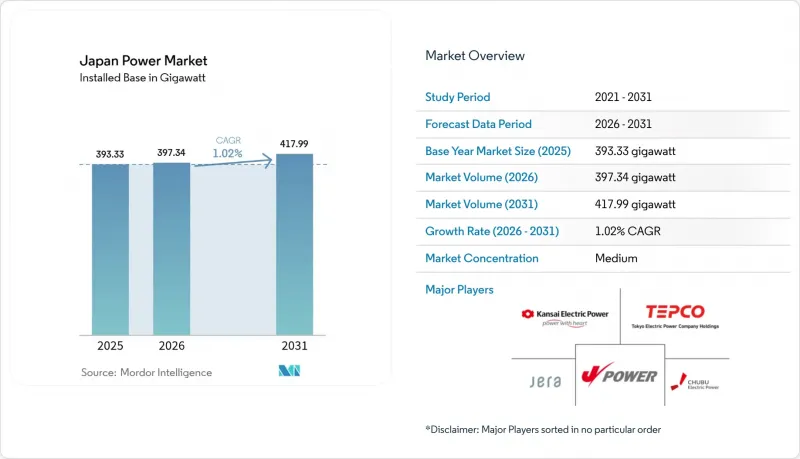
本報告按能源類型(火力發電、核能、可再生能源)、終端用戶(公共產業、商業/工業、住宅)以及輸配電電壓等級進行細分。市場規模和預測以裝置容量(GW)為單位。
日本電力市場趨勢與洞察
扣除太陽能組件和安裝成本後
組件價格已從2018年的17.6日圓/千瓦時降至2024年部分競標中低於8日圓/千瓦時,這使得太陽能發電無需補貼即可在批發市場參與競爭。硬體價格的降低和軟體成本的精簡正推動該技術擺脫對上網電價補貼(FIT)的依賴,轉向基於競標的定價模式。這一成本曲線的下降與屋頂光伏發電的普及同步進行,屋頂光伏發電有助於避免土地短缺,並促進了農業光伏發電(農業與太陽能的融合)的發展。像村田製作所這樣的製造商正透過虛擬購電協議(VPPA)鎖定70兆瓦的裝置容量,以鞏固工業走廊的需求,從而實現再生能源100%的目標。隨著電池價格的下降,白天太陽能發電的峰值功率正擴大轉移到夜間需求,這給峰值電站的利潤率帶來了壓力,並重塑了容量市場的動態。
擴大離岸風電競標項目
在2024年12月的第三次競標中,1吉瓦的裝置容量以3日圓/千瓦時的價格成交,確認了其與傳統發電方式的成本持平。浮體式基礎使得在更深的海域進行開發成為可能,從而避免了沿海水深限制。由JERA主導的財團旨在開發一種能夠抵禦颱風的平台。政府為保障電網安全而製定的指導指南將海底租賃與電網建設掛鉤,緩解了長期存在的瓶頸問題。歐洲開發商正在轉移在惡劣環境下作業的專業知識,而日本公司則提供企劃案融資,並建立混合模式以建立國內供應鏈。與漁業相關人員的談判進度以及港口基礎設施的建設將決定該行業能否在2030年實現10吉瓦的目標。
液化天然氣價格波動與進口依賴性
由於日本96%的能源依賴進口,液化天然氣現貨價格的飆升曾一度導致隔日電價超過每千瓦時1美元,對電力公司的利潤率帶來壓力。自2014年核電廠運作,液化天然氣消耗量減少了25%,但日本對液化天然氣的依賴程度仍存在。目前,公司正在將已簽訂合約的液化天然氣轉售到海外,這表明需求結構性下降。同時,九州電力公司正在投資美國出口終端的上游業務,以對沖價格波動風險。氨和氫的混燒技術正處於測試階段,但尚未達到商業規模。
細分市場分析
預計到2025年,可再生能源將佔日本電力市場佔有率的40.05%,並在太陽能和離岸風電快速發展的推動下,以3.72%的複合年成長率持續成長至2031年。僅太陽能發電一項,累積設備容量就已達到91吉瓦,這得益於組件價格低廉和私人購電協議(PPA)的普及。離岸風電目前僅有0.3吉瓦的運作中資產,但政府已主導目標,到2030年達到10吉瓦,到2040年達到45吉瓦,使其成為所有能源中成長最快的。地熱能和生質能由於授權限制和高昂的進口成本,仍處於小眾市場。
預計到2025年,火力發電在日本電力市場仍將佔51.80%的佔有率,但不斷上漲的碳價和強制使用氨氣混燒正對其長期獲利能力構成壓力。日本能源研究協會(JERA)在裝置容量為4.1吉瓦的碧南燃煤發電廠的試點計畫採用了20%的氨氣混燒,政府計畫在2030年在所有電廠推廣這項技術,這將需要每年進口300萬噸氨氣。 2024年,核能發電廠運作將新增8,26兆瓦的裝置容量,如果當地社區能夠更理解核電,預計這一數字將進一步接近20%的佔有率目標。由於新建水壩面臨環境方面的限制,水力發電裝置容量將維持在50吉瓦左右的穩定水準。整體而言,這些市場佔有率的波動凸顯了日本電力市場投資正向零碳發電設施轉變。
其他好處:
- Excel格式的市場預測(ME)表
- 3個月的分析師支持
目錄
第1章:引言
- 研究假設和市場定義
- 調查範圍
第2章:調查方法
第3章執行摘要
第4章 市場狀況
- 市場概覽
- 市場促進因素
- 扣除太陽能組件和安裝成本後
- 擴大離岸風力發電競標
- 基於GX政策的核子反應爐運作
- 電網級電池儲能的成本正在下降。
- 重工業領域公司對購電協議的需求
- 透過引入智慧電錶和需量反應。
- 市場限制因素
- 液化天然氣價格波動和對進口的依賴
- 可用於公共產業太陽能發電的土地有限。
- 老化的輸電設備以及授權程序延誤
- 當地居民反對新建高壓輸電線路。
- 供應鏈分析
- 監理情勢
- 技術展望
- 波特五力模型
- PESTLE分析
第5章 市場規模與成長預測
- 透過電源
- 火力發電(煤炭、天然氣、石油和天然氣、柴油)
- 核能
- 可再生能源(太陽能、風能、水能、地熱能、生質能/廢棄物、潮汐能)
- 最終用戶
- 公共產業
- 商業和工業
- 住宅
- 輸配電電壓等級(僅定性分析)
- 高壓輸電(230千伏以上)
- 半輸電線路(69-161千伏)
- 中壓配電(13.2–34.5 kV)
- 低壓配電(1千伏特或以下)
第6章 競爭情勢
- 市場集中度
- 策略趨勢(併購、聯盟、購電協議)
- 市場佔有率分析(主要公司的市場排名和市場佔有率)
- 公司簡介
- Tokyo Electric Power Company Holdings(TEPCO)
- Kansai Electric Power Company
- Chubu Electric Power
- Hokkaido Electric Power
- Tohoku Electric Power
- Hokuriku Electric Power
- Chugoku Electric Power
- Shikoku Electric Power
- Kyushu Electric Power
- Okinawa Electric Power
- JERA Co., Inc.
- Electric Power Development Co.(J-POWER)
- Japan Renewable Energy Corporation
- Hitachi Energy
- Mitsubishi Electric Corporation
- Toshiba Energy Systems & Solutions
- Sumitomo Corporation(Renewables)
- Marubeni Corporation(Power)
- Mitsubishi Heavy Industries(Energy)
- Orsted Japan KK
第7章 市場機會與未來展望
According to Mordor Intelligence, Japan power market size in 2026 is estimated at 397.34 gigawatt, growing from 2025 value of 393.33 gigawatt with 2031 projections showing 417.99 gigawatt, growing at 1.02% CAGR over 2026-2031.
This report is Segmented by Power Source (Thermal, Nuclear, and Renewables) and End-User (Utilities, Commercial and Industrial, and Residential). The Market Sizes and Forecasts are Provided in Terms of Installed Capacity (GW).
Japan Power Market Trends and Insights
Declining PV Module & Installation Costs
Module prices fell from 17.6 yen/kWh in 2018 to below 8 yen/kWh for several 2024 bids, letting solar compete in wholesale markets without subsidies. Hardware deflation and streamlined soft costs now move the technology from feed-in-tariff reliance toward auction-based price discovery. This cost curve dovetails with rooftop and agrivoltaic deployment that circumvents land scarcity. Manufacturers such as Murata locked 70 MW through virtual PPAs to meet RE100 goals, anchoring demand in industrial corridors. As battery prices drop, midday solar peaks increasingly shift into evening demand, eroding peaking-plant margins and reshaping capacity-market dynamics.
Offshore Wind Auction Pipeline Expansion
Round-3 tenders in December 2024 awarded 1 GW at JPY 3/kWh, confirming cost parity with conventional generation. Floating foundations unlock deeper waters and sidestep coastal depth constraints, with JERA-led groups targeting typhoon-resilient platforms. Government grid-reservation directives now coordinate seabed leases with transmission build-outs, mitigating a historic bottleneck. European developers transfer harsh-environment know-how, while Japanese trading houses supply project finance in a hybrid model that builds domestic supply chains. Resolution of fishing-industry consultations and port-infrastructure upgrades will decide whether the sector can hit the 10 GW by 2030 milestone.
LNG Price Volatility & Import Reliance
Japan imports 96% of its energy, so LNG spot surges once drove day-ahead power prices above USD 1/kWh, compressing utility margins. Although nuclear restarts cut LNG burn 25% since 2014, residual dependency persists. Trading houses now resell contracted cargoes abroad, signalling structural demand erosion, while Kyushu Electric pursues upstream stakes in US export terminals to hedge volatility. Co-firing ammonia or hydrogen is under trial but lacks commercial scale.
Other drivers and restraints analyzed in the detailed report include:
- Nuclear Reactor Restarts Under GX Policy
- Grid-Scale Battery Storage Cost Declines
- Limited On-Shore Land for Utility Solar
For complete list of drivers and restraints, kindly check the Table Of Contents.
Segment Analysis
The renewables slice of the Japan power market size climbed to 40.05% in 2025 and is tracking a 3.72% CAGR through 2031 as solar and offshore wind scale rapidly. Solar alone reached 91 GW cumulative capacity, bolstered by low module prices and merchant PPA uptake. Offshore wind holds just 0.3 GW of operating assets but 10 GW of government-backed targets by 2030 and up to 45 GW by 2040, setting the stage for the fastest absolute growth among resources. Geothermal and biomass remain niche due to permitting limits and imported feedstock costs.
Thermal generation defended 51.80% Japan's power market share in 2025, yet escalating carbon prices and ammonia co-firing mandates pressure long-term economics. JERA's pilot at the 4.1 GW Hekinan coal plant blends 20% ammonia, and government policy seeks fleet-wide adoption by 2030, requiring 3 million t of annual imports. Nuclear restarts added 826 MW in 2024 and will climb toward the 20% generation share goal if community consent improves. Hydropower remains flat at roughly 50 GW because new dam sites face environmental limits. Collectively, shifting shares underscore how investment is tilting toward zero-carbon capacity within the Japan power market.
Complete Report Scope:
- By Power Source
- Thermal (Coal, Natural Gas, Oil and Diesel)
- Nuclear
- Renewables (Solar, Wind, Hydro, Geothermal, Biomass & Waste, Tidal)
- By End User
- Utilities
- Commercial and Industrial
- Residential
- By T&D Voltage Level (Qualitative Analysis only)
- High-Voltage Transmission (Above 230 kV)
- Sub-Transmission (69 to 161 kV)
- Medium-Voltage Distribution (13.2 to 34.5 kV)
- Low-Voltage Distribution (Up to 1 kV)
List of Companies Covered in this Report:
- Tokyo Electric Power Company Holdings (TEPCO)
- Kansai Electric Power Company
- Chubu Electric Power
- Hokkaido Electric Power
- Tohoku Electric Power
- Hokuriku Electric Power
- Chugoku Electric Power
- Shikoku Electric Power
- Kyushu Electric Power
- Okinawa Electric Power
- JERA Co., Inc.
- Electric Power Development Co. (J-POWER)
- Japan Renewable Energy Corporation
- Hitachi Energy
- Mitsubishi Electric Corporation
- Toshiba Energy Systems & Solutions
- Sumitomo Corporation (Renewables)
- Marubeni Corporation (Power)
- Mitsubishi Heavy Industries (Energy)
- Orsted Japan K.K.
Additional Benefits:
- The market estimate (ME) sheet in Excel format
- 3 months of analyst support
TABLE OF CONTENTS
1 Introduction
- 1.1 Study Assumptions & Market Definition
- 1.2 Scope of the Study
2 Research Methodology
3 Executive Summary
4 Market Landscape
- 4.1 Market Overview
- 4.2 Market Drivers
- 4.2.1 Declining PV Module & Installation Costs
- 4.2.2 Offshore Wind Auction Pipeline Expansion
- 4.2.3 Nuclear Reactor Restarts Under GX Policy
- 4.2.4 Grid-Scale Battery Storage Cost Declines
- 4.2.5 Corporate PPA Demand from Heavy Industry
- 4.2.6 Smart-Meter Roll-Out & Demand-Response Upside
- 4.3 Market Restraints
- 4.3.1 LNG Price Volatility & Import Reliance
- 4.3.2 Limited On-Shore Land for Utility Solar
- 4.3.3 Ageing Transmission Assets & Permitting Delays
- 4.3.4 Local Opposition to New High-Voltage Lines
- 4.4 Supply-Chain Analysis
- 4.5 Regulatory Landscape
- 4.6 Technological Outlook
- 4.7 Porter's Five Forces
- 4.7.1 Threat of New Entrants
- 4.7.2 Bargaining Power of Suppliers
- 4.7.3 Bargaining Power of Buyers
- 4.7.4 Threat of Substitutes
- 4.7.5 Competitive Rivalry
- 4.8 PESTLE Analysis
5 Market Size & Growth Forecasts
- 5.1 By Power Source
- 5.1.1 Thermal (Coal, Natural Gas, Oil and Diesel)
- 5.1.2 Nuclear
- 5.1.3 Renewables (Solar, Wind, Hydro, Geothermal, Biomass & Waste, Tidal)
- 5.2 By End User
- 5.2.1 Utilities
- 5.2.2 Commercial and Industrial
- 5.2.3 Residential
- 5.3 By T&D Voltage Level (Qualitative Analysis only)
- 5.3.1 High-Voltage Transmission (Above 230 kV)
- 5.3.2 Sub-Transmission (69 to 161 kV)
- 5.3.3 Medium-Voltage Distribution (13.2 to 34.5 kV)
- 5.3.4 Low-Voltage Distribution (Up to 1 kV)
6 Competitive Landscape
- 6.1 Market Concentration
- 6.2 Strategic Moves (M&A, Partnerships, PPAs)
- 6.3 Market Share Analysis (Market Rank/Share for key companies)
- 6.4 Company Profiles (includes Global level Overview, Market level overview, Core Segments, Financials as available, Strategic Information, Products & Services, and Recent Developments)
- 6.4.1 Tokyo Electric Power Company Holdings (TEPCO)
- 6.4.2 Kansai Electric Power Company
- 6.4.3 Chubu Electric Power
- 6.4.4 Hokkaido Electric Power
- 6.4.5 Tohoku Electric Power
- 6.4.6 Hokuriku Electric Power
- 6.4.7 Chugoku Electric Power
- 6.4.8 Shikoku Electric Power
- 6.4.9 Kyushu Electric Power
- 6.4.10 Okinawa Electric Power
- 6.4.11 JERA Co., Inc.
- 6.4.12 Electric Power Development Co. (J-POWER)
- 6.4.13 Japan Renewable Energy Corporation
- 6.4.14 Hitachi Energy
- 6.4.15 Mitsubishi Electric Corporation
- 6.4.16 Toshiba Energy Systems & Solutions
- 6.4.17 Sumitomo Corporation (Renewables)
- 6.4.18 Marubeni Corporation (Power)
- 6.4.19 Mitsubishi Heavy Industries (Energy)
- 6.4.20 Orsted Japan K.K.
7 Market Opportunities & Future Outlook
- 7.1 White-Space & Unmet-Need Assessment
- 7.2 Progress in Japan's Offshore Wind Power Sector
- 7.3 Grid Digitalisation & Advanced Analytics
- 7.4 Hydrogen/Ammonia Co-Firing in Thermal Plants

 電力零售:市場佔有率分析、產業趨勢與統計、成長預測(2026-2031)歐洲電力市場:市場佔有率分析、產業趨勢與統計、成長預測(2026-2031 年)西班牙電力市場:市場佔有率分析、行業趨勢和統計數據、成長預測(2026-2031 年)電力:市場佔有率分析、行業趨勢和統計數據、成長預測(2026-2031 年)印度電力產業:市場佔有率分析、產業趨勢與統計、成長預測(2026-2031)馬來西亞電力:市場佔有率分析、產業趨勢與統計、成長預測(2026-2031)義大利發電:市佔率分析、產業趨勢與統計及成長預測(2026-2031 年)泰國電力市場:市場佔有率分析、產業趨勢與統計、成長預測(2026-2031)越南能源市場:市場佔有率分析、產業趨勢與統計、成長預測(2026-2031年)
 電力零售市場-全球產業規模、佔有率、趨勢、機會和預測:按市場結構、客戶類型、服務類型、支付方式、地區和競爭格局分類,2021-2031年