


 |
市場調查報告書
商品編碼
2124533
美國資料中心建置:市場佔有率分析、產業趨勢與統計、成長預測(2026-2031)United States Data Center Construction - Market Share Analysis, Industry Trends & Statistics, Growth Forecasts (2026 - 2031) |
||||||

※ 本網頁內容可能與最新版本有所差異。詳細情況請與我們聯繫。
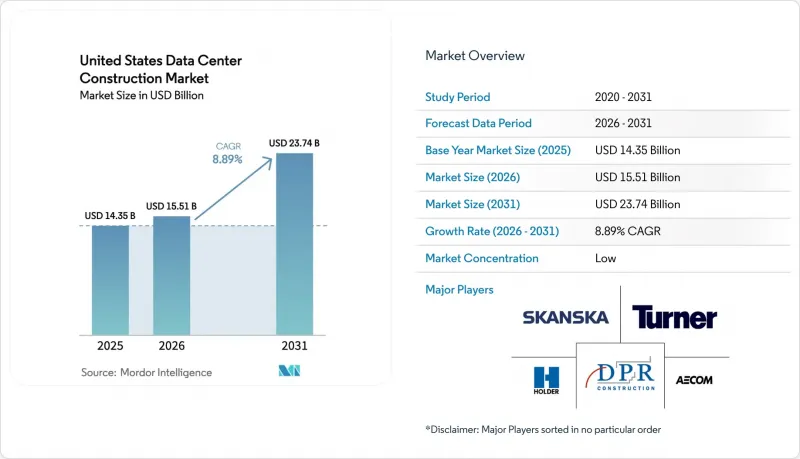
據 Mordor Intelligence 稱,2025 年美國資料中心建設市場價值為 143.5 億美元,預計到 2031 年將達到 237.4 億美元,而 2026 年為 155.1 億美元,在預測期(2026-2031 年)內,成長率複合年成長率為 8.89%。
本報告按資料中心層級(一級和二級、三級、四級)、資料中心規模(小規模、中型、大型、超大規模)、資料中心類型(託管、超大規模資料中心業者/雲端服務供應商、企業邊緣)以及基礎設施(電氣、機械、一般建築、服務)進行分類。市場預測以美元計價。
美國資料中心建設市場趨勢與洞察
雲端運算、人工智慧和巨量資料工作負載正在迅速成長。
預計生成式人工智慧推理叢集的平均機架負載將翻倍,設計密度將在2026年達到15千瓦,並在2028年達到25千瓦。營運商正在推進諸如後門熱交換器和晶片直連迴路等維修,這些升級將使每兆瓦的預算增加150萬至200萬美元。亞馬遜網路服務(AWS)正在其位於賓州的設施上投資110億美元,微軟已在全球整體撥出800億美元用於人工智慧最佳化園區,這表明超大規模資料中心超大規模資料中心業者正在重新配置資本。由於全球超過一半的超大規模資料中心集中在美國,市場需求呈現兩極化:一方面是用於訓練的100兆瓦級園區,另一方面是用於低延遲推理的兆瓦級以下邊緣節點。
超大規模自建管道,容量超過10吉瓦
亞馬遜雲端服務(AWS)、微軟Azure、Google雲端和Meta這四家公司共有四家在建項目,總裝置容量超過10吉瓦。 Meta已確認在路易斯安那州投資100億美元建設園區,Google也為其在德克薩斯州的擴張計畫追加了10億美元。這表明,超大規模資料中心正在向次市場轉移,這些市場的土地和電網連接成本比一線中心低60%。如今,超大規模資料中心業者營運商自行開展土木工程,並聘請機電專家,將專案週期從24個月縮短至18個月,這使得總承包商的利潤減少了約25%。
併網延遲(3-6年)
全美範圍內,資料中心電力需求的等候名單超過2600吉瓦,核准時間中位數為五年。光是維吉尼亞北部一家Dominion Energy公司就有47吉瓦的資料中心電力需求待核准。亞利桑那州公共服務公司在2024年底凍結了新建資料中心的電力接入申請,並將專案轉移到德克薩斯州和俄亥俄州。開發商擴大投資建設現場調峰電站和小型模組化反應堆,儘管這將使每核子反應爐成本增加300萬至500萬美元,但這些措施可以緩解等待名單帶來的風險。同時,計劃於2027年實施的聯邦能源監管委員會(FERC)改革旨在簡化核准流程。
細分市場分析
到2025年,Tier 3資料中心將佔據56.43%的市場。與Tier 4資料中心相比,Tier 3資料中心成本可節省20-30%,且具有較高的同步維護能力,因此備受青睞。然而,容錯型Tier 4資料中心正以9.12%的複合年成長率成長,是美國資料中心建設市場中成長率最高的。銀行、醫療機構和政府機構等租戶要求99.995%的運轉率,這促使託管服務提供商對Tier 3機房進行維修,使其配備雙路公用設施供電線路和2N配置的UPS不斷電系統機架。根據執行時間調查,到2024年,美國38%的建設項目將獲得Tier 4認證,高於2022年的29%。這一成長的原因之一是網路保險承保人的推動。
資料中心託管產業的領導者 Equinix 和 Digital Realty 正在逐步向其現有園區部署 Tier 4 級功能,以滿足高階工作負載的需求。同時,亞馬遜雲端服務 (AWS) 已將多個 Tier 4 級園區納入其價值 110 億美元的賓州項目,以支援 GovCloud 客戶。隨著越來越多的企業需要容錯託管服務,專注於冗餘電源路徑和液冷備援模組的承包商預計將佔據 Tier 4 相關支出的最大佔有率。
預計到2025年,裝置容量超過10兆瓦的超大規模資料中心園區將占美國資料中心建設總量的64.31%,年均成長率達9.45%,凸顯了其在美國資料中心建置市場的重要性。雲端服務供應商越來越傾向選擇100-200兆瓦的一體化規劃園區,因為與中型資料中心相比,此類園區在電力採購、模組化冷卻和人事費用的規模經濟效益可使每兆瓦成本降低高達40%。
功率範圍在 1 至 10 兆瓦之間的中型機房仍被混合託管用戶使用,但隨著工作負載向雲端轉移,其成長速度正在放緩。功率低於 1 兆瓦的小規模機房分為兩類:一類是正在退役的企業機房,另一類是正在興起的邊緣節點。寬頻補貼和 5G 覆蓋率的不斷提高,使得即使在二線城市和區域性都會區,建造邊緣機房也變得經濟可行。在這個細分市場,像 Mortenson 和 Balfour Beatty 這樣的模組化專家可以在 45 天內提供承包機房解決方案。
其他好處:
- Excel格式的市場預測(ME)表
- 3個月的分析師支持
目錄
第1章:引言
- 市場分析與定義的前提條件
- 分析範圍
第2章 分析方法
第3章執行摘要
第4章 市場狀況
- 市場概覽
- 市場促進因素
- 雲端運算、人工智慧和巨量資料正在推動工作負載的激增。
- 超大規模、自主建設的管道,產能超過10吉瓦
- 城域叢集中邊緣網路和5G網路的聚合
- 聯邦和州政府的稅收優惠
- 人工智慧最佳化的水冷維修正在推動維修投資。
- 現場小型核子反應爐(SMR)的批准正在加速待開發區專案的開發。
- 市場限制因素
- 主要都會區周邊地價飆漲
- 併網延遲(3-6年)
- 變壓器和開關設備供應鏈中的瓶頸
- 地方政府出於對環境、社會和治理(ESG)的考慮,暫停使用耗水量大的冷卻系統。
- 產業供應鏈分析
- 監理情勢
- 技術展望
- 波特五力分析
- 資料中心的關鍵統計數據
- 美國資料中心營運商列表(按兆瓦計)
- 美國即將啟動的主要資料中心專案清單(2025-2030 年)
- 美國資料中心建設中的資本支出與營運支出
- 美國資料中心電力吸收能力:(單位:兆瓦,2023-2024 年)
- 將人工智慧(AI)引入美國資料中心建設。
- 監理與合規框架
- 宏觀經濟因素對市場的影響
第5章 市場規模與成長預測
- 層級特定
- 一級和二級
- 三級
- 第四級
- 按資料中心規模
- 小規模
- 中號
- 大規模
- 超大規模
- 依資料中心類型
- 託管資料中心
- 超大規模資料中心業者雲端服務供應商/雲端服務供應商(CSP)
- 企業邊緣資料中心
- 透過基礎設施
- 電力基礎設施
- 配電解決方案
- 備用電源解決方案
- 機械基礎設施
- 冷卻系統
- 機架和機櫃
- 伺服器和儲存
- 其他機械基礎設施
- 總承包公司
- 服務:設計與諮詢、整合、支援與維護
- 電力基礎設施
第6章 競爭情勢
- 市場集中度
- 策略趨勢
- 市佔率分析
- 資料中心基礎設施投資:基於容量(兆瓦,2024-2030 年)
- 資料中心建置概覽(主要供應商清單)
- 公司簡介
- AECOM
- Turner Construction
- DPR Construction
- Holder Construction
- Skanska USA
- Whiting-Turner Contracting
- Jacobs Solutions
- Balfour Beatty US
- Gilbane Building Company
- Hensel Phelps
- McCarthy Building Companies
- Brasfield and Gorrie
- JE Dunn Construction
- Mortenson Construction
- Kiewit Corporation
- Fluor Corporation
- Corgan Associates(AEC)
- Black and Veatch
- QTS Construction Services
- PowerHouse Data Centers(Tener Technologies)
- 資料中心建設公司列表
第7章 市場機會與未來展望
According to Mordor Intelligence, the United States (US) data center construction market size was valued at USD 14.35 billion in 2025 and is estimated to grow from USD 15.51 billion in 2026 to reach USD 23.74 billion by 2031, at a CAGR of 8.89% during the forecast period (2026-2031).
This report is Segmented by Tier Type (Tier 1 and 2, Tier 3, and Tier 4), Data Center Size (Small, Medium, Large, and Hyperscale), Data Center Type (Colocation, Hyperscalers/Cloud Service Providers, and Enterprise and Edge), Infrastructure (Electrical, Mechanical, General Construction, and Services). The Market Forecasts are Provided in Terms of Value (USD).
United States Data Center Construction Market Trends and Insights
Cloud, AI and Big-Data Workload Boom
Generative AI inference clusters have doubled average rack loads, pushing design densities to 15 kilowatts in 2026 and an expected 25 kilowatts by 2028. Operators are retrofitting rear-door heat exchangers and direct-to-chip loops, which add USD 1.5 million to USD 2 million per megawatt to budgets. Amazon Web Services committed USD 11 billion to Pennsylvania sites, and Microsoft reserved USD 80 billion globally for AI-optimized campuses, illustrating hyperscaler capital redeployment. With the United States hosting more than half of the world's hyperscale inventory, demand is bifurcating between 100-megawatt campuses for training and sub-1-megawatt edge nodes for low-latency inference.
Hyperscale Self-Build Pipelines Above 10 GW
Amazon Web Services, Microsoft Azure, Google Cloud, and Meta together hold over 10 gigawatts of active projects. Meta confirmed a USD 10 billion Louisiana campus, and Google added USD 1 billion in Texas expansion, signaling migration to secondary markets where land and utility interconnection costs are up to 60% lower than tier-1 hubs. Hyperscalers now self-perform civil work, hire specialists for mechanical and electrical scopes, and compress schedules from 24 months to 18 months, reducing general-contractor addressable value by roughly 25%.
Power-Grid Interconnection Delays (3-6 Years)
National queues exceed 2,600 gigawatts, stretching median approvals to five years. Dominion Energy alone lists 47 gigawatts of pending data-center load in Northern Virginia. Arizona Public Service froze new data-center hookups in late 2024, redirecting projects to Texas and Ohio. Developers are funding on-site peaker plants and small modular reactors that add USD 3 million to USD 5 million per megawatt but avoid queue risk, while Federal Energy Regulatory Commission reforms, slated for 2027, aim to streamline approvals.
Other drivers and restraints analyzed in the detailed report include:
- AI-Optimized Liquid-Cooling Retrofits Drive Rebuild Spend
- Edge and 5G Densification of Metro Clusters
- Transformer and Switch-Gear Supply-Chain Choke Points
For complete list of drivers and restraints, kindly check the Table Of Contents.
Segment Analysis
Tier 3 sites held 56.43% share in 2025, favored for concurrent maintainability at a 20%-30% cost discount versus Tier 4 designs. However, fault-tolerant Tier 4 builds are on track for a 9.12% CAGR, the fastest within the United States data center construction market size. Banking, healthcare, and government tenants demand 99.995% uptime, prompting colocation operators to retrofit Tier 3 halls with dual utility feeds and 2N uninterruptible power supply racks. Uptime Institute's 2024 survey showed 38% of U.S. builds sought Tier 4 certification, up from 29% in 2022, a jump driven partly by cyber-insurance underwriters.
Colocation leaders Equinix and Digital Realty are layering Tier 4 features onto existing campuses to secure premium workloads, while Amazon Web Services included multiple Tier 4 campuses in its USD 11 billion Pennsylvania program to support GovCloud clients. As more enterprises require fault-tolerant hosting, contractors focused on redundant electrical paths and liquid-cooled backup modules stand to gain the largest share of Tier 4 spending.
Hyperscale campuses above 10 megawatts controlled 64.31% of 2025 build volume and are projected to grow at 9.45% annually, underscoring their weight in the United States data center construction market. Economies of scale in power procurement, modular cooling, and labor reduce per-megawatt costs by as much as 40% against medium-sized halls, prompting cloud providers to favor 100-200 megawatt master-planned sites.
Medium facilities between 1 megawatt and 10 megawatts still serve hybrid colocation tenants but face slower growth as workloads shift to cloud. Small sub-1 megawatt facilities bifurcate into decommissioned enterprise rooms and rising edge nodes. Broadband subsidies and 5G densification make edge builds financially viable in tier-2 and rural metros, a niche where modular specialists like Mortenson and Balfour Beatty deliver turnkey enclosures in under 45 days.
Complete Report Scope:
- By Tier Type
- Tier 1 and 2
- Tier 3
- Tier 4
- By Data Center Size
- Small
- Medium
- Large
- Hyperscale
- By Data Center Type
- Colocation Data Center
- Hyperscalers/Cloud Service Provider (CSPs)
- Enterprise and Edge Data Center
- By Infrastructure
- Electrical Infrastructure
- Power Distribution Solution
- Power Backup Solutions
- Mechanical Infrastructure
- Cooling Systems
- Racks and Cabinets
- Servers and Storage
- Other Mechanical Infrastructure
- General Construction
- Services - Design and Consulting, Integration, Support and Maintenance
- Electrical Infrastructure
List of Companies Covered in this Report:
- AECOM
- Turner Construction
- DPR Construction
- Holder Construction
- Skanska USA
- Whiting-Turner Contracting
- Jacobs Solutions
- Balfour Beatty US
- Gilbane Building Company
- Hensel Phelps
- McCarthy Building Companies
- Brasfield and Gorrie
- JE Dunn Construction
- Mortenson Construction
- Kiewit Corporation
- Fluor Corporation
- Corgan Associates (AEC)
- Black and Veatch
- QTS Construction Services
- PowerHouse Data Centers (Tener Technologies)
Additional Benefits:
- The market estimate (ME) sheet in Excel format
- 3 months of analyst support
TABLE OF CONTENTS
1 INTRODUCTION
- 1.1 Study Assumptions and Market Definition
- 1.2 Scope of the Study
2 RESEARCH METHODOLOGY
3 EXECUTIVE SUMMARY
4 MARKET LANDSCAPE
- 4.1 Market Overview
- 4.2 Market Drivers
- 4.2.1 Cloud, AI and Big-Data Workload Boom
- 4.2.2 Hyperscale Self-Build Pipelines Above 10 GW
- 4.2.3 Edge and 5G Densification of Metro Clusters
- 4.2.4 Federal and State Tax-Incentive Packages
- 4.2.5 AI-Optimised Liquid-Cooling Retrofits Drive Rebuild Spend
- 4.2.6 On-Site Micro-Nuclear SMR Approvals Accelerate Greenfield Sites
- 4.3 Market Restraints
- 4.3.1 Soaring Land Prices Around Tier-1 Metros
- 4.3.2 Power-Grid Interconnection Delays (3-6 Years)
- 4.3.3 Transformer and Switch-Gear Supply-Chain Choke Points
- 4.3.4 ESG-Driven Municipal Moratoria on Water-Intensive Cooling
- 4.4 Industry Supply-Chain Analysis
- 4.5 Regulatory Landscape
- 4.6 Technological Outlook
- 4.7 Porter's Five Forces Analysis
- 4.7.1 Bargaining Power of Suppliers
- 4.7.2 Bargaining Power of Consumers
- 4.7.3 Threat of New Entrants
- 4.7.4 Threat of Substitutes
- 4.7.5 Intensity of Competitive Rivalry
- 4.8 Key Data Center Statistics
- 4.8.1 Exhaustive Data Center Operators in United States (in MW)
- 4.8.2 List of Major Upcoming Data Center Projects in United States (2025-2030)
- 4.8.3 CAPEX and OPEX For United States Data Center Construction
- 4.8.4 Data Center Power Capacity Absorption In MW, United States, 2023 and 2024
- 4.9 Artificial Intelligence (AI) Inclusion in Data Center Construction in United States
- 4.10 Regulatory and Compliance Framework
- 4.11 Impact of Macroeconomic Factors on the Market
5 MARKET SIZE AND GROWTH FORECASTS (VALUE)
- 5.1 By Tier Type
- 5.1.1 Tier 1 and 2
- 5.1.2 Tier 3
- 5.1.3 Tier 4
- 5.2 By Data Center Size
- 5.2.1 Small
- 5.2.2 Medium
- 5.2.3 Large
- 5.2.4 Hyperscale
- 5.3 By Data Center Type
- 5.3.1 Colocation Data Center
- 5.3.2 Hyperscalers/Cloud Service Provider (CSPs)
- 5.3.3 Enterprise and Edge Data Center
- 5.4 By Infrastructure
- 5.4.1 Electrical Infrastructure
- 5.4.1.1 Power Distribution Solution
- 5.4.1.2 Power Backup Solutions
- 5.4.2 Mechanical Infrastructure
- 5.4.2.1 Cooling Systems
- 5.4.2.2 Racks and Cabinets
- 5.4.2.3 Servers and Storage
- 5.4.2.4 Other Mechanical Infrastructure
- 5.4.3 General Construction
- 5.4.4 Services - Design and Consulting, Integration, Support and Maintenance
- 5.4.1 Electrical Infrastructure
6 COMPETITIVE LANDSCAPE
- 6.1 Market Concentration
- 6.2 Strategic Moves
- 6.3 Market Share Analysis
- 6.4 Data Center Infrastructure Investment Based on Megawatt (MW) Capacity, 2024 vs 2030
- 6.5 Data Center Construction Landscape (Key Vendors Listings)
- 6.6 Company Profiles (Includes Global Level Overview, Market Level Overview, Core Segments, Financials as Available, Strategic Information, Market Rank/Share, Products and Services, and Recent Developments)
- 6.6.1 AECOM
- 6.6.2 Turner Construction
- 6.6.3 DPR Construction
- 6.6.4 Holder Construction
- 6.6.5 Skanska USA
- 6.6.6 Whiting-Turner Contracting
- 6.6.7 Jacobs Solutions
- 6.6.8 Balfour Beatty US
- 6.6.9 Gilbane Building Company
- 6.6.10 Hensel Phelps
- 6.6.11 McCarthy Building Companies
- 6.6.12 Brasfield and Gorrie
- 6.6.13 JE Dunn Construction
- 6.6.14 Mortenson Construction
- 6.6.15 Kiewit Corporation
- 6.6.16 Fluor Corporation
- 6.6.17 Corgan Associates (AEC)
- 6.6.18 Black and Veatch
- 6.6.19 QTS Construction Services
- 6.6.20 PowerHouse Data Centers (Tener Technologies)
- 6.7 List of Data Center Construction Companies
7 MARKET OPPORTUNITIES AND FUTURE OUTLOOK
- 7.1 White-Space and Unmet-Need Assessment

 中東資料中心建置:市場佔有率分析、產業趨勢與統計及成長預測(2026-2032 年)亞太地區資料中心建置:市場佔有率分析、產業趨勢與統計及成長預測(2026-2031年)南美洲資料中心建置:市場佔有率分析、產業趨勢與統計及成長預測(2026-2031 年)德國資料中心建置:市場佔有率分析、產業趨勢與統計及成長預測(2026-2031 年)日本資料中心建置:市場佔有率分析、產業趨勢與統計及成長預測(2026-2032)歐洲資料中心建置:市場佔有率分析、產業趨勢與統計及成長預測(2026-2031 年)法國資料中心建置:市場佔有率分析、產業趨勢與統計及成長預測(2026-2031 年)泰國資料中心建置:市場佔有率分析、產業趨勢與統計及成長預測(2026-2031)義大利資料中心建置:市場佔有率分析、產業趨勢與統計及成長預測(2026-2031 年)英國資料中心建置:市場佔有率分析、產業趨勢與統計及成長預測(2026-2031 年)