


 |
市場調查報告書
商品編碼
2125686
歐洲資料中心建置:市場佔有率分析、產業趨勢與統計及成長預測(2026-2031 年)Europe Data Center Construction - Market Share Analysis, Industry Trends & Statistics, Growth Forecasts (2026 - 2031) |
||||||

※ 本網頁內容可能與最新版本有所差異。詳細情況請與我們聯繫。
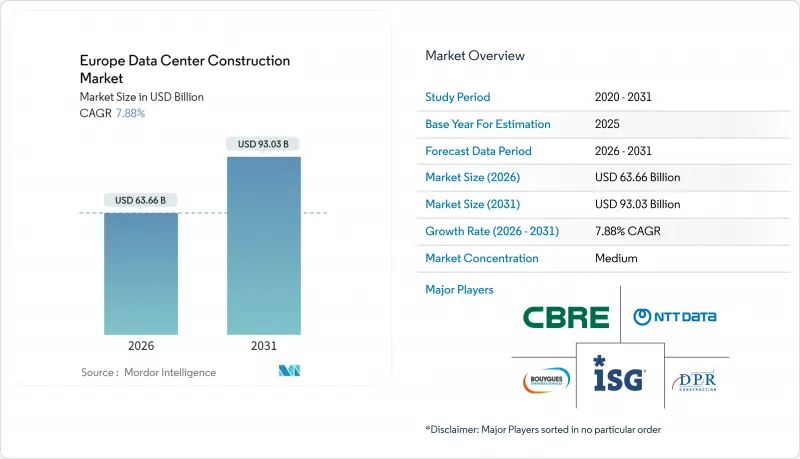
根據 Mordor Intelligence 預測,歐洲資料中心建設市場規模預計將在 2026 年達到 636.6 億美元,到 2031 年達到 930.3 億美元,在預測期內以 7.88% 的複合年成長率成長。
本報告按資料中心層級(一級、二級、三級、四級)、資料中心規模(小規模、中型、大型、超大規模)、資料中心類型(託管、超大規模資料中心業者/雲端服務供應商、企業級和邊緣運算)以及基礎設施(電氣、機械、一般建築和服務)進行細分。市場預測以美元計價。
歐洲資料中心建置市場趨勢與洞察
生成式人工智慧和巨量資料工作負載的成長
每個機架功耗高達 50-100 千瓦的 GPU叢集正在重新定義設計標準,促使營運商在大型園區部署水冷機架。微軟位於瑞典的設施在 2024 年實現了低於 1.2 的電源使用效率 (PUE),這是風冷無法達到的水平。尖端模型的訓練可以連續運行數週,推動了對 Tier 4 容錯架構的需求,儘管成本會增加 20-30%。無法在公共雲端中達到延遲目標的公司正在維修其本地部署環境,加速了對 N+2 冷卻迴路和 400 伏特不斷電系統(UPS) 的訂單。預計生成式 AI 工作負載將在本十年後半期佔據新增容量的很大一部分,從而推動採購趨勢轉向高密度伺服器機箱。這種轉變也促使人們更加關注電網容錯能力,對現場電池儲能以緩解訓練週期中的電壓下降越來越感興趣。
超大規模和託管設施的激增
超大規模業者正將負載整合到IT容量超過1吉瓦的多園區設施中,因此能夠以低於現貨價格的價格獲得大規模可再生能源購電協議。亞馬遜網路服務(AWS)耗資78億歐元的勃蘭登堡計畫橫跨三個站點,總合1.2吉瓦,並確保了長期電網配額。託管服務供應商正積極回應,推出「帶電機房」租賃協議,允許租戶整合自己的冷卻系統和網路架構。 Colt資料中心服務公司率先採用了這種模式,並於2024年在德國投資20億歐元(約24億美元)進行擴張。預計到2025年,交付的設施平均規模將從2020年的28兆瓦擴大到45兆瓦,這將增加對能夠大規模整合模組化機房的承包商的需求。規模經濟也使得園區區間冗餘方案得以實施,從而減少了過剩的備用容量。這些趨勢共同導致了馬德里和米蘭等二線都會區建設活動的增加。
不斷上漲的電力和房地產成本
2025年,德國和英國的工業用電價格平均為每千瓦時0.15至0.25歐元(0.18至0.30美元),這意味著一座10兆瓦、運轉率的發電廠,每年的電力成本將達到1190萬至1980萬美元。預計到2025年,法蘭克福的土地價格將超過每平方公尺1,200歐元,比2022年上漲40%。這是由於開發商競相搶購已連接現有電網的地塊。此外,英國的房產稅計算方法與重置成本掛鉤,這將使一座20兆瓦發電廠的建設每年額外增加1000萬至1500萬美元的稅負。這些壓力正促使投資流向成本較低的二線城市,而多年期可再生能源購電協議(PPA)在北歐國家越來越受歡迎,因為那裡的批發價格低於每千瓦時0.06歐元。此外,開發商擴大採用垂直資料中心和屋頂太陽能座艙罩來有效利用有限的用地面積,但這些措施會增加結構鋼材的使用量和初始投資成本。
細分市場分析
到2025年,三級資料中心將佔歐洲資料中心建設市場支出的57.14%,這反映了預算與運轉率之間的平衡。由於金融服務和政府租戶要求99.995%的可用性,分配給四級資料中心的歐洲建設市場正以8.42%的複合年成長率成長。容錯的2N+1冗餘消除了單點故障,這對於即時支付和國防指揮系統至關重要。由於停機造成的損失遠超過初始成本,營運商需要承擔20-30%的額外資本支出。雖然法蘭克福和倫敦對四級資料中心的需求最高,但電網容量的限制正促使專案轉向勃蘭登堡和威爾斯。模組化開關設備和熱插拔UPS撬裝設備正成為四級資料中心部署的標準配置,從而縮短了設計週期。雲端服務供應商正在嘗試採用混合設計,使用 Tier 4 電源和 Tier 3 冷卻,這體現了精細的風險分級策略。
到2025年,一級和二級資料中心建設在歐洲資料中心建設市場佔有率中將佔比不到10%,因為營運商已逐步淘汰非冗餘佈局。中小企業出於成本考慮,目前仍傾向於選擇三級託管機房,但不斷成長的人工智慧推理負載可能會暴露這些架構的局限性。歐洲保險公司正在對三級資料中心的停機時間收取額外保費,這加速了向更高等級資料中心的轉型。同時,歐盟強調關鍵基礎設施容錯性的分類法規正推動資金籌措轉向四級資料中心債券。供應商也積極回應,提供預先認證的四級資料中心套件,將試運行週期縮短至20個月以內。因此,人工智慧密度與運作風險之間的相互作用正在推動向四級資料中心的轉型。
至2025年,超大規模資料中心園區將佔歐洲資料中心建置市場的60.75%,預計2031年將以8.23%的複合年成長率成長。容量從50兆瓦到250兆瓦不等的設施使營運商能夠協商數吉瓦級的可再生能源購電協議(PPA),從而平滑能源成本曲線。超大規模設施在歐洲資料中心建設市場的佔有率尤其受益於電力外殼和熱交換器採購整合帶來的經濟優勢。勃蘭登堡州、格羅寧根州和韋斯特羅斯州是交易中心,地方政府正在加快大規模可再生能源併網的核准流程。投資者重視超大規模設施與主要租戶簽訂的租賃協議所產生的可預測現金流,與小規模設施相比,這些協議降低了加權平均資本成本(WACC)。
大型(10-50兆瓦)和中型(2-10兆瓦)設施在區域聚合網路中繼續發揮至關重要的作用,它們不僅為邊緣節點供電,還能提供突發容量。在城市中心,容量小於2兆瓦的邊緣和微型邊緣站點正在迅速增加,以確保自動駕駛車輛和工業IoT遙測的延遲低於20毫秒。可安裝在零售園區停車場的預製貨櫃模組將建造時間縮短至12-18個月。超大規模專案的平均規模正從2020年的28兆瓦擴大到2025年的45兆瓦,隨著晶片藍圖不斷提高發熱量上限,預計這一趨勢還將持續。谷歌位於格羅寧根的園區,其建成後的總裝置容量將達到200兆瓦,正是這一趨勢的鮮明例子。
其他好處:
- Excel格式的市場預測(ME)表
- 3個月的分析師支持
目錄
第1章:引言
- 研究假設和市場定義
- 調查範圍
第2章:調查方法
第3章執行摘要
第4章 市場狀況
- 市場概覽
- 市場促進因素
- 生成式人工智慧和巨量資料帶來的工作量增加
- 超大規模和託管設施的激增
- 雲端服務供應商的區域擴張
- 歐盟綠色交易下的廢熱再利用獎勵措施
- 北歐國家的可再生能源購電協議正在降低總擁有成本(TCO)。
- 預製模組化電源室的引入
- 市場限制因素
- 不斷上漲的電力和房地產成本
- 併網核准流程中的瓶頸
- 歐盟對非綠色材料實施更嚴格的分類標準
- 先進試運行領域熟練勞動力短缺
- 產業供應鏈分析
- 監理情勢
- 技術展望
- 波特五力分析
- 資料中心的關鍵統計數據
- 歐洲資料中心營運商列表(每兆瓦)
- 歐洲主要資料中心項目清單(2025-2030 年)
- 歐洲資料中心建設中的資本支出和營運支出
- 2023年及2024年歐洲主要城市資料中心的電力吸收能力(兆瓦)
- 人工智慧(AI)在歐洲資料中心建置的應用
- 監理與合規框架
- 宏觀經濟因素對市場的影響
第5章 市場規模與成長預測
- 層級特定
- 一級和二級
- 三級
- 第四級
- 按資料中心規模
- 小規模
- 中等的
- 大規模
- 超大規模
- 依資料中心類型
- 託管資料中心
- 超大規模資料中心業者雲端服務供應商/雲端服務供應商(CSP)
- 企業和邊緣資料中心
- 透過基礎設施
- 電力基礎設施
- 配電解決方案
- 備用電源解決方案
- 機械基礎設施
- 冷卻系統
- 機架和機櫃
- 伺服器和儲存
- 其他機械基礎設施
- 一般建築
- 服務 - 設計與諮詢、整合、支援與維護
- 電力基礎設施
- 國家
- 德國
- 英國
- 法國
- 義大利
- 西班牙
- 其他歐洲國家
第6章 競爭情勢
- 市場集中度
- 策略趨勢
- 市佔率分析
- Data Center Infrastructure Investment Based on Megawatt(MW)Capacity, 2024 vs 2030
- Data Center Construction Landscape(Key Vendors Listings)
- 公司簡介
- AECOM
- NTT Ltd.
- Rider Levett Bucknall LLP
- The Whiting-Turner Contracting Co.
- Jacobs Solutions Inc.
- DPR Construction
- Collen Construction Ltd.
- Mercury Engineering Unlimited Co.
- Hensel Phelps Construction Co.
- Hochtief AG
- Gilbane Building Co.
- Vinci Construction
- Clune Construction Co. LP
- Bouygues Energies and Services SAS
- CBRE Group Inc.
- Fluor Corp.
- ISG plc
- Skanska AB
- Arup Group Ltd.
- Lendlease Corporation Ltd.
- List of Data Center Construction Companies
第7章 市場機會與未來展望
According to Mordor Intelligence, the Europe data center construction market size stands at USD 63.66 billion in 2026 and is projected to reach USD 93.03 billion by 2031, advancing at a 7.88% CAGR over the forecast period.
This report is Segmented by Tier Type (Tier 1 and 2, Tier 3, and Tier 4), Data Center Size (Small, Medium, Large, and Hyperscale), Data Center Type (Colocation, Hyperscalers/Cloud Service Providers, and Enterprise and Edge), Infrastructure (Electrical, Mechanical, General Construction, and Services). The Market Forecasts are Provided in Terms of Value (USD).
Europe Data Center Construction Market Trends and Insights
Rising Generative-AI and Big-Data Workloads
GPU clusters that draw 50-100 kilowatts per rack are redefining design baselines, prompting operators to deploy liquid-cooled racks across flagship campuses. Microsoft's Swedish facilities reached power-usage-effectiveness ratios below 1.2 in 2024, a threshold unattainable with air cooling. Training runs for frontier models run uninterrupted for weeks, pushing demand for Tier 4 fault-tolerant architectures despite a 20-30% cost premium. Enterprises that cannot meet latency targets in public clouds are retrofitting on-premises sites, accelerating orders for N+2 cooling loops and 400-volt uninterruptible power supplies. Generative-AI workloads are expected to dominate incremental capacity additions late in the decade, reshaping procurement toward high-density server enclosures. The shift also sharpens focus on grid resiliency, driving interest in on-site battery storage to mitigate brownouts during training cycles.
Surge in Hyperscale and Colocation Build-Outs
Hyperscale operators are consolidating loads into multi-campus estates that clear 1 gigawatt of IT capacity, enabling bulk renewable power purchase agreements at below-spot pricing. Amazon Web Services' EUR 7.8 billion Brandenburg program spans three sites totaling 1.2 gigawatts, locking in long-term grid reservations. Colocation specialists respond with powered-shell leases that let tenants fit bespoke cooling and network fabrics, a model Colt Data Centre Services advanced through EUR 2 billion (USD 2.4 billion) in German expansions in 2024. Average facility size for 2025 deliveries rose to 45 megawatts, up from 28 megawatts in 2020, intensifying demand for contractors capable of integrating modular power rooms at scale. The economies of scale also unlock cross-campus redundancy schemes, trimming reserve-capacity over-provisioning. These dynamics collectively boost construction intensity even in secondary metros such as Madrid and Milan.
Escalating Power and Real-Estate Costs
Industrial electricity in Germany and the United Kingdom averaged EUR 0.15-0.25 (USD 0.18-0.30) per kilowatt-hour in 2025, translating into USD 11.9-19.8 million in annual power costs for a 10-megawatt site operating at 80% utilization. Frankfurt land crossed EUR 1,200 per square meter in 2025, up 40% from 2022, as operators chase parcels with pre-existing grid access. The United Kingdom's property tax formula, pegged to replacement cost, adds USD 10-15 million per year to a 20-megawatt build. These pressures divert investment toward lower-cost secondary metros and drive the popularity of multi-year renewable PPAs in the Nordics, where wholesale rates sit below EUR 0.06 per kilowatt-hour. Developers are also pivoting to vertical data halls and rooftop solar canopies to stretch constrained footprints, though such adaptations increase structural steel tonnage and upfront capital costs.
Other drivers and restraints analyzed in the detailed report include:
- Cloud Service Provider Regional Expansion
- EU Green Deal Waste-Heat Reuse Incentives
- Grid-Connection Approval Bottlenecks
For complete list of drivers and restraints, kindly check the Table Of Contents.
Segment Analysis
Tier 3 captured 57.14% of Europe data center construction market spending in 2025, reflecting its balance between budget and uptime. Europe data center construction market size allocated to Tier 4 is growing at an 8.42% CAGR as financial services and government tenants press for 99.995% availability. Fault-tolerant 2N+1 redundancy eliminates single points of failure, a prerequisite for instant-settlement payment rails and defense command systems. Operators absorb the 20-30% capex premium because downtime penalties far outweigh initial costs. Frankfurt and London see the heaviest Tier 4 demand, though grid capacity constraints are redirecting projects to Brandenburg and Wales. Modular switchgear and hot-swappable UPS skids are standardizing Tier 4 deployments, trimming engineering cycles. Cloud providers experimenting with hybrid designs - Tier 4 for power and Tier 3 for cooling - reflect a nuanced risk-tiering strategy.
Tier 1 and Tier 2 builds fell below 10% of Europe data center construction market share in 2025 as operators abandon non-redundant layouts. Small and medium enterprises still accept Tier 3 colocation suites on cost grounds, but rising AI inference loads may stretch those architectures. European insurers are adding premium surcharges for Tier 3 outages, accelerating migration to higher tiers. Meanwhile, EU taxonomy rules favoring fault tolerance for critical infrastructure tilt financing toward Tier 4 bonds. Component vendors respond with pre-certified Tier 4 kits, compressing commissioning to under 20 months. The interplay between generative-AI density and uptime risk thus reinforces the Tier 4 trajectory.
Hyperscale campuses secured 60.75% of Europe data center construction market size in 2025, advancing at an 8.23% CAGR through 2031. Facilities in the 50-250 megawatt bracket let operators bargain for multi-gigawatt renewable PPAs, smoothing energy cost curves. Europe data center construction market share for hyperscale builds benefits from consolidation economies, particularly in power shell and heat-exchanger procurement. Brandenburg, Groningen, and Vasteras headline deal flow, where local governments fast-track permits for large-scale renewable integrations. Investors prize the predictable cash flows of hyperscale anchor leases, lowering weighted average cost of capital against smaller formats.
Large (10-50 megawatt) and medium (2-10 megawatt) facilities retain a role in regional aggregation networks, feeding edge nodes while providing burst capacity. Edge and micro-edge sites under 2 megawatts proliferate in urban cores to guarantee sub-20-millisecond latency for autonomous vehicles and industrial-IoT telemetry. Prefabricated container modules, deployable on retail-park car lots, compress construction to 12-18 months. Average hyperscale project scope climbed from 28 megawatts in 2020 to 45 megawatts in 2025, a trend likely to continue as chip roadmaps push thermal envelopes upward. Google's Groningen campus targets 200 megawatts at full build, illustrating the trajectory.
Complete Report Scope:
- By Tier Type
- Tier 1 and 2
- Tier 3
- Tier 4
- By Data Center Size
- Small
- Medium
- Large
- Hyperscale
- By Data Center Type
- Colocation Data Center
- Hyperscalers/Cloud Service Provider (CSPs)
- Enterprise and Edge Data Center
- By Infrastructure
- Electrical Infrastructure
- Power Distribution Solution
- Power Backup Solutions
- Mechanical Infrastructure
- Cooling Systems
- Racks and Cabinets
- Servers and Storage
- Other Mechanical Infrastructure
- General Construction
- Services - Design and Consulting, Integration, Support and Maintenance
- Electrical Infrastructure
- By Country
- Germany
- United Kingdom
- France
- Italy
- Spain
- Rest of Europe
List of Companies Covered in this Report:
- AECOM
- NTT Ltd.
- Rider Levett Bucknall LLP
- The Whiting-Turner Contracting Co.
- Jacobs Solutions Inc.
- DPR Construction
- Collen Construction Ltd.
- Mercury Engineering Unlimited Co.
- Hensel Phelps Construction Co.
- Hochtief AG
- Gilbane Building Co.
- Vinci Construction
- Clune Construction Co. LP
- Bouygues Energies and Services SAS
- CBRE Group Inc.
- Fluor Corp.
- ISG plc
- Skanska AB
- Arup Group Ltd.
- Lendlease Corporation Ltd.
Additional Benefits:
- The market estimate (ME) sheet in Excel format
- 3 months of analyst support
TABLE OF CONTENTS
1 INTRODUCTION
- 1.1 Study Assumptions and Market Definition
- 1.2 Scope of the Study
2 RESEARCH METHODOLOGY
3 EXECUTIVE SUMMARY
4 MARKET LANDSCAPE
- 4.1 Market Overview
- 4.2 Market Drivers
- 4.2.1 Rising Generative-AI and Big-Data Workloads
- 4.2.2 Surge in Hyperscale and Colocation Build-Outs
- 4.2.3 Cloud Service Provider Regional Expansion
- 4.2.4 EU Green Deal Waste-Heat Reuse Incentives
- 4.2.5 Nordic Renewable-Energy PPAs Lowering TCO
- 4.2.6 Prefabricated Modular Power Rooms Adoption
- 4.3 Market Restraints
- 4.3.1 Escalating Power and Real-Estate Costs
- 4.3.2 Grid-Connection Approval Bottlenecks
- 4.3.3 Stricter EU Taxonomy on Non-Green Materials
- 4.3.4 Skilled-Labour Gap for Advanced Commissioning
- 4.4 Industry Supply-Chain Analysis
- 4.5 Regulatory Landscape
- 4.6 Technological Outlook
- 4.7 Porter's Five Forces Analysis
- 4.7.1 Bargaining Power of Suppliers
- 4.7.2 Bargaining Power of Consumers
- 4.7.3 Threat of New Entrants
- 4.7.4 Threat of Substitutes
- 4.7.5 Intensity of Competitive Rivalry
- 4.8 Key Data Center Statistics
- 4.8.1 Exhaustive Data Center Operators in Europe (in MW)
- 4.8.2 List of Major Upcoming Data Center Projects in Europe (2025-2030)
- 4.8.3 CAPEX and OPEX For Europe Data Center Construction
- 4.8.4 Data Center Power Capacity Absorption In MW, Selected Cities, Europe, 2023 and 2024
- 4.9 Artificial Intelligence (AI) Inclusion in Data Center Construction in Europe
- 4.10 Regulatory and Compliance Framework
- 4.11 Impact of Macroeconomic Factors on the Market
5 MARKET SIZE AND GROWTH FORECASTS (VALUE)
- 5.1 By Tier Type
- 5.1.1 Tier 1 and 2
- 5.1.2 Tier 3
- 5.1.3 Tier 4
- 5.2 By Data Center Size
- 5.2.1 Small
- 5.2.2 Medium
- 5.2.3 Large
- 5.2.4 Hyperscale
- 5.3 By Data Center Type
- 5.3.1 Colocation Data Center
- 5.3.2 Hyperscalers/Cloud Service Provider (CSPs)
- 5.3.3 Enterprise and Edge Data Center
- 5.4 By Infrastructure
- 5.4.1 Electrical Infrastructure
- 5.4.1.1 Power Distribution Solution
- 5.4.1.2 Power Backup Solutions
- 5.4.2 Mechanical Infrastructure
- 5.4.2.1 Cooling Systems
- 5.4.2.2 Racks and Cabinets
- 5.4.2.3 Servers and Storage
- 5.4.2.4 Other Mechanical Infrastructure
- 5.4.3 General Construction
- 5.4.4 Services - Design and Consulting, Integration, Support and Maintenance
- 5.4.1 Electrical Infrastructure
- 5.5 By Country
- 5.5.1 Germany
- 5.5.2 United Kingdom
- 5.5.3 France
- 5.5.4 Italy
- 5.5.5 Spain
- 5.5.6 Rest of Europe
6 COMPETITIVE LANDSCAPE
- 6.1 Market Concentration
- 6.2 Strategic Moves
- 6.3 Market Share Analysis
- 6.4 Data Center Infrastructure Investment Based on Megawatt (MW) Capacity, 2024 vs 2030
- 6.5 Data Center Construction Landscape (Key Vendors Listings)
- 6.6 Company Profiles (includes Global Level Overview, Market Level Overview, Core Segments, Financials as Available, Strategic Information, Market Rank/Share for Key Companies, Products and Services, Recent Developments)
- 6.6.1 AECOM
- 6.6.2 NTT Ltd.
- 6.6.3 Rider Levett Bucknall LLP
- 6.6.4 The Whiting-Turner Contracting Co.
- 6.6.5 Jacobs Solutions Inc.
- 6.6.6 DPR Construction
- 6.6.7 Collen Construction Ltd.
- 6.6.8 Mercury Engineering Unlimited Co.
- 6.6.9 Hensel Phelps Construction Co.
- 6.6.10 Hochtief AG
- 6.6.11 Gilbane Building Co.
- 6.6.12 Vinci Construction
- 6.6.13 Clune Construction Co. LP
- 6.6.14 Bouygues Energies and Services SAS
- 6.6.15 CBRE Group Inc.
- 6.6.16 Fluor Corp.
- 6.6.17 ISG plc
- 6.6.18 Skanska AB
- 6.6.19 Arup Group Ltd.
- 6.6.20 Lendlease Corporation Ltd.
- 6.7 List of Data Center Construction Companies
7 MARKET OPPORTUNITIES AND FUTURE OUTLOOK
- 7.1 White-Space and Unmet-Need Assessment

 中東資料中心建置:市場佔有率分析、產業趨勢與統計及成長預測(2026-2032 年)亞太地區資料中心建置:市場佔有率分析、產業趨勢與統計及成長預測(2026-2031年)南美洲資料中心建置:市場佔有率分析、產業趨勢與統計及成長預測(2026-2031 年)德國資料中心建置:市場佔有率分析、產業趨勢與統計及成長預測(2026-2031 年)日本資料中心建置:市場佔有率分析、產業趨勢與統計及成長預測(2026-2032)法國資料中心建置:市場佔有率分析、產業趨勢與統計及成長預測(2026-2031 年)泰國資料中心建置:市場佔有率分析、產業趨勢與統計及成長預測(2026-2031)義大利資料中心建置:市場佔有率分析、產業趨勢與統計及成長預測(2026-2031 年)英國資料中心建置:市場佔有率分析、產業趨勢與統計及成長預測(2026-2031 年)越南資料中心建設:市場佔有率分析、產業趨勢與統計及成長預測(2026-2031年)