


 |
市場調查報告書
商品編碼
2125673
亞太地區資料中心建置:市場佔有率分析、產業趨勢與統計及成長預測(2026-2031年)APAC Data Center Construction - Market Share Analysis, Industry Trends & Statistics, Growth Forecasts (2026 - 2031) |
||||||

※ 本網頁內容可能與最新版本有所差異。詳細情況請與我們聯繫。
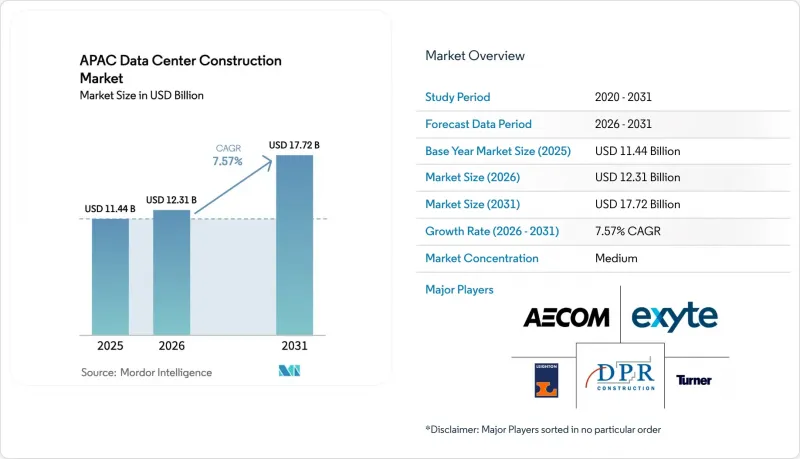
預計亞太地區資料中心建設市場規模將從 2025 年的 114.4 億美元成長到 2031 年的 177.2 億美元,到 2026 年將達到 123.1 億美元。
預計從 2026 年到 2031 年,其複合年成長率將達到 7.57%。
本報告按基礎設施(電力基礎設施、機械基礎設施、一般建築)、等級(一級和二級、三級、四級)以及資料中心類型(託管、超大規模資料中心業者(CSP) 的現場建設等)對產業進行細分。以上所有細分市場的規模和預測均以百萬美元為單位。
亞太地區資料中心建置市場趨勢及洞察。
超大規模和人工智慧驅動對高密度園區的需求。
亞太地區的營運商正在重新設計佈局,以容納40-80kW的機架——是傳統標準的三倍——從而大規模訓練生成式人工智慧模型。韓國和日本的園區設計已經明確規定了千兆瓦級的公用電力供應和晶片直接液冷技術。超大規模資料中心業者從延遲和安全性的角度出發,認為電力、網路和散熱環境管理至關重要,這促使設計和施工公司推廣採用模組化預製電氣室,從而顯著縮短部署時間。資金流動也反映了這一轉變,SK Telecom計劃到2028年為人工智慧基礎設施投入3.4兆韓元。設備供應商正積極回應,推出GPU最佳化的開關設備和液冷式伺服器底盤,半導體供應商和建築承包商的合作也日益緊密。
政府大力推動數位經濟和5G技術發展
中國的「東方數據,西方計算」計畫和日本的半導體和數位產業藍圖等政策都設定了與國家運算能力相關的明確建設目標。光是北京一項舉措就已投入4,000億至5,000億元人民幣,計畫在2030年建成8個國家級資料中心及10個區域叢集。越南也有一項類似的法律,要求從2025年7月起建立具備綜合風險評估功能的“國家資料中心”,該法律一經頒布便立即啟動了競標活動。同時,5G在全國範圍內的部署提高了對邊緣節點的需求,電信業者正在租賃或共同開發與通訊塔基礎設施配套的微型設施,以降低用戶平面延遲。
數據主權合規障礙
中國和越南新的跨境資料傳輸法規加重了營運商的法律和技術負擔,要求他們進行風險評估並任命資料安全官。由於缺乏統一的「關鍵數據」定義,跨國雲端平台不得不逐國複製其基礎設施。重複的歸檔系統導致企業營運成本增加15%至20%,並且在建造階段的設計中必須預留額外的空間來容納特定國家/地區的隔離籠。
細分市場分析
到2025年,Tier 3資料中心將佔亞太地區資料中心建置市場70.45%的佔有率,證明了其在大多數企業和雲端應用場景中的成本效益。然而,由於超大規模人工智慧訓練需要故障安全冗餘,Tier 4資料中心的容量預計到2031年將以10.67%的複合年成長率成長。韓國和日本是亞太地區資料中心建設市場中Tier 4資料中心市場佔有率成長最快的國家。這些國家正在部署多千兆次浮點叢集,並行維護至關重要。營運商願意接受約40-60%的資本支出溢價,因為合約條款保證了99.995%的運轉率。這是透過GPU租賃確保收入來源的先決條件。 Uptime Institute認證正成為一項競爭優勢。雪梨一座獲得NEXTDC認證的Tier 4資料中心就展示了基於審計的認證如何轉化為更高的定價。同時,中國和澳洲的一些合約也規定了額外的「Tier 4 Plus」要求,例如由獨立變電站提供的雙路電源。雖然Tier 1和Tier 2設施仍然適用於邊緣運算和工業IoT節點,但隨著企業續約託管合約併升級到更高容錯等級,它們的重要性正在降低。
即使到了2025年,託管服務仍將佔據亞太地區資料中心建置市場佔有率的54.62%,這主要得益於金融服務和遊戲產業租戶對營運商中立互聯的需求。然而,亞馬遜、Google、微軟和阿里巴巴等公司自建資料中心的趨勢預計將推動自營園區在2031年前實現12.05%的複合年成長率。在亞太地區資料中心建設市場,澳洲的自建專案規模正在迅速擴張,光是AWS一家公司就累計在2025年至2029年間投入200億澳元用於新增容量。
隨著超大規模資料中心業者資料中心營運商不斷購置自有房地產,現有託管服務供應商正積極應對,集中資源於服務不足的大都會圈,並提供多層級的託管人工智慧平台服務。 ST Telemedia Global Data Centers 正在印度投資 32 億美元建造一個 550 兆瓦的資料中心項目,計劃將現有機房改造為承包GPU 擴展艙。面向邊緣運算和企業的微型資料中心也在發展,但成長放緩,這主要得益於 5G 技術的進步以及企業向混合雲端的轉型。
其他好處:
- Excel格式的市場預測(ME)表
- 3個月的分析師支持
目錄
第1章:引言
- 研究假設和市場定義
- 調查範圍
第2章:調查方法
第3章執行摘要
第4章 市場狀況
- 市場概覽
- 市場促進因素
- 超大規模和人工智慧驅動對高密度園區的需求。
- 政府大力推動數位經濟和5G技術發展
- 與永續發展掛鉤的綠色金融
- 新加坡向柔佛和巴淡島的移民潮蔓延開來
- Edge DC將在新的海底電纜登陸點建造設施
- 中國內陸省份在土地和電力方面享有優惠待遇
- 市場限制因素
- 與資料主權相關的合規性挑戰
- 主要大都會圈的電網瓶頸
- 地震多發地區的保險費
- 水冷技術領域人員短缺
- 價值供應鏈分析
- 監理情勢
- 技術展望
- 波特五力模型
第5章 資料中心關鍵統計數據
- 亞太地區資料中心營運商列表(單位:兆瓦)
- 亞太地區主要資料中心項目清單(2025-2030 年)
- 亞太地區資料中心建置的資本支出和營運支出
- 2023 年和 2024 年亞太地區主要城市資料中心的電力吸收能力(兆瓦)。
第6章:將人工智慧(AI)引入亞太地區的資料中心建設
第7章 監理與合規框架
第8章 市場規模與成長預測
- 層級特定
- 一級和二級
- 三級
- 第四級
- 依資料中心類型
- 搭配
- 內部建置的超大規模資料中心業者(CSP)
- 企業和邊緣運算
- 透過基礎設施
- 透過電力基礎設施
- 配電解決方案
- 備用電源解決方案
- 透過機械基礎設施
- 冷卻系統
- 機架和機櫃
- 伺服器和儲存
- 其他機械基礎設施
- 一般建築
- 服務 - 設計與諮詢、整合、支援與維護
- 透過電力基礎設施
第9章 競爭情勢
- 市場集中度
- 策略趨勢
- 市佔率分析
- Data Center Infrastructure Investment Based on Megawatt(MW)Capacity, 2024 vs 2030
- Data Center Construction Landscape(Key Vendors Listings)
- 公司簡介
- AECOM
- DPR Construction Inc.
- Fortis Construction Inc.
- Goodman Group
- Hibiya Engineering Ltd.
- Larsen and Toubro Limited
- GIC Private Limited
- Sino Group
- Citramas Group
- Aurecon Group Pty Ltd
- Turner Construction Company
- Jacobs Solutions Inc.
- Exyte GmbH
- Leighton Asia(CIMIC Group)
- Gamuda Berhad
- YTL Power International Berhad
- China Communications Services Corp. Ltd.
- ST Telemedia Global Data Centres
- Chindata Group Holdings Ltd.
- ST Engineering-Digital Systems
第10章 市場機會與未來展望
- 評估閒置頻段和未滿足的需求
According to Mordor Intelligence, the Asia Pacific data center construction market size in 2026 is estimated at USD 12.31 billion, growing from 2025 value of USD 11.44 billion with 2031 projections showing USD 17.72 billion, growing at 7.57% CAGR over 2026-2031.
This report Segments the Industry Into Infrastructure (By Electrical Infrastructure, by Mechanical Infrastructure, General Construction), by Tier Type (Tier 1 and 2, Tier 3, Tier 4), by Data Center Type (Colocation, Self-Built Hyperscalers (CSPs) and More). The Market Sizes and Forecasts are Provided in Terms of Value (USD Million) for all the Above Segments.
APAC Data Center Construction Market Trends and Insights
Hyperscale and AI demand for high-density campuses
Asia Pacific operators are re-engineering layouts to host 40-80 kW racks, triple traditional thresholds, in order to run generative-AI model training at scale. South Korean and Japanese campus blueprints already stipulate multi-gigawatt utility feeds and direct-to-chip liquid cooling. Hyperscalers view control of power, network, and thermal environments as non-negotiable for latency and security, pushing design-build firms toward modular, prefabricated electrical rooms that slash deployment timelines. Capital flows mirror this shift; SK Telecom has earmarked KRW 3.4 trillion for AI infrastructure through 2028. Equipment vendors are responding with GPU-optimized switchgear and immersion-ready server chassis, tightening collaboration between silicon suppliers and construction contractors.
Government digital-economy and 5G push
Mandates such as China's Eastern Data Western Compute program and Japan's semiconductor and digital-industry roadmap are creating explicit build targets tied to sovereign compute capacity. Beijing's initiative alone is mobilizing 400-500 billion RMB to deploy eight national hubs and ten regional clusters by 2030. Similar laws in Vietnam require a National Data Centre with integrated risk-assessment functions beginning July 2025, immediately translating into tender activity. Parallel nationwide 5G rollouts elevate edge-node requirements, with telecom carriers leasing or co-developing micro-facilities alongside tower infrastructure to lower user-plane latency.
Data-sovereignty compliance hurdles
New cross-border transfer rules in China and Vietnam obligate operators to perform risk assessments and appoint data-security officers, increasing both legal and technical overhead. The absence of a unified definition for "important data" forces multinational cloud platforms to replicate infrastructure country by country. Enterprises are incurring 15-20% incremental operating expense for duplicate archival systems, while construction-stage design must allocate extra white-space for nation-specific cage segregation.
Other drivers and restraints analyzed in the detailed report include:
- Sustainability-linked green financing
- Edge DC builds at new submarine-cable landings
- Power-grid bottlenecks in tier-1 metros
For complete list of drivers and restraints, kindly check the Table Of Contents.
Segment Analysis
Tier 3 sites accounted for 70.45% of the Asia Pacific data center construction market in 2025, validating their cost-efficiency for most enterprise and cloud use cases. Yet hyperscale AI training demands fail-safe redundancy; therefore Tier 4 capacity is set to register an 10.67% CAGR through 2031. The Asia Pacific data center construction market size for Tier 4 builds is rising fastest in South Korea and Japan where multi-petaflop clusters mandate concurrent maintainability. Operators accept an estimated 40-60% capex premium because contract clauses guarantee 99.995% uptime, a pre-condition for GPU leasing revenue streams. Uptime Institute certifications are becoming competitive differentiators. NEXTDC's accredited Tier IV Sydney campus illustrates how audit-based credentials secure premium pricing. Simultaneously, some Chinese and Australian contracts specify "Tier 4-plus" add-ons such as dual utility feeds from separate substations. Although Tier 1 and Tier 2 footprints persist for edge or industrial IoT nodes, their relevance is shrinking as enterprise colocation renewals migrate to higher resilience tiers.
Colocation still held 54.62% of the Asia Pacific data center construction market share in 2025, buoyed by financial-services and gaming tenants seeking carrier-neutral interconnect. Nevertheless, the self-build trajectory of Amazon, Google, Microsoft, and Alibaba underpins a 12.05% CAGR for owner-operated campuses to 2031. The Asia Pacific data center construction market size for self-build projects has escalated in Australia where AWS alone earmarked AUD 20 billion for new capacity between 2025 and 2029.
As hyperscalers internalize real estate, colocation incumbents respond by clustering in under-served metros and layering managed AI-platform services. ST Telemedia Global Data Centres will inject USD 3.2 billion into 550 MW of India builds, repackaging halls as turnkey GPU-pods. Edge and enterprise micro-sites also grow but at a measured clip, hinging on 5G densification and corporate hybrid-cloud preferences.
Complete Report Scope:
- By Tier Type
- Tier 1 and 2
- Tier 3
- Tier 4
- By Data Center Type
- Colocation
- Self-build Hyperscalers (CSPs)
- Enterprise and Edge
- By Infrastructure
- By Electrical Infrastructure
- Power Distribution Solution
- Power Backup Solutions
- By Mechanical Infrastructure
- Cooling Systems
- Racks and Cabinets
- Servers and Storage
- Other Mechanical Infrastructure
- General Construction
- Service - Design and Consulting, Integration, Support and Maintenance
- By Electrical Infrastructure
List of Companies Covered in this Report:
- AECOM
- DPR Construction Inc.
- Fortis Construction Inc.
- Goodman Group
- Hibiya Engineering Ltd.
- Larsen and Toubro Limited
- GIC Private Limited
- Sino Group
- Citramas Group
- Aurecon Group Pty Ltd
- Turner Construction Company
- Jacobs Solutions Inc.
- Exyte GmbH
- Leighton Asia (CIMIC Group)
- Gamuda Berhad
- YTL Power International Berhad
- China Communications Services Corp. Ltd.
- ST Telemedia Global Data Centres
- Chindata Group Holdings Ltd.
- ST Engineering - Digital Systems
Additional Benefits:
- The market estimate (ME) sheet in Excel format
- 3 months of analyst support
TABLE OF CONTENTS
1 INTRODUCTION
- 1.1 Study Assumptions and Market Definition
- 1.2 Scope of the Study
2 RESEARCH METHODOLOGY
3 EXECUTIVE SUMMARY
4 MARKET LANDSCAPE
- 4.1 Market Overview
- 4.2 Market Drivers
- 4.2.1 Hyperscale and AI demand for high-density campuses
- 4.2.2 Government digital-economy and 5G push
- 4.2.3 Sustainability-linked green financing
- 4.2.4 Spill-over migration from Singapore to Johor and Batam
- 4.2.5 Edge DC builds at new submarine-cable landings
- 4.2.6 Inland-China provincial land-power incentives
- 4.3 Market Restraints
- 4.3.1 Data-sovereignty compliance hurdles
- 4.3.2 Power-grid bottlenecks in tier-1 metros
- 4.3.3 High-seismic-zone insurance premiums
- 4.3.4 Liquid-cooling talent gap
- 4.4 Value / Supply-Chain Analysis
- 4.5 Regulatory Landscape
- 4.6 Technological Outlook
- 4.7 Porter's Five Forces
- 4.7.1 Bargaining Power of Suppliers
- 4.7.2 Bargaining Power of Consumers
- 4.7.3 Threat of New Entrants
- 4.7.4 Threat of Substitutes
- 4.7.5 Intensity of Competitive Rivalry
5 KEY DATA CENTER STATISTICS
- 5.1 Exhaustive Data Center Operators in Asia-Pacific (in MW)
- 5.2 List of Major Upcoming Data Center Projects in Asia-Pacific (2025-2030)
- 5.3 CAPEX and OPEX For Asia-Pacific Data Center Construction
- 5.4 Data Center Power Capacity Absorption In MW, Selected Cities, Asia-Pacific, 2023 and 2024
6 ARTIFICIAL INTELLIGENCE (AI) INCLUSION IN DATA CENTER CONSTRUCTION IN Asia-Pacific
7 REGULATORY and COMPLIANCE FRAMEWORK
8 MARKET SIZE and GROWTH FORECASTS (VALUE)
- 8.1 By Tier Type
- 8.1.1 Tier 1 and 2
- 8.1.2 Tier 3
- 8.1.3 Tier 4
- 8.2 By Data Center Type
- 8.2.1 Colocation
- 8.2.2 Self-build Hyperscalers (CSPs)
- 8.2.3 Enterprise and Edge
- 8.3 By Infrastructure
- 8.3.1 By Electrical Infrastructure
- 8.3.1.1 Power Distribution Solution
- 8.3.1.2 Power Backup Solutions
- 8.3.2 By Mechanical Infrastructure
- 8.3.2.1 Cooling Systems
- 8.3.2.2 Racks and Cabinets
- 8.3.2.3 Servers and Storage
- 8.3.2.4 Other Mechanical Infrastructure
- 8.3.3 General Construction
- 8.3.4 Service - Design and Consulting, Integration, Support and Maintenance
- 8.3.1 By Electrical Infrastructure
9 COMPETITIVE LANDSCAPE
- 9.1 Market Concentration
- 9.2 Strategic Moves
- 9.3 Market Share Analysis
- 9.4 Data Center Infrastructure Investment Based on Megawatt (MW) Capacity, 2024 vs 2030
- 9.5 Data Center Construction Landscape (Key Vendors Listings)
- 9.6 Company Profiles (includes Global level Overview, Market level overview, Core Segments, Financials as available, Strategic Information, Market Rank/Share for key companies, Products and Services, Recent Developments)
- 9.6.1 AECOM
- 9.6.2 DPR Construction Inc.
- 9.6.3 Fortis Construction Inc.
- 9.6.4 Goodman Group
- 9.6.5 Hibiya Engineering Ltd.
- 9.6.6 Larsen and Toubro Limited
- 9.6.7 GIC Private Limited
- 9.6.8 Sino Group
- 9.6.9 Citramas Group
- 9.6.10 Aurecon Group Pty Ltd
- 9.6.11 Turner Construction Company
- 9.6.12 Jacobs Solutions Inc.
- 9.6.13 Exyte GmbH
- 9.6.14 Leighton Asia (CIMIC Group)
- 9.6.15 Gamuda Berhad
- 9.6.16 YTL Power International Berhad
- 9.6.17 China Communications Services Corp. Ltd.
- 9.6.18 ST Telemedia Global Data Centres
- 9.6.19 Chindata Group Holdings Ltd.
- 9.6.20 ST Engineering - Digital Systems
10 MARKET OPPORTUNITIES and FUTURE OUTLOOK
- 10.1 White-Space and Unmet-Need Assessment

 中東資料中心建置:市場佔有率分析、產業趨勢與統計及成長預測(2026-2032 年)南美洲資料中心建置:市場佔有率分析、產業趨勢與統計及成長預測(2026-2031 年)德國資料中心建置:市場佔有率分析、產業趨勢與統計及成長預測(2026-2031 年)日本資料中心建置:市場佔有率分析、產業趨勢與統計及成長預測(2026-2032)歐洲資料中心建置:市場佔有率分析、產業趨勢與統計及成長預測(2026-2031 年)法國資料中心建置:市場佔有率分析、產業趨勢與統計及成長預測(2026-2031 年)泰國資料中心建置:市場佔有率分析、產業趨勢與統計及成長預測(2026-2031)義大利資料中心建置:市場佔有率分析、產業趨勢與統計及成長預測(2026-2031 年)英國資料中心建置:市場佔有率分析、產業趨勢與統計及成長預測(2026-2031 年)越南資料中心建設:市場佔有率分析、產業趨勢與統計及成長預測(2026-2031年)