


 |
市場調查報告書
商品編碼
2119874
美國資料中心網路:市場佔有率分析、產業趨勢與統計及成長預測(2026-2031 年)United States Data Center Networking - Market Share Analysis, Industry Trends & Statistics, Growth Forecasts (2026 - 2031) |
||||||

※ 本網頁內容可能與最新版本有所差異。詳細情況請與我們聯繫。
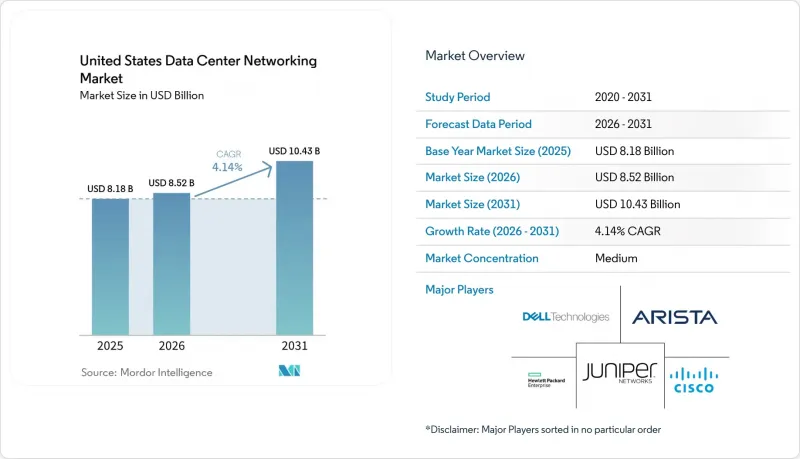
根據 Mordor Intelligence 預測,美國資料中心網路市場規模將從 2025 年的 81.8 億美元成長到 2026 年的 85.2 億美元,然後在 2031 年達到 104.3 億美元,2026 年至 2031 年的複合年成長率為 4.14%。
本報告按組件(產品和服務)、最終用戶(IT和電信、銀行、金融服務和保險 (BFSI)、政府和國防、其他)、資料中心類型(託管、超大規模資料中心業者雲端服務供應商、邊緣和微型資料中心)以及頻寬(10GbE 以下、25-40GbE、其他)進行細分。市場預測以美元計價。
美國資料中心網路市場趨勢與洞察
超大規模和人工智慧主導的頻寬需求激增
超大規模營運商正在重構其網路,以應對人工智慧工作負載,這些工作負載的資料處理量是傳統應用程式的 10 到 100 倍。 Meta 在其訓練叢集採用 Arista 7700R4 平台,顯示無阻塞、Terabit特級東西向網路架構的應用日益普及,這種架構能夠降低分散式 GPU 的延遲。微軟斥資 800 億美元建設人工智慧基礎設施,AWS 也斥資 300 億美元進行擴張,凸顯了市場對人工智慧專用交換器、光學模組和網路卡的激增需求。 NVIDIA 和 AMD 的客製化晶片也表明,營運商更傾向於使用高度整合的 800G 組件,而非通用設備。
向 400G/800G 乙太網路架構遷移
向 400G 和 800G 的過渡是自 10GbE 以來最大的飛躍,其驅動力來自 GPU叢集對 100G 鏈路的飽和。博通的「Tomahawk 6」支援 1.6Tb/s 端口,並預留了未來擴充的空間。超乙太網路聯盟 (UEC) 於 2025 年 6 月批准了 UEC 1.0,新增了封包噴射和網路內運算功能,專門用於 AI 流量。然而,800G光學模組長達 18 個月的前置作業時間將限制一些超大規模部署,直到 2026 年開始量產。
光收發器和專用積體電路(ASIC)的供應瓶頸
由於製造商優先研發超低抖動AI級光學模組,800G模組的前置作業時間已延長至18個月。 Lumentum正在調整其藍圖以適應此細分市場,並強調其傳統收發器產品線面臨供應短缺的問題。由於關稅導致設備成本上漲8%至20%,一些公司不得不推遲升級計劃,並被迫延長其100G設備的使用時間。
細分市場分析
超大規模資料中心業者購買了數千台固定外形規格交換機,因此該產品類別在2025年仍佔銷售額的77.60%。乙太網路切換器仍然是核心產品類別,但軟體定義控制器因其自動化功能而廣受歡迎。隨著透過高速光纖通訊分離運算和儲存的解耦架構的普及,儲存區域網路(SAN)設備的成長勢頭有所放緩。由於零信任設計需要廣泛的網路分段,網路安全設備重新受到關注。
隨著客戶對多廠商400G/800G網路架構的設計、整合和託管支援需求不斷成長,服務業正以4.32%的複合年成長率快速擴張。安裝團隊正在對時間敏感的光學模組進行調優,而託管服務則彌補了企業內部自動化技能的不足。培訓和顧問公司正在努力解決人工智慧網路調優領域人才日益短缺的問題。在美國資料中心網路市場,以結果為基本契約,將硬體、光學模組和專業知識捆綁在一起的供應商越來越受到青睞。
受早期5G核心網路部署和公共雲端骨幹網路現代化改造的推動,IT和電信公司在2025年仍維持34.15%的市場佔有率。金融機構緊隨其後,升級了用於演算法交易的低延遲通道。同時,製造業的複合年成長率達到5.08%,這得益於工業4.0賦能的工廠維修了即時分析和機器人生產線的發展。主要汽車製造商正在部署確定性架構,將工業協議與企業流量整合。
各國政府和國防機構正在對敏感網路進行現代化改造,並實現安全的AI模型訓練。醫療服務提供者正在擴展用於影像和電子健康記錄的頻寬。媒體公司正在推進4K/8K視訊串流的建設,這需要突發容量和抖動控制。因此,美國資料中心網路市場正從由電信業者主導的單一領域,轉變為一系列工業應用場景的集合。
其他好處
- Excel格式的市場預測(ME)表
- 3個月的分析師支持
目錄
第1章:引言
- 研究假設和市場定義
- 調查範圍
第2章:調查方法
第3章執行摘要
第4章 市場狀況
- 市場概覽
- 市場促進因素
- 超大規模和人工智慧主導的頻寬需求激增
- 向 400G/800G 乙太網路架構遷移
- 邊緣運算和5G微資料中心的擴展
- 國家對智慧布料的節能激勵措施
- 採用與 CXL 相容的解耦架構。
- 透過推廣零信任來加速織物級微分割。
- 市場限制因素
- 光收發器和專用積體電路(ASIC)的供應瓶頸
- 從傳統的 10/40G 升級到 400G 或更高需要大量的資金投入。
- 透過更嚴格的用水限制來抑制超大規模擴張
- 具備自動化技能的網路工程師短缺
- 供應鏈分析
- 監理情勢
- 技術展望
- 波特五力分析
- 對影響市場的宏觀經濟因素進行評估
第5章 市場規模與成長預測
- 按組件
- 產品
- 乙太網路切換器
- 路由器
- 儲存區域網路(SAN)
- 應用傳遞控制器(ADC)
- 網路安全設備
- 軟體定義網路 (SDN) 控制器
- 光連接模組
- 服務
- 安裝與整合
- 培訓和諮詢
- 支援與維護
- 主機服務
- 產品
- 最終用戶
- 資訊科技/通訊
- 銀行、金融服務和保險(BFSI)
- 政府/國防
- 媒體與娛樂
- 醫療保健和生命科學
- 製造業和工業
- 其他最終用戶
- 依資料中心類型
- 搭配
- 超大規模資料中心業者雲端服務供應商
- 邊緣微資料中心
- 頻寬
- 10GbE 或更低
- 25~40GbE
- 50~100GbE
- 超過 100GbE
第6章 競爭情勢
- 市場集中度
- 策略趨勢
- 市佔率分析
- 公司簡介
- Cisco Systems, Inc.
- Arista Networks, Inc.
- Juniper Networks, Inc.
- Dell Technologies, Inc.
- Hewlett Packard Enterprise(HPE)
- NVIDIA Corp.(Mellanox and Cumulus)
- Intel Corporation
- Broadcom Inc.
- Extreme Networks, Inc.
- Microsoft(SONiC Open-Source)
- VMware(Broadcom)
- Huawei Technologies Co., Ltd.
- IBM Corporation
- Schneider Electric SE
- Eaton Corporation plc
- Emerson Electric Co.
- NetApp, Inc.
- Super Micro Computer, Inc.
- Nvidia Networking(Infiniband)
- Equinix, Inc.(Interconnection)
- Digital Realty Trust, Inc.
- Panduit Corp.
- CommScope Holding Co., Inc.
第7章 市場機會與未來展望
According to Mordor Intelligence, the United States data center networking market size is expected to grow from USD 8.18 billion in 2025 to USD 8.52 billion in 2026 and is forecast to reach USD 10.43 billion by 2031 at 4.14% CAGR over 2026-2031.
This report is Segmented by Component (Product, and Services), End User (IT and Telecommunications, Banking, Financial Services and Insurance (BFSI), Government and Defense, and More), Data Center Type (Colocation, Hyperscalers/Cloud Service Providers, and Edge/Micro Data Centers), Bandwidth (<=10 GbE, 25-40 GbE, and More). The Market Forecasts are Provided in Terms of Value (USD).
United States Data Center Networking Market Trends and Insights
Surge in Hyperscale and AI-driven Bandwidth Demand
Hyperscale operators are rebuilding networks to serve AI workloads that move 10-100 times more data than legacy applications. Meta's adoption of Arista 7700R4 platforms for training clusters highlights the spread of non-blocking, terabit-scale east-west fabrics that reduce latency for distributed GPUs. Microsoft's USD 80 billion AI build-out and AWS's USD 30 billion expansion reinforce the steep equipment pull for AI-specific switches, optics, and NICs. Custom silicon from NVIDIA and AMD underlines operators' desire to bypass general-purpose devices in favor of tightly integrated 800G parts.
Migration to 400G/800G Ethernet Fabrics
The jump to 400G and 800G is the largest step since 10 GbE, driven by GPU clusters that saturate 100G links. Broadcom's Tomahawk 6 supports 1.6 Tb/s ports, anticipating future headroom. The Ultra Ethernet Consortium ratified UEC 1.0 in June 2025, adding packet-spraying and in-network compute specifically for AI traffic. Rollouts face 18-month lead times for 800G optics, constraining some hyperscale buildouts until production ramps in 2026.
Optical Transceiver and ASIC Supply Bottlenecks
Lead times on 800G modules have stretched to 18 months as manufacturers prioritize AI-grade optics with ultra-low jitter. Lumentum shifted its roadmap to serve this niche, demonstrating the squeeze on conventional transceiver lines. Tariff impacts added 8-20% to equipment costs, prompting some enterprises to defer upgrades and sweat 100G assets longer than planned.
Other drivers and restraints analyzed in the detailed report include:
- Expansion of Edge and 5G Micro-data-centers
- State Energy-efficiency Incentives for Smart Fabrics
- High Capex for Legacy 10/40 G above 400 G Upgrades
For complete list of drivers and restraints, kindly check the Table Of Contents.
Segment Analysis
Products continued to hold 77.60% of 2025 revenue as hyperscalers bought thousands of fixed-form-factor switches. Ethernet switches remained the anchor category, while software-defined controllers gained favor for policy automation. Storage-area networking equipment lost momentum as disaggregated architectures separated compute and storage across high-speed optics. Network security appliances regained focus because zero-trust designs require pervasive segmentation.
The services slice is climbing at a 4.32% CAGR as clients seek design, integration, and managed support for multi-vendor 400G/800G fabrics. Installation teams coordinate timing-sensitive optics, while managed services offset scarce in-house automation skills. Training and consulting firms address a widening talent gap around AI-specific network tuning. The United States data center networking market increasingly rewards providers that bundle hardware, optics, and expertise under outcome-based contracts.
IT-telecom operators retained a 34.15% share in 2025, anchored by early 5G core deployments and public-cloud backbone refreshes. Financial institutions followed, upgrading latency paths for algorithmic trading. Manufacturing, however, is posting a 5.08% CAGR as Industry 4.0 plants retrofit with real-time analytics and robotic lines. Automotive giants are installing deterministic fabrics that blend industrial protocols with enterprise traffic.
Government and defense agencies are modernizing classified networks to enable secure AI model training. Healthcare providers expand bandwidth for diagnostic imaging and electronic records. Media firms push 4K/8K pipelines that need burst capacity and jitter control. The United States data center networking market is therefore becoming a patchwork of vertical use cases rather than a monolithic telecom-led domain.
Complete Report Scope:
- By Component
- Products
- Ethernet Switches
- Routers
- Storage Area Network (SAN)
- Application Delivery Controllers (ADC)
- Network Security Appliances
- Software-Defined Networking (SDN) Controllers
- Optical Interconnects
- Services
- Installation and Integration
- Training and Consulting
- Support and Maintenance
- Managed Network Services
- Products
- By End-User
- IT and Telecommunications
- Banking, Financial Services and Insurance (BFSI)
- Government and Defense
- Media and Entertainment
- Healthcare and Life Sciences
- Manufacturing and Industrial
- Other End-Users
- By Data-Center Type
- Colocation
- Hyperscalers/Cloud Service Providers
- Edge/Micro Data Centers
- By Bandwidth
- Less Than or Equal to 10 GbE
- 25-40 GbE
- 50-100 GbE
- Greater Than 100 GbE
List of Companies Covered in this Report:
- Cisco Systems, Inc.
- Arista Networks, Inc.
- Juniper Networks, Inc.
- Dell Technologies, Inc.
- Hewlett Packard Enterprise (HPE)
- NVIDIA Corp. (Mellanox and Cumulus)
- Intel Corporation
- Broadcom Inc.
- Extreme Networks, Inc.
- Microsoft (SONiC Open-Source)
- VMware by Broadcom
- Huawei Technologies Co., Ltd.
- IBM Corporation
- Schneider Electric SE
- Eaton Corporation plc
- Emerson Electric Co.
- NetApp, Inc.
- Super Micro Computer, Inc.
- Nvidia Networking (Infiniband)
- Equinix, Inc. (Interconnection)
- Digital Realty Trust, Inc.
- Panduit Corp.
- CommScope Holding Co., Inc.
Additional Benefits:
- The market estimate (ME) sheet in Excel format
- 3 months of analyst support
TABLE OF CONTENTS
1 INTRODUCTION
- 1.1 Study Assumptions and Market Definition
- 1.2 Scope of the Study
2 RESEARCH METHODOLOGY
3 EXECUTIVE SUMMARY
4 MARKET LANDSCAPE
- 4.1 Market Overview
- 4.2 Market Drivers
- 4.2.1 Surge in hyperscale and AI-driven bandwidth demand
- 4.2.2 Migration to 400G/800G Ethernet fabrics
- 4.2.3 Expansion of edge and 5G micro-data-centers
- 4.2.4 State energy-efficiency incentives for smart fabrics
- 4.2.5 Adoption of CXL-enabled disaggregated architectures
- 4.2.6 Zero-trust push driving fabric-level micro-segmentation
- 4.3 Market Restraints
- 4.3.1 Optical transceiver and ASIC supply bottlenecks
- 4.3.2 High capex for legacy 10/40 G above 400 G upgrades
- 4.3.3 Rising water-usage limits curbing hyperscale expansion
- 4.3.4 Scarcity of automation-skilled network engineers
- 4.4 Supply-Chain Analysis
- 4.5 Regulatory Landscape
- 4.6 Technological Outlook
- 4.7 Porter's Five Forces Analysis
- 4.7.1 Threat of New Entrants
- 4.7.2 Bargaining Power of Buyers
- 4.7.3 Bargaining Power of Suppliers
- 4.7.4 Threat of Substitutes
- 4.7.5 Intensity of Competitive Rivalry
- 4.8 Assesment of Macroeconomic Factors on the Market
5 MARKET SIZE AND GROWTH FORECASTS (VALUE)
- 5.1 By Component
- 5.1.1 Products
- 5.1.1.1 Ethernet Switches
- 5.1.1.2 Routers
- 5.1.1.3 Storage Area Network (SAN)
- 5.1.1.4 Application Delivery Controllers (ADC)
- 5.1.1.5 Network Security Appliances
- 5.1.1.6 Software-Defined Networking (SDN) Controllers
- 5.1.1.7 Optical Interconnects
- 5.1.2 Services
- 5.1.2.1 Installation and Integration
- 5.1.2.2 Training and Consulting
- 5.1.2.3 Support and Maintenance
- 5.1.2.4 Managed Network Services
- 5.1.1 Products
- 5.2 By End-User
- 5.2.1 IT and Telecommunications
- 5.2.2 Banking, Financial Services and Insurance (BFSI)
- 5.2.3 Government and Defense
- 5.2.4 Media and Entertainment
- 5.2.5 Healthcare and Life Sciences
- 5.2.6 Manufacturing and Industrial
- 5.2.7 Other End-Users
- 5.3 By Data-Center Type
- 5.3.1 Colocation
- 5.3.2 Hyperscalers/Cloud Service Providers
- 5.3.3 Edge/Micro Data Centers
- 5.4 By Bandwidth
- 5.4.1 Less Than or Equal to 10 GbE
- 5.4.2 25-40 GbE
- 5.4.3 50-100 GbE
- 5.4.4 Greater Than 100 GbE
6 COMPETITIVE LANDSCAPE
- 6.1 Market Concentration
- 6.2 Strategic Moves
- 6.3 Market Share Analysis
- 6.4 Company Profiles (includes Global level Overview, Market level overview, Core Segments, Financials as available, Strategic Information, Market Rank/Share for key companies, Products and Services, and Recent Developments)
- 6.4.1 Cisco Systems, Inc.
- 6.4.2 Arista Networks, Inc.
- 6.4.3 Juniper Networks, Inc.
- 6.4.4 Dell Technologies, Inc.
- 6.4.5 Hewlett Packard Enterprise (HPE)
- 6.4.6 NVIDIA Corp. (Mellanox and Cumulus)
- 6.4.7 Intel Corporation
- 6.4.8 Broadcom Inc.
- 6.4.9 Extreme Networks, Inc.
- 6.4.10 Microsoft (SONiC Open-Source)
- 6.4.11 VMware by Broadcom
- 6.4.12 Huawei Technologies Co., Ltd.
- 6.4.13 IBM Corporation
- 6.4.14 Schneider Electric SE
- 6.4.15 Eaton Corporation plc
- 6.4.16 Emerson Electric Co.
- 6.4.17 NetApp, Inc.
- 6.4.18 Super Micro Computer, Inc.
- 6.4.19 Nvidia Networking (Infiniband)
- 6.4.20 Equinix, Inc. (Interconnection)
- 6.4.21 Digital Realty Trust, Inc.
- 6.4.22 Panduit Corp.
- 6.4.23 CommScope Holding Co., Inc.
7 MARKET OPPORTUNITIES AND FUTURE OUTLOOK
- 7.1 White-space and Unmet-Need Assessment

 全球資料中心網路市場規模、佔有率、趨勢和成長分析報告(2026-2034)
 北美資料中心網路:市場佔有率分析、產業趨勢與統計及成長預測(2026-2031 年)南美洲資料中心網路:市場佔有率分析、產業趨勢與統計及成長預測(2026-2031 年)印度資料中心網路:市場佔有率分析、產業趨勢與統計及成長預測(2026-2031 年)德國資料中心網路:市場佔有率分析、產業趨勢與統計及成長預測(2026-2031 年)歐洲資料中心網路:市場佔有率分析、產業趨勢與統計及成長預測(2026-2031 年)泰國資料中心網路:市場佔有率分析、產業趨勢與統計及成長預測(2026-2031)義大利資料中心網路:市場佔有率分析、產業趨勢與統計及成長預測(2026-2031 年)英國資料中心網路:市場佔有率分析、產業趨勢與統計及成長預測(2026-2031 年)資料中心網路:市場佔有率分析、產業趨勢與統計、成長預測(2026-2031)