


 |
市場調查報告書
商品編碼
2119779
歐洲資料中心網路:市場佔有率分析、產業趨勢與統計及成長預測(2026-2031 年)Europe Data Center Networking - Market Share Analysis, Industry Trends & Statistics, Growth Forecasts (2026 - 2031) |
||||||

※ 本網頁內容可能與最新版本有所差異。詳細情況請與我們聯繫。
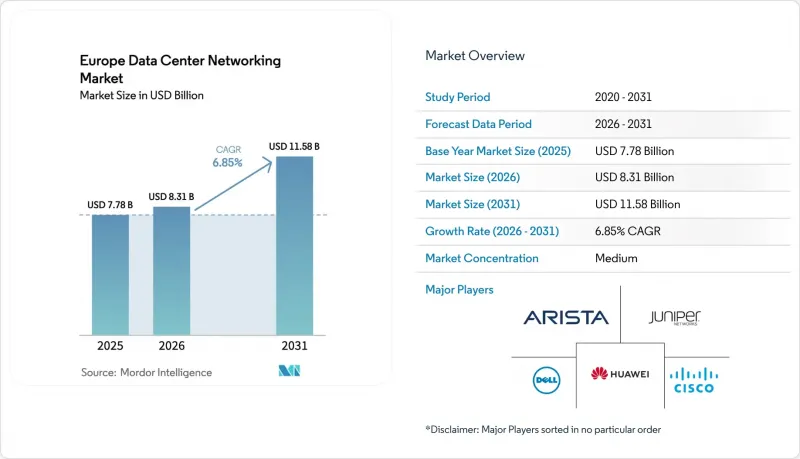
據 Mordor Intelligence 稱,歐洲資料中心網路市場預計到 2026 年價值將達到 83.1 億美元,高於 2025 年的 77.8 億美元,預計到 2031 年將達到 115.8 億美元。
預計 2026 年至 2031 年的複合年成長率為 6.85%。
本報告按組件(按產品、按服務)、最終用戶(IT和電信、銀行、金融服務和保險以及其他最終用戶)、資料中心類型(託管、超大規模資料中心業者/雲端服務供應商等)和頻寬(10 GbE以下、25-40 GbE等)對產業進行細分。市場預測以美元計價。
歐洲資料中心網路市場趨勢與洞察
雲端儲存和可靠的應用程式效能
至2024年,45%的歐盟企業已採用雲端服務。其主要用途是電子郵件託管和文件存儲,凸顯了企業對外部部署平台的普遍依賴。歐洲政府機構採用Oracle雲端基礎設施來處理其工作負載,顯示公共部門對雲端原生網路的信任。即時結算法規要求歐洲銀行在2025年前實現10秒內完成交易結算,這項要求提高了對延遲的容忍度,並強調了超低抖動交換架構的重要性。 「值得信賴且負責任的AI網路」連接各大醫院,依靠高度容錯的資料中心間路徑,在遵守隱私法規的前提下,確保診斷AI始終運作。這些監管要求和效能預期共同作用,使高可用性網路超越了單純的營運需求,成為經營團隊層面的差異化優勢。
5G和邊緣運算帶來的流量激增
歐盟的目標是到2030年部署1萬個氣候中和的邊緣節點,預計80%的處理將在核心站點之外進行。 「5GMEC4EU」計畫下的示範計畫展示了一種亞毫秒邊緣架構,該架構整合了光路交換和SDN控制平面。德國電信將邊緣運算定位為國家數位化議程的基石,它將在智慧城市中實現遙測和自動駕駛。微型資料中心銷售額在2023年已超過58億美元,預計到2036年將達到1,608億美元,顯示市場對高效能交換器和智慧邊緣控制器有著強勁的需求。這種分散式拓撲結構需要一個新的編配層,以實現數千個微型站點之間的即時故障隔離,從而將流量從FLAP中心重定向。
網路複雜度不斷增加
混合雲端和人工智慧管道的無序擴張正以前所未有的速度增加網路拓撲結構的複雜性,歐洲企業在招募熟練工程師方面已難以跟上步伐。瞻博網路旗下的 Apstra 正在將基於意圖的自動化應用於多廠商架構,但由於團隊必須同時應對 Kubernetes、Terraform 和光路交換等技術,技能短缺問題仍然存在。歐洲電信網路營運商協會 (ETNO) 呼籲放鬆管制,以便電信業者在提供邊緣服務的同時收回投資。缺乏廣泛的專業知識導致各組織延後升級,減緩了歐洲資料中心網路市場的設備現代化進程。
細分市場分析
到2025年,乙太網路切換器將佔據歐洲資料中心網路市場34.78%的佔有率,凸顯其在連接GPU叢集的葉脊式網路架構中的重要角色。軟體定義網路(SDN)控制器以11.76%的複合年成長率成長,能夠統一管理不同代的ASIC晶片,並實現容錯移轉自動化-隨著叢集規模達到1萬台伺服器以上,故障轉移功能變得至關重要。路由器在廣域網路存取中仍然發揮著重要作用,但它們內部的角色正逐漸被融合交換器取代,後者能夠扁平化網路層並降低延遲。儲存網路的發展速度雖然放緩,但隨著金融服務業採用不可變備份庫以滿足營運彈性法規的要求,儲存網路正吸引該產業的注意。應用程式交付控制器在邊緣端變得至關重要,它們能夠非常靠近使用者處理TLS卸載。為了符合歐盟數位營運彈性法(EU Digital Operational Resilience Law)的規定,安全設備正擴大整合到交換器作業系統鏡像中。光連接模組發展最為迅速,共封裝光學模組和線性可插拔光元件正在爭奪插座市場佔有率,營運商需要權衡成本、功耗和升級便利性。託管網路合約在市場中發揮穩定作用,因為它們有助於企業彌合因複雜性而造成的專業知識差距。
第二波設備更新換代浪潮正在形成,其主要驅動力是液冷設備。將冷板底盤與晶片直連迴路結合的廠商,對必須揭露PUE(電源使用效率)的託管資料中心營運商極具吸引力。由於通用晶片的普及,硬體效能趨於同質化,差異化重點也隨之轉向網路作業系統(NOS)功能,例如即時網路遙測。 SONiC等開放式網路發行版讓買家相信,無需大規模佈線即可切換廠商,而軟體支援和生命週期管理正成為新的信任指標。這種轉變正在將收入來源從實體連接埠轉移到授權和基於訂閱的遙測服務,但封包處理電路(ASIC)的創新對於線速加密和人工智慧叢集擁塞控制仍然至關重要。
到2025年,IT和電信公司將憑藉其廣泛的互聯互通和骨幹網路資產,實現混合雲端和5G的商業化,從而貢獻36.05%的收入。銀行和保險公司以12.65%的複合年成長率位居榜首,因為即時結算和模型驅動風險評分的監管要求保險箱和分析引擎之間必須具備超低延遲的連接。政府和國防機構正在採用主權雲端框架,例如德國的「德國行政雲」(Deutsche Verwaltungscloud),優先考慮資料位置和零信任分段。媒體和娛樂公司正在擴展私有CDN,並將轉碼轉移到邊緣機架,以緩解體育賽事直播期間的骨幹網路擁塞。醫療保健網路正在參與放射診斷的共用AI模型,從而推動對加密東西向流量檢測的需求。製造業正在透過部署用於機器人單元和預測性維護的確定性以太網,推動營運技術(OT)和IT領域的整合。教育、零售和物流佔剩餘支出,隨著數位化課程和全通路履約的成熟,我們正在將校園核心網路升級到 100 GbE。
歐盟對營運韌性的監管壓力正在推動資本投資。 《數位營運韌性法案》強制要求即使是中型金融機構也必須進行季度容錯移轉測試,並推動了冗餘網狀網路配置的採用。電信業者正在將流量分流到多接入邊緣單元 (MAEU) 以緩解無線存取網 (RAN) 擁塞,並將特定工作負載的路由功能整合到核心交換器中。總體而言,行業多樣性正在減輕經濟波動對歐洲資料中心網路市場的影響,而銀行、金融和保險 (BFSI) 行業的市場佔有率正在擴大。
其他好處:
- Excel格式的市場預測(ME)表
- 3個月的分析師支持
目錄
第1章:引言
- 研究假設和市場定義
- 調查範圍
第2章:調查方法
第3章執行摘要
第4章 市場狀況
- 市場概覽
- 市場促進因素
- 雲端儲存和穩定的應用程式效能
- 5G和邊緣運算帶來的流量激增
- 遷移到 400G/800G 乙太網路交換
- 歐盟推廣的高效水冷開關
- FLAP關閉後,建築物過渡到歐盟(能源使用)二次計量表
- 透過使用市售矽晶片和開放式網路作業系統,可以減少資本投入。
- 市場限制因素
- 網路複雜性
- 光元件和專用積體電路(ASIC)供應鏈供不應求。
- 電網瓶頸和授權延遲
- 由於碳排放和用水量受到限制,總擁有成本(TCO)正在增加。
- 價值供應鏈分析
- 監理情勢
- 技術展望
- 波特五力模型
- 評估宏觀經濟趨勢對市場的影響
第5章 市場規模與成長預測
- 按組件
- 產品
- 乙太網路切換器
- 路由器
- 儲存區域網路(SAN)
- 應用傳遞控制器(ADC)
- 網路安全設備
- 軟體定義網路 (SDN) 控制器
- 光連接模組
- 服務
- 安裝與整合
- 培訓和諮詢
- 支援與維護
- 主機服務
- 產品
- 最終用戶
- IT/通訊
- 銀行、金融服務和保險(BFSI)
- 政府/國防
- 媒體與娛樂
- 醫療保健和生命科學
- 製造業和工業
- 其他最終用戶
- 依資料中心類型
- 搭配
- 超大規模資料中心業者雲端服務供應商/雲端服務供應商
- 邊緣/微型資料中心
- 頻寬
- 10 GbE 或更低
- 25~40 GbE
- 50~100 GbE
- 100 GbE 或更高
- 國家
- 英國
- 德國
- 法國
- 荷蘭
- 愛爾蘭
- 西班牙
- 義大利
- 瑞典
- 丹麥
- 挪威
- 波蘭
- 奧地利
- 比利時
- 瑞士
- 其他歐洲國家
第6章 競爭情勢
- 市場集中度
- 策略趨勢
- 市佔率分析
- 公司簡介
- Cisco Systems Inc.
- Arista Networks Inc.
- Juniper Networks Inc.
- Huawei Technologies Co. Ltd.
- Dell Technologies Inc.
- Extreme Networks Inc.
- Broadcom Inc.
- Hewlett Packard Enterprise Co.
- Lenovo Group Ltd.
- NEC Corp.
- Fortinet Inc.
- VMware Inc.
- Nokia Corp.
- NVIDIA Corp.(Mellanox)
- Array Networks Inc.
- Radware Ltd.
- A10 Networks Inc.
- Moxa Inc.
- Ericsson AB
- Check Point Software Technologies Ltd.
第7章 市場機會與未來展望
According to Mordor Intelligence, Europe data center networking market size in 2026 is estimated at USD 8.31 billion, growing from 2025 value of USD 7.78 billion with 2031 projections showing USD 11.58 billion, growing at 6.85% CAGR over 2026-2031.
This report Segments the Industry Into Components (By Product, by Services), End-Users (IT & Telecommunication, BFSI, Other End-Users). By Data-Center Type(Colocation, Hyperscalers/Cloud Service Providers, and More). And Bandwidth( <=10 GbE, 25-40 GbE, and More). The Market Forecasts are Provided in Terms of Value (USD).
Europe Data Center Networking Market Trends and Insights
Cloud Storage and Reliable Application Performance
Forty-five percent of EU businesses procured cloud services in 2024, primarily for email hosting and file storage, underscoring mainstream reliance on off-premise platforms. Oracle Cloud Infrastructure was selected for European government workloads, indicating public-sector trust in cloud-native networks. Instant payment regulations require European banks to clear transactions within 10 seconds by 2025, a mandate that tightens latency budgets and favors ultra-low-jitter switching fabrics. The Trustworthy & Responsible AI Network linking leading hospitals depends on resilient inter-data-center paths to keep diagnostic AI online while remaining privacy-compliant. Together, regulatory imperatives and performance expectations elevate high-availability networking from operational necessity to board-level differentiator.
5G and Edge-Computing Traffic Surge
The EU intends to deploy 10,000 climate-neutral edge nodes by 2030, expecting 80% of processing to occur outside core sites. Demonstrations under the 5GMEC4EU program validate sub-millisecond edge fabrics that integrate optical circuit switching with SDN control planes. Deutsche Telekom positions edge as a pillar for national digital agendas, enabling smart-city telemetry and autonomous mobility. Micro data center revenues already exceeded USD 5.8 billion in 2023 and have a runway toward USD 160.8 billion by 2036, revealing a robust pipeline for ruggedized switches and intelligent edge controllers. This distributed topology re-routes traffic away from FLAP hubs, demanding new orchestration layers capable of real-time fault isolation across thousands of mini-sites.
Rising Network Complexity
Hybrid cloud sprawl and AI pipelines complicate topologies faster than European enterprises can recruit qualified engineers. Juniper's Apstra applies intent-based automation to multivendor fabrics, yet skills shortages persist as teams juggle Kubernetes, Terraform, and optical circuit switching. ETNO argues for policy relief that lets carriers recoup investments while delivering edge services. Without broad expertise, organisations defer upgrades, slowing refresh activity in the Europe data center networking market.
Other drivers and restraints analyzed in the detailed report include:
- Migration to 400G/800G Ethernet Switching
- EU Push for Energy-Efficient Liquid-Cooled Switching
- Supply-Chain Shortage of Optics and ASICs
For complete list of drivers and restraints, kindly check the Table Of Contents.
Segment Analysis
Ethernet switches commanded 34.78% Europe data center networking market share in 2025, underscoring their role in leaf-spine fabrics that feed GPU clusters. Software-defined networking controllers, expanding at 11.76% CAGR, orchestrate diverse ASIC generations and automate failover, a necessity as average cluster sizes surpass 10,000 servers. Routers retain relevance for WAN ingress but cede internal roles to converged switches that flatten layers and squeeze latency. Storage networking, though growing slower, gains interest from financial services adopting immutable backup vaults to satisfy operational resilience rules. Application delivery controllers become indispensable at the edge, handling TLS offload near user eyeballs. Security appliances increasingly embed in switching OS images to comply with EU Digital Operational Resilience Act rules. Optical interconnects evolve fastest; co-packaged optics and linear pluggable optics battle for sockets as operators weigh cost, power and upgrade ease. Services hold a stabilizing influence as managed network contracts let enterprises offset the expertise gap that complexity creates.
A second-wave replacement super-cycle is forming around liquid-cool ready gear. Vendors pairing cold-plate chassis with direct-to-chip loops appeal to colocation landlords who must publish PUE scores. Merchant silicon levels hardware performance, shifting differentiation toward NOS features such as real-time fabric telemetry. Open networking distributions like SONiC persuade buyers that they can swap vendors without forklift rewires, making software support and lifecycle stewardship the new trust metric. This pivot realigns profit pools toward licenses and subscription telemetry rather than physical ports, yet packet-processing ASIC innovation remains critical for line-rate encryption and AI cluster congestion control.
IT and telecommunications firms delivered 36.05% of 2025 revenue, leveraging rich peering and backbone assets to monetise hybrid cloud and 5G. Banks and insurers post the fastest 12.65% CAGR as instant-payment rules and model-driven risk scoring force ultra-low latency links between vaults and analytics engines. Government and defence entities adopt sovereign cloud frameworks such as Germany's Deutsche Verwaltungscloud, prioritising data residency and zero-trust segmentation. Media and entertainment houses expand private CDNs, shifting transcoding to edge racks to curb backbone congestion during live sports streams. Healthcare networks participate in shared AI models for radiology, fuelling demand for encrypted east-west traffic inspection. Manufacturing deploys deterministic Ethernet for robotic cells and predictive maintenance, pushing OT and IT domain convergence. Education, retail and logistics round out remaining spend, upgrading campus cores to 100 GbE as digital curricula and omnichannel fulfilment mature.
EU regulatory pressure for operational resilience anchors capital outlays. The Digital Operational Resilience Act compels even mid-tier financial entities to test failover quarterly, driving redundant mesh deployments. Telecommunication operators reroute traffic toward multi-access edge units to offload RAN congestion, embedding workload-aware routing into core switches. Overall, vertical diversity cushions cyclical swings in the Europe data center networking market while BFSI share grows.
Complete Report Scope:
- By Component
- Products
- Ethernet Switches
- Routers
- Storage Area Network (SAN)
- Application Delivery Controllers (ADC)
- Network Security Appliances
- Software-Defined Networking (SDN) Controllers
- Optical Interconnects
- Services
- Installation and Integration
- Training and Consulting
- Support and Maintenance
- Managed Network Services
- Products
- By End-User
- IT and Telecommunications
- Banking, Financial Services and Insurance (BFSI)
- Government and Defense
- Media and Entertainment
- Healthcare and Life Sciences
- Manufacturing and Industrial
- Other End-Users
- By Data-Center Type
- Colocation
- Hyperscalers/Cloud Service Providers
- Edge/Micro Data Centers
- By Bandwidth
- Less Than or equals to 10 GbE
- 25-40 GbE
- 50-100 GbE
- Greater than 100 GbE
- By Country
- United Kingdom
- Germany
- France
- Netherlands
- Ireland
- Spain
- Italy
- Sweden
- Denmark
- Norway
- Poland
- Austria
- Belgium
- Switzerland
- Rest of Europe
List of Companies Covered in this Report:
- Cisco Systems Inc.
- Arista Networks Inc.
- Juniper Networks Inc.
- Huawei Technologies Co. Ltd.
- Dell Technologies Inc.
- Extreme Networks Inc.
- Broadcom Inc.
- Hewlett Packard Enterprise Co.
- Lenovo Group Ltd.
- NEC Corp.
- Fortinet Inc.
- VMware Inc.
- Nokia Corp.
- NVIDIA Corp. (Mellanox)
- Array Networks Inc.
- Radware Ltd.
- A10 Networks Inc.
- Moxa Inc.
- Ericsson AB
- Check Point Software Technologies Ltd.
Additional Benefits:
- The market estimate (ME) sheet in Excel format
- 3 months of analyst support
TABLE OF CONTENTS
1 INTRODUCTION
- 1.1 Study Assumptions and Market Definition
- 1.2 Scope of the Study
2 RESEARCH METHODOLOGY
3 EXECUTIVE SUMMARY
4 MARKET LANDSCAPE
- 4.1 Market Overview
- 4.2 Market Drivers
- 4.2.1 Cloud storage and reliable application performance
- 4.2.2 5G and edge-computing traffic surge
- 4.2.3 Migration to 400G/800G Ethernet switching
- 4.2.4 EU push for energy-efficient liquid-cooled switching
- 4.2.5 Shift of builds to secondary EU metros after FLAP moratoria
- 4.2.6 Merchant silicon and open NOS adoption cuts capex
- 4.3 Market Restraints
- 4.3.1 Rising network complexity
- 4.3.2 Supply-chain shortage of optics and ASICs
- 4.3.3 Power-grid bottlenecks and permitting delays
- 4.3.4 Carbon-/water-use caps inflate TCO
- 4.4 Value / Supply-Chain Analysis
- 4.5 Regulatory Landscape
- 4.6 Technological Outlook
- 4.7 Porter's Five Forces
- 4.7.1 Threat of New Entrants
- 4.7.2 Bargaining Power of Buyers/Consumers
- 4.7.3 Bargaining Power of Suppliers
- 4.7.4 Threat of Substitute Products
- 4.7.5 Intensity of Competitive Rivalry
- 4.8 Assessment of the Impact on Macro Economic Trends on the Market
5 MARKET SIZE and GROWTH FORECASTS (VALUE)
- 5.1 By Component
- 5.1.1 Products
- 5.1.1.1 Ethernet Switches
- 5.1.1.2 Routers
- 5.1.1.3 Storage Area Network (SAN)
- 5.1.1.4 Application Delivery Controllers (ADC)
- 5.1.1.5 Network Security Appliances
- 5.1.1.6 Software-Defined Networking (SDN) Controllers
- 5.1.1.7 Optical Interconnects
- 5.1.2 Services
- 5.1.2.1 Installation and Integration
- 5.1.2.2 Training and Consulting
- 5.1.2.3 Support and Maintenance
- 5.1.2.4 Managed Network Services
- 5.1.1 Products
- 5.2 By End-User
- 5.2.1 IT and Telecommunications
- 5.2.2 Banking, Financial Services and Insurance (BFSI)
- 5.2.3 Government and Defense
- 5.2.4 Media and Entertainment
- 5.2.5 Healthcare and Life Sciences
- 5.2.6 Manufacturing and Industrial
- 5.2.7 Other End-Users
- 5.3 By Data-Center Type
- 5.3.1 Colocation
- 5.3.2 Hyperscalers/Cloud Service Providers
- 5.3.3 Edge/Micro Data Centers
- 5.4 By Bandwidth
- 5.4.1 Less Than or equals to 10 GbE
- 5.4.2 25-40 GbE
- 5.4.3 50-100 GbE
- 5.4.4 Greater than 100 GbE
- 5.5 By Country
- 5.5.1 United Kingdom
- 5.5.2 Germany
- 5.5.3 France
- 5.5.4 Netherlands
- 5.5.5 Ireland
- 5.5.6 Spain
- 5.5.7 Italy
- 5.5.8 Sweden
- 5.5.9 Denmark
- 5.5.10 Norway
- 5.5.11 Poland
- 5.5.12 Austria
- 5.5.13 Belgium
- 5.5.14 Switzerland
- 5.5.15 Rest of Europe
6 COMPETITIVE LANDSCAPE
- 6.1 Market Concentration
- 6.2 Strategic Moves
- 6.3 Market Share Analysis
- 6.4 Company Profiles (includes Global level Overview, Market level overview, Core Segments, Financials as available, Strategic Information, Market Rank/Share, Products and Services, Recent Developments)
- 6.4.1 Cisco Systems Inc.
- 6.4.2 Arista Networks Inc.
- 6.4.3 Juniper Networks Inc.
- 6.4.4 Huawei Technologies Co. Ltd.
- 6.4.5 Dell Technologies Inc.
- 6.4.6 Extreme Networks Inc.
- 6.4.7 Broadcom Inc.
- 6.4.8 Hewlett Packard Enterprise Co.
- 6.4.9 Lenovo Group Ltd.
- 6.4.10 NEC Corp.
- 6.4.11 Fortinet Inc.
- 6.4.12 VMware Inc.
- 6.4.13 Nokia Corp.
- 6.4.14 NVIDIA Corp. (Mellanox)
- 6.4.15 Array Networks Inc.
- 6.4.16 Radware Ltd.
- 6.4.17 A10 Networks Inc.
- 6.4.18 Moxa Inc.
- 6.4.19 Ericsson AB
- 6.4.20 Check Point Software Technologies Ltd.
7 MARKET OPPORTUNITIES and FUTURE OUTLOOK
- 7.1 White-space and Unmet-Need Assessment

 全球資料中心網路市場規模、佔有率、趨勢和成長分析報告(2026-2034)
 北美資料中心網路:市場佔有率分析、產業趨勢與統計及成長預測(2026-2031 年)南美洲資料中心網路:市場佔有率分析、產業趨勢與統計及成長預測(2026-2031 年)印度資料中心網路:市場佔有率分析、產業趨勢與統計及成長預測(2026-2031 年)德國資料中心網路:市場佔有率分析、產業趨勢與統計及成長預測(2026-2031 年)泰國資料中心網路:市場佔有率分析、產業趨勢與統計及成長預測(2026-2031)美國資料中心網路:市場佔有率分析、產業趨勢與統計及成長預測(2026-2031 年)義大利資料中心網路:市場佔有率分析、產業趨勢與統計及成長預測(2026-2031 年)英國資料中心網路:市場佔有率分析、產業趨勢與統計及成長預測(2026-2031 年)資料中心網路:市場佔有率分析、產業趨勢與統計、成長預測(2026-2031)