


 |
市場調查報告書
商品編碼
2119784
資料中心網路:市場佔有率分析、產業趨勢與統計、成長預測(2026-2031)Data Center Networking - Market Share Analysis, Industry Trends & Statistics, Growth Forecasts (2026 - 2031) |
||||||

※ 本網頁內容可能與最新版本有所差異。詳細情況請與我們聯繫。
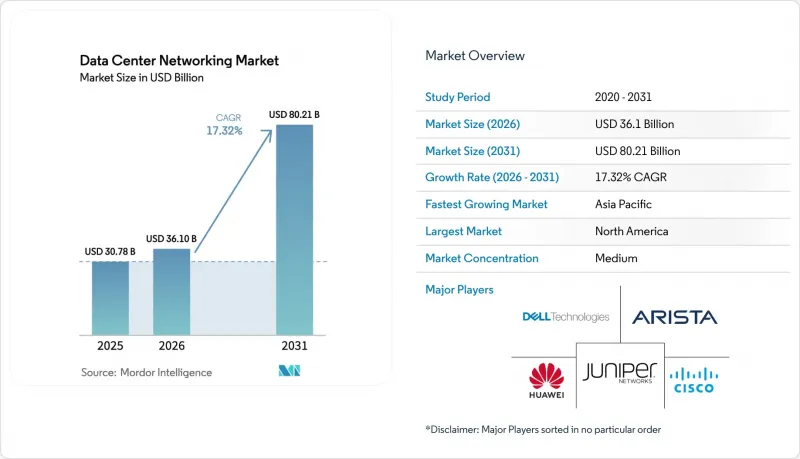
根據 Mordor Intelligence 預測,全球資料中心網路市場規模將從 2025 年的 307.8 億美元成長到 2026 年的 361 億美元,然後在 2031 年達到 802.1 億美元,2026 年至 2031 年的複合年成長率為 17.32%。
本報告按組件(產品和服務)、最終用戶(IT和電信、銀行、金融服務和保險 (BFSI)、政府和國防、其他)、資料中心類型(託管、超大規模資料中心業者和雲端服務供應商、邊緣和微型資料中心)、頻寬(10GbE 以下、25-40GbE、其他)以及地區進行細分。市場預測以美元 (USD) 計價。
全球資料中心網路市場趨勢與洞察
企業IT策略中日益普及的「雲端優先」方法
隨著企業從軸輻式架構向微服務架構轉型,它們正面臨著難以預測的流量激增,需要軟體定義疊加網路和即時遙測技術來應對。隨著金融機構擴大雲端預算,可程式交換器、雲端原生防火牆和零信任分段變得至關重要。這些因素正在推動400GbE葉脊式網路架構和用於偵測並修正延遲熱點的分析引擎的更新換代。
人工智慧和機器學習正在推動東西方交通流量激增。
GPU叢集傳輸梯度和參數的規模高達傳統工作負載的100倍,這是傳統的南北向架構無法處理的。 RoCE-v2採用優先權流控制和明確壅塞通知,可防止集體運算過程中出現丟包。同時,對800G和1.6T介面日益成長的需求正在加速商用晶片的創新。二級雲端平台使用乙太網路而非專有傳輸標準,以平衡成本和互通性。
多廠商互通性的挑戰
專有協議的氾濫阻礙了交換機、光學模組和遙測代理之間的無縫整合,迫使企業在檢驗實驗室方面投入大量資金。對開放標準控制器的支援延遲會延長過渡期,並導致運作孤島。當人工智慧叢集需要在異質架構中保證確定性的延遲時,這種影響尤其顯著。
細分市場分析
到2025年,該產品細分市場將佔資料中心網路市場收入的74.72%,這主要得益於乙太網路切換器從100G向400G的過渡,以支援人工智慧工作負載。光連接模組、儲存架構和應用傳遞控制器鞏固了該產品細分市場的主導,但隨著企業專注於簡化架構,銷售成長正在放緩。供應商報告稱,隨著GPU叢集的擴展,51.2Tbps底盤的銷售量有所成長。
隨著客戶擴大將無損網路架構的設計、整合和生命週期管理外包,服務板塊預計將以 17.7% 的複合年成長率成長。優先級流控制 (PFC) 調優、擁塞指標諮詢以及持續託管網路訂閱等實施服務正在推動經常性收入的成長。企業報告稱,實施承包託管營運後,平均部署時間縮短了 38%,這進一步鞏固了該服務作為實現人工智慧驅動型業務成果的關鍵要素的地位。
預計到2025年,IT與通訊領域將佔資料中心網路市場35.75%的佔有率,主要得益於對超大規模雲端、內容分發網路(CDN)以及支援數位服務交付的電信營運商的投資。跨都會園區的區域性消費主要由銀行、媒體串流和電子商務工作負載構成。
預計到2031年,製造業和工業領域將以18.05%的複合年成長率成長,這主要得益於預測性維護演算法從集中式雲端向工廠車間微型資料中心的轉移。低延遲乙太網路架構連接機器人、機器視覺攝影機和製造執行系統(MES)應用,從而減少停機時間和能源浪費。自2023年以來,邊緣原生網路合約數量增加了2.4倍,這支撐了對緊湊型無風扇400GbE葉交換器的持續需求。
區域分析
隨著資料中心網路市場擴張以適應數十億美元的超大規模成長,預計到2025年,北美將佔全球收入的26.05%。美國在區域資本支出(CAPEX)方面主導,而加拿大邊緣雲端供應商和墨西哥近岸園區也推動了需求的成長。當地設備製造商受惠於優惠的稅收政策和極低碳排放的電網。亞太地區是成長最快的地區,預計到2031年複合年成長率將達到17.55%,這反映了各國優先發展國內運算能力的AI策略。中國的「東方數據,西方計算」骨幹網路將八個沙漠地區的超大規模資料中心與沿海網際網路連接起來,促進了收發器的大規模採購。在印度,到2025年,裝置容量將超過950兆瓦,這將推動託管設施和電信營運商邊緣站點對400GbE網路架構的需求激增。在印尼和越南等市場,有利的法規結構和對海底電纜的區域投資進一步放大了這波成長。
其他好處
- Excel格式的市場預測(ME)表
- 3個月的分析師支持
目錄
第1章:引言
- 研究假設和市場定義
- 調查範圍
第2章:調查方法
第3章執行摘要
第4章 市場狀況
- 市場概覽
- 市場促進因素
- 倡導「雲端優先」策略的公司正在擴展其IT策略。
- 人工智慧和機器學習工作負載導致東西向交通流量激增
- 電信業者擴展邊緣資料中心
- 400GbE端口價格下降提高了投資回報率。
- 採用無損乙太網路實現高速運算。
- 超大規模資料中心業者對開放原始碼網路作業系統的貢獻
- 市場限制因素
- 與多個供應商之間的互通性相關的挑戰
- 網路複雜性與技能差距擴大
- 商用矽的供應鏈風險
- 資料中心日益成長的功率密度限制了連接埠升級。
- 供應鏈分析
- 監理情勢
- 技術展望
- 波特五力模型
- 對影響市場的宏觀經濟因素進行評估
第5章 市場規模與成長預測
- 按組件
- 產品
- 乙太網路切換器
- 路由器
- 儲存區域網路(SAN)
- 應用傳遞控制器(ADC)
- 網路安全設備
- 軟體定義網路 (SDN) 控制器
- 光連接模組
- 服務
- 安裝與整合
- 培訓和諮詢
- 支援與維護
- 主機服務
- 產品
- 最終用戶
- 資訊科技/通訊
- 銀行、金融服務和保險(BFSI)
- 政府/國防
- 媒體與娛樂
- 醫療保健和生命科學
- 製造業和工業
- 其他
- 依資料中心類型
- 搭配
- 超大規模資料中心業者雲端服務供應商
- 邊緣微資料中心
- 頻寬
- 10GbE 或更低
- 25~40GbE
- 50~100GbE
- 超過 100GbE
- 按地區
- 北美洲
- 美國
- 加拿大
- 墨西哥
- 南美洲
- 巴西
- 阿根廷
- 其他南美國家
- 歐洲
- 德國
- 英國
- 法國
- 荷蘭
- 其他歐洲國家
- 亞太地區
- 中國
- 日本
- 印度
- 韓國
- 澳洲和紐西蘭
- 其他亞太國家
- 中東和非洲
- 中東
- 阿拉伯聯合大公國
- 沙烏地阿拉伯
- 土耳其
- 其他中東國家
- 非洲
- 南非
- 奈及利亞
- 其他非洲地區
- 中東
- 北美洲
第6章 競爭情勢
- 市場集中度
- 策略趨勢
- 市佔率分析
- 公司簡介
- Cisco Systems Inc.
- Arista Networks Inc.
- Juniper Networks Inc.
- Huawei Technologies Co. Ltd.
- Dell Technologies(Dell EMC)
- Extreme Networks Inc.
- Hewlett Packard Enterprise(HPE)
- Lenovo Group Ltd.
- NEC Corporation
- NVIDIA Corp.(Cumulus and Mellanox)
- Broadcom Inc.
- Intel Corp.
- Fortinet Inc.
- F5 Inc.
- Radware Ltd.
- A10 Networks Inc.
- Check Point Software Technologies
- Palo Alto Networks Inc.
- Array Networks Inc.
- Moxa Inc.
- Supermicro(Super Micro Computer Inc.)
- Edgecore Networks Corp.
- H3C Holding Ltd.
- NetApp Inc.
- Keysight Technologies Inc.
第7章 市場機會與未來展望
According to Mordor Intelligence, the global data center networking market size is expected to grow from USD 30.78 billion in 2025 to USD 36.1 billion in 2026 and is forecast to reach USD 80.21 billion by 2031 at 17.32% CAGR over 2026-2031.
This report is Segmented by Component (Product and Services), End User( IT and Telecommunications, Banking, Financial Services and Insurance (BFSI), Government and Defense and More), Data Center Type (Colocation, Hyperscalers/Cloud Service Providers, Edge/Micro Data Centers), by Bandwidth (<=10 GbE, 25-40 GbE and More) and by Geography. The Market Forecasts are Provided in Terms of Value (USD).
Global Data Center Networking Market Trends and Insights
Growing Cloud-First Enterprise IT Strategies
Enterprises replacing hub-and-spoke designs with micro-services generate unpredictable traffic bursts that demand software-defined overlays and realtime telemetry. Programmable switches, cloud-native firewalls, and zero-trust segmentation become mandatory as financial institutions expand cloud budgets. This driver sustains refresh cycles for 400 GbE leaf-spine fabrics and analytics engines that discover and remediate latency hotspots.
AI/ML East-West Traffic Surge
GPU clusters move gradients and parameters at volumes up to 100 times higher than legacy workloads, overwhelming conventional north-south architectures. RoCE-v2 with Priority Flow Control and Explicit Congestion Notification prevents packet loss during collective operations, while demand for 800 G and 1.6 T interfaces accelerates merchant-silicon innovation. Tier-2 clouds adopt Ethernet rather than proprietary transports to balance cost and interoperability.
Multi-Vendor Interoperability Issues
Proprietary protocol extensions impede seamless integration across switches, optics, and telemetry agents, forcing enterprises to invest in costly validation labs. Delays in open-standard controller support extend migration timelines and create operational silos, particularly where AI clusters require deterministic latency guarantees across dissimilar fabrics.
Other drivers and restraints analyzed in the detailed report include:
- Telecom-Led Edge Data-Center Build-Outs
- 400 GbE Port Price Erosion
- Rising Network Complexity and Skill Gaps
For complete list of drivers and restraints, kindly check the Table Of Contents.
Segment Analysis
Products retained 74.72% of data center networking market revenue in 2025, led by Ethernet switches that transitioned from 100 G to 400 G to satisfy AI workloads. Optical interconnects, storage fabrics, and application delivery controllers reinforced Product dominance but now face slowing unit growth as enterprises focus on architectural simplification. Vendors reported upticks in 51.2 Tbps chassis sales as GPU clusters expanded.
The Services segment is projected to grow at 17.7% CAGR as customers offload design, integration, and lifecycle management of lossless fabrics. Installation services for Priority Flow Control tuning, consulting on congestion metrics, and ongoing managed-fabric subscriptions fuel recurring revenue. Enterprises cite reduced mean-time-to-deploy by 38% after adopting turnkey managed operations, positioning Services as a critical enabler of AI business outcomes.
IT & Telecommunications captured 35.75% of the data center networking market in 2025 by virtue of hyperscale cloud, CDN, and telco investments that underpin digital-service delivery. Banking, media streaming, and e-commerce workloads dominate regional consumption across metro campuses.
Manufacturing & Industrial will advance at an 18.05% CAGR through 2031 as predictive-maintenance algorithms migrate from centralized clouds to factory-floor micro-data centers. Low-latency Ethernet fabrics link robotics, machine-vision cameras, and MES applications, cutting downtime and energy waste. Edge-native networking contracts have grown 2.4 times since 2023, underpinning sustained demand for compact, fanless 400 GbE leaf switches.
Complete Report Scope:
- By Component
- Products
- Ethernet Switches
- Routers
- Storage Area Network (SAN)
- Application Delivery Controllers (ADC)
- Network Security Appliances
- Software-Defined Networking (SDN) Controllers
- Optical Interconnects
- Services
- Installation and Integration
- Training and Consulting
- Support and Maintenance
- Managed Network Services
- Products
- By End-User
- IT and Telecommunications
- Banking, Financial Services and Insurance (BFSI)
- Government and Defense
- Media and Entertainment
- Healthcare and Life Sciences
- Manufacturing and Industrial
- Other End-Users
- By Data-Center Type
- Colocation
- Hyperscalers/Cloud Service Providers
- Edge/Micro Data Centers
- By Bandwidth
- Less than 10 GbE
- 25-40 GbE
- 50-100 GbE
- Greater than 100 GbE
- By Geography
- North America
- United States
- Canada
- Mexico
- South America
- Brazil
- Argentina
- Rest of South America
- Europe
- Germany
- United Kingdom
- France
- Netherlands
- Rest of Europe
- Asia-Pacific
- China
- Japan
- India
- South Korea
- Australia and New Zealand
- Rest of Asia-Pacific
- Middle East and Africa
- Middle East
- United Arab Emirates
- Saudi Arabia
- Turkey
- Rest of Middle East
- Africa
- South Africa
- Nigeria
- Rest of Africa
- Middle East
- North America
Geography Analysis
North America controlled 26.05% of 2025 revenue as the data center networking market scaled to support multi-billion-dollar hyperscale expansions. The United States dominates regional capex, while Canadian edge-cloud operators and Mexican near-shore campuses contribute incremental demand. Local equipment manufacturers benefit from favorable tax incentives and ultra-low carbon-intensity power grids.Asia-Pacific is the fastest-growing territory with a 17.55% CAGR through 2031, reflecting sovereign AI strategies that favor domestic processing. China's Eastern-Data-Western-Compute backbone aligns eight desert-region hyperscale hubs with coastal interconnects, driving bulk transceiver procurement. India exceeded 950 MW installed IT load in 2025, triggering step-function demand for 400 GbE fabrics across both colocation and telco edge sites. Markets such as Indonesia and Vietnam reinforce the growth wave with supportive regulatory frameworks and regional subsea-cable investments.
- Cisco Systems Inc.
- Arista Networks Inc.
- Juniper Networks Inc.
- Huawei Technologies Co. Ltd.
- Dell Technologies (Dell EMC)
- Extreme Networks Inc.
- Hewlett Packard Enterprise (HPE)
- Lenovo Group Ltd.
- NEC Corporation
- NVIDIA Corp. (Cumulus and Mellanox)
- Broadcom Inc.
- Intel Corp.
- Fortinet Inc.
- F5 Inc.
- Radware Ltd.
- A10 Networks Inc.
- Check Point Software Technologies
- Palo Alto Networks Inc.
- Array Networks Inc.
- Moxa Inc.
- Supermicro (Super Micro Computer Inc.)
- Edgecore Networks Corp.
- H3C Holding Ltd.
- NetApp Inc.
- Keysight Technologies Inc.
Additional Benefits:
- The market estimate (ME) sheet in Excel format
- 3 months of analyst support
TABLE OF CONTENTS
1 INTRODUCTION
- 1.1 Study Assumptions and Market Definition
- 1.2 Scope of the Study
2 RESEARCH METHODOLOGY
3 EXECUTIVE SUMMARY
4 MARKET LANDSCAPE
- 4.1 Market Overview
- 4.2 Market Drivers
- 4.2.1 Growing cloud?first enterprise IT strategies
- 4.2.2 Surge in East-West traffic owing to AI / ML workloads
- 4.2.3 Edge data-centre build-outs by telecom operators
- 4.2.4 400 GbE port price erosion improves RoI
- 4.2.5 Adoption of lossless Ethernet for accelerated computing
- 4.2.6 Hyperscalers open-source network OS contributions
- 4.3 Market Restraints
- 4.3.1 Multi-vendor interoperability challenges
- 4.3.2 Rising network complexity and skill gaps
- 4.3.3 Supply-chain risk for merchant silicon
- 4.3.4 Escalating data-centre power density limits port upgrades
- 4.4 Supply-Chain Analysis
- 4.5 Regulatory Landscape
- 4.6 Technological Outlook
- 4.7 Porter's Five Forces
- 4.7.1 Threat of New Entrants
- 4.7.2 Bargaining Power of Buyers
- 4.7.3 Bargaining Power of Suppliers
- 4.7.4 Threat of Substitutes
- 4.7.5 Intensity of Competitive Rivalry
- 4.8 Assessment of Macroeocnomic Factors on the Market
5 MARKET SIZE and GROWTH FORECASTS (VALUE)
- 5.1 By Component
- 5.1.1 Products
- 5.1.1.1 Ethernet Switches
- 5.1.1.2 Routers
- 5.1.1.3 Storage Area Network (SAN)
- 5.1.1.4 Application Delivery Controllers (ADC)
- 5.1.1.5 Network Security Appliances
- 5.1.1.6 Software-Defined Networking (SDN) Controllers
- 5.1.1.7 Optical Interconnects
- 5.1.2 Services
- 5.1.2.1 Installation and Integration
- 5.1.2.2 Training and Consulting
- 5.1.2.3 Support and Maintenance
- 5.1.2.4 Managed Network Services
- 5.1.1 Products
- 5.2 By End-User
- 5.2.1 IT and Telecommunications
- 5.2.2 Banking, Financial Services and Insurance (BFSI)
- 5.2.3 Government and Defense
- 5.2.4 Media and Entertainment
- 5.2.5 Healthcare and Life Sciences
- 5.2.6 Manufacturing and Industrial
- 5.2.7 Other End-Users
- 5.3 By Data-Center Type
- 5.3.1 Colocation
- 5.3.2 Hyperscalers/Cloud Service Providers
- 5.3.3 Edge/Micro Data Centers
- 5.4 By Bandwidth
- 5.4.1 Less than 10 GbE
- 5.4.2 25-40 GbE
- 5.4.3 50-100 GbE
- 5.4.4 Greater than 100 GbE
- 5.5 By Geography
- 5.5.1 North America
- 5.5.1.1 United States
- 5.5.1.2 Canada
- 5.5.1.3 Mexico
- 5.5.2 South America
- 5.5.2.1 Brazil
- 5.5.2.2 Argentina
- 5.5.2.3 Rest of South America
- 5.5.3 Europe
- 5.5.3.1 Germany
- 5.5.3.2 United Kingdom
- 5.5.3.3 France
- 5.5.3.4 Netherlands
- 5.5.3.5 Rest of Europe
- 5.5.4 Asia-Pacific
- 5.5.4.1 China
- 5.5.4.2 Japan
- 5.5.4.3 India
- 5.5.4.4 South Korea
- 5.5.4.5 Australia and New Zealand
- 5.5.4.6 Rest of Asia-Pacific
- 5.5.5 Middle East and Africa
- 5.5.5.1 Middle East
- 5.5.5.1.1 United Arab Emirates
- 5.5.5.1.2 Saudi Arabia
- 5.5.5.1.3 Turkey
- 5.5.5.1.4 Rest of Middle East
- 5.5.5.2 Africa
- 5.5.5.2.1 South Africa
- 5.5.5.2.2 Nigeria
- 5.5.5.2.3 Rest of Africa
- 5.5.5.1 Middle East
- 5.5.1 North America
6 COMPETITIVE LANDSCAPE
- 6.1 Market Concentration
- 6.2 Strategic Moves
- 6.3 Market Share Analysis
- 6.4 Company Profiles (includes Global level Overview, Market level overview, Core Segments, Financials as available, Strategic Information, Market Rank/Share for key companies, Products and Services, Recent Developments)
- 6.4.1 Cisco Systems Inc.
- 6.4.2 Arista Networks Inc.
- 6.4.3 Juniper Networks Inc.
- 6.4.4 Huawei Technologies Co. Ltd.
- 6.4.5 Dell Technologies (Dell EMC)
- 6.4.6 Extreme Networks Inc.
- 6.4.7 Hewlett Packard Enterprise (HPE)
- 6.4.8 Lenovo Group Ltd.
- 6.4.9 NEC Corporation
- 6.4.10 NVIDIA Corp. (Cumulus and Mellanox)
- 6.4.11 Broadcom Inc.
- 6.4.12 Intel Corp.
- 6.4.13 Fortinet Inc.
- 6.4.14 F5 Inc.
- 6.4.15 Radware Ltd.
- 6.4.16 A10 Networks Inc.
- 6.4.17 Check Point Software Technologies
- 6.4.18 Palo Alto Networks Inc.
- 6.4.19 Array Networks Inc.
- 6.4.20 Moxa Inc.
- 6.4.21 Supermicro (Super Micro Computer Inc.)
- 6.4.22 Edgecore Networks Corp.
- 6.4.23 H3C Holding Ltd.
- 6.4.24 NetApp Inc.
- 6.4.25 Keysight Technologies Inc.
7 MARKET OPPORTUNITIES and FUTURE OUTLOOK
- 7.1 White-space and Unmet-Need Assessment

 全球資料中心網路市場規模、佔有率、趨勢和成長分析報告(2026-2034)
 北美資料中心網路:市場佔有率分析、產業趨勢與統計及成長預測(2026-2031 年)南美洲資料中心網路:市場佔有率分析、產業趨勢與統計及成長預測(2026-2031 年)印度資料中心網路:市場佔有率分析、產業趨勢與統計及成長預測(2026-2031 年)德國資料中心網路:市場佔有率分析、產業趨勢與統計及成長預測(2026-2031 年)歐洲資料中心網路:市場佔有率分析、產業趨勢與統計及成長預測(2026-2031 年)泰國資料中心網路:市場佔有率分析、產業趨勢與統計及成長預測(2026-2031)美國資料中心網路:市場佔有率分析、產業趨勢與統計及成長預測(2026-2031 年)義大利資料中心網路:市場佔有率分析、產業趨勢與統計及成長預測(2026-2031 年)英國資料中心網路:市場佔有率分析、產業趨勢與統計及成長預測(2026-2031 年)