


 |
市場調查報告書
商品編碼
2119115
英國OTT:市場佔有率分析、產業趨勢與統計、成長預測(2026-2031年)United Kingdom OTT - Market Share Analysis, Industry Trends & Statistics, Growth Forecasts (2026 - 2031) |
||||||

※ 本網頁內容可能與最新版本有所差異。詳細情況請與我們聯繫。
根據 Mordor Intelligence 預測,英國OTT 市場規模將從 2025 年的 235.3 億美元成長到 2026 年的 256.3 億美元,然後在 2031 年達到 365.8 億美元,2026 年至 2031 年的複合年成長率為 7.37%。
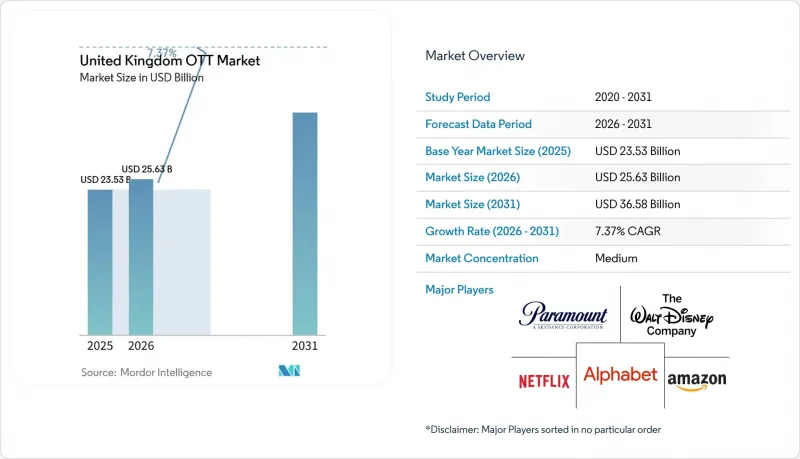
本報告按收入模式(SVOD、AVOD、TVOD、混合模式、訂閱和廣告)、設備類型(智慧型手機和平板電腦、智慧電視等)以及內容類型(電影、電視劇和劇集、紀錄片)進行分類。市場預測以美元計價。
英國OTT市場趨勢與洞察
從線性電視到點播觀看的重大轉變。
與前一年相比,人均每日直播電視觀看時長有所下降。同期,直播和錄影電視節目的每週收視人數也有所下降。這項變化影響了所有年齡層的觀眾,包括老年觀眾,表明這並非僅僅是年輕觀眾取代老年觀眾的問題。廣播公司提供的視訊點播 (VOD) 服務吸收了部分觀眾流失,其每週收視人數和使用時長均有所增加。由於家庭影片觀看總時長下降,英國OTT 市場也面臨日益激烈的競爭。英國通訊管理局 (Ofcom) 的「顯著性框架」透過要求公共廣播公司公司的應用程式在智慧電視介面上保持易於發現,從而支援國內公共廣播服務的發展。這確保了即使全球串流媒體應用程式顯示在裝置的主螢幕上,觀眾也能存取公共廣播服務。
主流OTT平台上的廣告支援套餐越來越受歡迎。
Netflix的廣告支援套餐如今佔據了比以往更高的市場佔有率,在英國用戶中佔據了相當大的比例。 Disney+的廣告支援套餐市場佔有率也有所成長,而Amazon Prime Video的廣告支援選項仍然佔據其英國用戶群的大多數。因此,英國OTT市場格局的形成不僅取決於用戶總數,還越來越受到廣告收入、受眾定向和第一方數據獲取的影響,尤其是在家庭用戶滲透率限制了獲客主導成長的情況下。每個平台都可以透過提供價格較低的廣告支援套餐來留住對價格敏感的用戶,同時為其他家庭用戶保留價格較高的無廣告套餐。據Netflix稱,在提供廣告支援套餐的地區,大多數新用戶選擇的是廣告支援套餐而非高級套餐。這一趨勢表明,儘管廣告支援模式在英國的滲透率已經很高,但仍有成長空間,同時也凸顯了廣告庫存品質和廣告商需求的重要性。
擁有多項訂閱服務的家庭出現“訂閱疲勞”
許多英國家庭使用多種服務,由於重要影片的上映時間各不相同,每月取消訂閱和重新訂閱已成為一種有效的支出管理方式。英國的OTT市場尤其容易受到這種現象的影響,因為像BBC iPlayer、ITVX和Channel 4 Streaming這樣的免費本土服務提供成熟的本地節目,且無需直接訂閱費用。雖然輪換使用付費服務的家庭可能仍然會優先考慮內容,但他們訂閱模式的變化使得平台難以預測收入,並降低了透過促銷活動獲取新用戶的價值。廣播公司隨選視訊(VOD)的觀看量正在成長,凸顯了由廣告收入資助的免費替代服務的重要性。因此,平台需要透過節目內容、套餐選項或有吸引力的捆綁套餐,為用戶提供繼續付費服務的明確理由,即使在重要新片上映和體育賽事之間。捆綁套餐和差異化內容可以緩解這種壓力,但它們並不能消除家庭控制成本的根本需求。
細分市場分析
2025年,訂閱隨選視訊(SVOD)服務佔英國付費串流媒體收入的58.44%,主要由Netflix、Amazon Prime Video、Disney+和Discovery+推動。 2026年第一季在英國家庭用戶佔比達61%,超過Amazon Prime Video的46.1%和Disney+的26.1%。這些服務佔了英國SVOD收入的80%,反映了它們在內容方面的投入、龐大的用戶群體以及較高的家庭用戶認知度。此外,它們的早期擴張也使其在成熟的家庭訂閱市場中佔據了更有利的地位。由於英國OTT市場的用戶數量已經相當可觀,預計營收成長將越來越依賴價格上漲、高級套餐和捆綁套餐,而非新增家庭訂閱用戶。
混合模式(訂閱與廣告結合)預計將在2026年至2031年間以7.96%的複合年成長率成長。廣告支援型套餐旨在留住那些不願付費享受無廣告服務的用戶。國內廣播公司在2025年也將點播觀看業務擴大了9%,進一步鞏固了廣告支援型影片的地位。 TVOD繼續為尋求新片上映和早期數位發行的觀眾提供服務,而像樂天電視這樣的服務則同時採用廣告主導和收費兩種模式。 MUBI透過訂閱和收費兩種模式,在藝術電影和獨立電影領域佔據了獨特的地位,憑藉其精心策劃的片單和獨特的發行策略,使其在大規模主流娛樂服務中脫穎而出。
其他好處:
- Excel格式的市場預測(ME)表
- 3個月的分析師支持
目錄
第1章:引言
- 研究假設和市場定義
- 調查範圍
第2章:調查方法
第3章執行摘要
第4章 市場狀況
- 市場概覽
- 市場促進因素
- 主流OTT平台廣告支援計畫的普及率不斷提高
- 從傳統電視到點播觀看的快速轉變。
- 聯網電視的成長和串流媒體在大螢幕上的觀看方式的擴展。
- 擁有優質體育賽事和本地內容的分發權,有助於提高用戶留存率。
- 訂閱商品搭售和混合盈利模式正在擴大可獲得的收入範圍。
- 平台級個人化和建議引擎正在增加觀看時長。
- 市場限制因素
- 多服務家庭的訂閱疲勞
- 價格敏感度上升和評級下調
- 版權結構的日益碎片化推高了內容獲取成本。
- 對兒童安全、廣告和資料使用的監管。
- 產業價值鏈分析
- 監理情勢
- 技術展望
- 波特五力分析
- 宏觀經濟因素對市場的影響
第5章 市場規模與成長預測
- 按收入模式
- SVOD
- AVOD
- TVOD
- 混合模式、訂閱模式、廣告
- 依設備類型
- 智慧型手機和平板電腦
- 智慧電視
- 筆記型電腦和桌上型電腦
- 其他設備類型
- 按內容類型
- 電影和影像作品
- 電視節目和劇集內容
- 記錄
- 其他內容類型
第6章 競爭情勢
- 市場集中度
- 策略趨勢
- Vendor Positioning Analysis
- 公司簡介
- Netflix, Inc.
- Amazon.com, Inc.
- The Walt Disney Company
- Alphabet Inc.
- British Broadcasting Corporation
- ITV plc
- Comcast Corporation
- Channel Four Television Corporation
- Paramount, a Skydance Corporation
- Warner Bros. Discovery, Inc.
- Apple Inc.
- DAZN Group Limited
- Rakuten Group, Inc.
- Fox Corporation
- Everyone TV Limited
- STV Group plc
- Sony Group Corporation
- Samsung Electronics Co., Ltd.
- MUBI, Inc.
- Plex, Inc.
第7章 市場機會與未來展望
According to Mordor Intelligence, the United Kingdom OTT market size is expected to grow from USD 23.53 billion in 2025 to USD 25.63 billion in 2026 and is forecast to reach USD 36.58 billion by 2031 at 7.37% CAGR over 2026-2031.
This report is Segmented by Revenue Model (SVOD, AVOD, TVOD, and Hybrid, Subscription and Ads), Device Types (Smartphones and Tablets, Smart TVs, and More), Content Genre (Movies and Films, TV Shows and Episodic Content, and Documentaries). The Market Forecasts are Provided in Terms of Value (USD).
United Kingdom OTT Market Trends and Insights
Strong Transition From Linear TV to On-Demand Viewing
Live television viewing declined on a per-person, per-day basis compared with the previous year. Weekly reach for live or recorded broadcast television also declined over the period. The change extended across age groups, including older viewers, which shows that the shift is broader than younger viewers replacing older ones. Broadcaster video-on-demand services partly absorbed this movement, as weekly reach and time spent on these services increased. The United Kingdom OTT market also faces competition for viewing time because total in-home video viewing has declined. Ofcom's prominence framework supports domestic services by requiring public service broadcaster applications to remain easy to find on smart television interfaces, which preserves their access to viewers when device home screens also feature global streaming applications.
Rising Adoption of Ad-Supported Tiers Across Major OTT Platforms
Netflix's ad-supported plan reached a substantial share of its UK subscribers, compared with a lower share previously. Disney+'s corresponding share also increased, while Amazon Prime Video's ad-supported option accounted for most of its UK subscriber base. The United Kingdom OTT market is therefore increasingly shaped by advertising yield, audience targeting, and access to first-party data rather than subscriber totals alone, especially as household penetration limits acquisition-led growth. Platforms can keep price-sensitive viewers in their ecosystems by offering a lower-priced plan with advertising while retaining a higher-priced ad-free option for other households.Netflix reported that a majority of new subscribers in territories with an ad plan chose that option instead of a premium plan. This pattern indicates that the ad-supported model still has room to develop in the UK despite already high adoption, but it also raises the importance of inventory quality and advertiser demand.
Subscription Fatigue Among Multi-Service Households
Many UK households hold several services, which makes monthly cancellation and rejoining a practical way to control spending when major titles are released at different times. The United Kingdom OTT market is exposed to this behavior because free domestic services, including BBC iPlayer, ITVX, and Channel 4 Streaming, provide established local programming without a direct subscription charge. Households that rotate paid services may still value the content, but their changing subscriptions make platform revenue less predictable and reduce the value of promotional acquisition. Broadcaster video-on-demand viewing grew, showing the relevance of free, ad-funded alternatives. Platforms must therefore give viewers clear reasons to maintain a paid service between major releases or sports events, whether through programming, plan choice, or a useful bundle. Bundles and differentiated content can reduce this pressure, but they do not remove the basic need for households to manage costs.
Other drivers and restraints analyzed in the detailed report include:
- Growth of Connected TV and Big-Screen Streaming Consumption
- Premium Sports and Local Content Rights Supporting Subscriber Retention
- Intensifying Price Sensitivity and Tier Downgrades
For complete list of drivers and restraints, kindly check the Table Of Contents.
Segment Analysis
SVOD accounted for 58.44% of UK paid streaming revenue in 2025, supported by Netflix, Amazon Prime Video, Disney+, and Discovery+. Netflix was present in 61% of UK households in Q1 2026, compared with 46.1% for Amazon Prime Video and 26.1% for Disney+. These services accounted for 80% of UK SVOD revenue, reflecting their content investment, established user bases, and household familiarity, and their earlier expansion also gave them a stronger position in a mature household-subscription market. The United Kingdom OTT market has reached a high level of subscriptions, so revenue growth is expected to rely more on price increases, premium plans, and bundles than on new household adoption.
The hybrid subscription-and-ads model is projected to grow at a 7.96% CAGR from 2026 to 2031. Ad-supported plans provide a route for services to retain customers who do not want to pay for an ad-free tier. Domestic broadcaster services also expanded their on-demand viewing by 9% in 2025, reinforcing the role of ad-funded video. TVOD continues to serve viewers seeking new releases and early digital viewing windows, while services such as Rakuten TV operate across advertising and transaction-led formats. MUBI maintains a distinct position across subscription and transaction-led viewing for art-house and independent cinema, where a focused catalog and distinct release strategy separate it from larger general entertainment services.
Complete Report Scope:
- By Revenue Model
- SVOD
- AVOD
- TVOD
- Hybrid, Subscription and Ads
- By Device Type
- Smartphones and Tablets
- Smart TVs
- Laptops and Desktops
- Other Device Types
- By Content Genre
- Movies and Films
- TV Shows and Episodic Content
- Documentaries
- Other Content Genres
List of Companies Covered in this Report:
- Netflix, Inc.
- Amazon.com, Inc.
- The Walt Disney Company
- Alphabet Inc.
- British Broadcasting Corporation
- ITV plc
- Comcast Corporation
- Channel Four Television Corporation
- Paramount, a Skydance Corporation
- Warner Bros. Discovery, Inc.
- Apple Inc.
- DAZN Group Limited
- Rakuten Group, Inc.
- Fox Corporation
- Everyone TV Limited
- STV Group plc
- Sony Group Corporation
- Samsung Electronics Co., Ltd.
- MUBI, Inc.
- Plex, Inc.
Additional Benefits:
- The market estimate (ME) sheet in Excel format
- 3 months of analyst support
TABLE OF CONTENTS
1 INTRODUCTION
- 1.1 Study Assumptions and Market Definition
- 1.2 Scope of the Study
2 RESEARCH METHODOLOGY
3 EXECUTIVE SUMMARY
4 MARKET LANDSCAPE
- 4.1 Market Overview
- 4.2 Market Drivers
- 4.2.1 Rising Adoption of Ad-Supported Tiers Across Major OTT Platforms
- 4.2.2 Strong Transition From Linear TV to On-Demand Viewing
- 4.2.3 Growth of Connected TV and Big-Screen Streaming Consumption
- 4.2.4 Premium Sports and Local Content Rights Supporting Subscriber Retention
- 4.2.5 Subscription Bundling and Hybrid Monetization Expanding Addressable Revenue
- 4.2.6 Platform-Level Personalization and Recommendation Engines Increasing Watch Time
- 4.3 Market Restraints
- 4.3.1 Subscription Fatigue Among Multi-Service Households
- 4.3.2 Intensifying Price Sensitivity and Tier Downgrades
- 4.3.3 Fragmented Rights Landscape Increasing Content Acquisition Costs
- 4.3.4 Regulatory Scrutiny on Children's Safety, Advertising, and Data Use
- 4.4 Industry Value Chain Analysis
- 4.5 Regulatory Landscape
- 4.6 Technological Outlook
- 4.7 Porter's Five Forces Analysis
- 4.7.1 Bargaining Power of Buyers
- 4.7.2 Bargaining Power of Suppliers
- 4.7.3 Threat of New Entrants
- 4.7.4 Threat of Substitutes
- 4.7.5 Industry Rivalry
- 4.8 Impact of Macroeconomic Factors on the Market
5 MARKET SIZE AND GROWTH FORECASTS
- 5.1 By Revenue Model
- 5.1.1 SVOD
- 5.1.2 AVOD
- 5.1.3 TVOD
- 5.1.4 Hybrid, Subscription and Ads
- 5.2 By Device Type
- 5.2.1 Smartphones and Tablets
- 5.2.2 Smart TVs
- 5.2.3 Laptops and Desktops
- 5.2.4 Other Device Types
- 5.3 By Content Genre
- 5.3.1 Movies and Films
- 5.3.2 TV Shows and Episodic Content
- 5.3.3 Documentaries
- 5.3.4 Other Content Genres
6 COMPETITIVE LANDSCAPE
- 6.1 Market Concentration
- 6.2 Strategic Moves
- 6.3 Vendor Positioning Analysis
- 6.4 Company Profiles (includes Global Level Overview, Market Level Overview, Core Segments, Financials as available, Strategic Information, Market Rank/Share, Products and Services, Recent Developments)
- 6.4.1 Netflix, Inc.
- 6.4.2 Amazon.com, Inc.
- 6.4.3 The Walt Disney Company
- 6.4.4 Alphabet Inc.
- 6.4.5 British Broadcasting Corporation
- 6.4.6 ITV plc
- 6.4.7 Comcast Corporation
- 6.4.8 Channel Four Television Corporation
- 6.4.9 Paramount, a Skydance Corporation
- 6.4.10 Warner Bros. Discovery, Inc.
- 6.4.11 Apple Inc.
- 6.4.12 DAZN Group Limited
- 6.4.13 Rakuten Group, Inc.
- 6.4.14 Fox Corporation
- 6.4.15 Everyone TV Limited
- 6.4.16 STV Group plc
- 6.4.17 Sony Group Corporation
- 6.4.18 Samsung Electronics Co., Ltd.
- 6.4.19 MUBI, Inc.
- 6.4.20 Plex, Inc.
7 MARKET OPPORTUNITIES AND FUTURE OUTLOOK
- 7.1 White-Space and Unmet-Need Assessment

 全球Over-The-Top服務市場規模、佔有率、趨勢和成長分析報告(2026-2034年)
 商業媒體服務:市場佔有率分析、產業趨勢與統計、成長預測(2026-2031 年)美國OTT:市場佔有率分析、行業趨勢和統計數據、成長預測(2026-2031年)雲端OTT:市場佔有率分析、產業趨勢與統計、成長預測(2026-2031年)中國OTT市場:市場佔有率分析、產業趨勢與統計及成長預測(2026-2031年)印度OTT市場:市場佔有率分析、產業趨勢與統計及成長預測(2026-2031年)德國OTT:市場佔有率分析、產業趨勢與統計及成長預測(2026-2031年)OTT(Over The Top):市場佔有率分析、產業趨勢與統計數據、成長預測(2026-2031)北美OTT:市佔率分析、產業趨勢與統計及成長預測(2026-2031年)OTT機上盒:市場佔有率分析、產業趨勢與統計及成長預測(2026-2031年)