


 |
市場調查報告書
商品編碼
2124570
美國OTT:市場佔有率分析、行業趨勢和統計數據、成長預測(2026-2031年)United States OTT - Market Share Analysis, Industry Trends & Statistics, Growth Forecasts (2026 - 2031) |
||||||

※ 本網頁內容可能與最新版本有所差異。詳細情況請與我們聯繫。
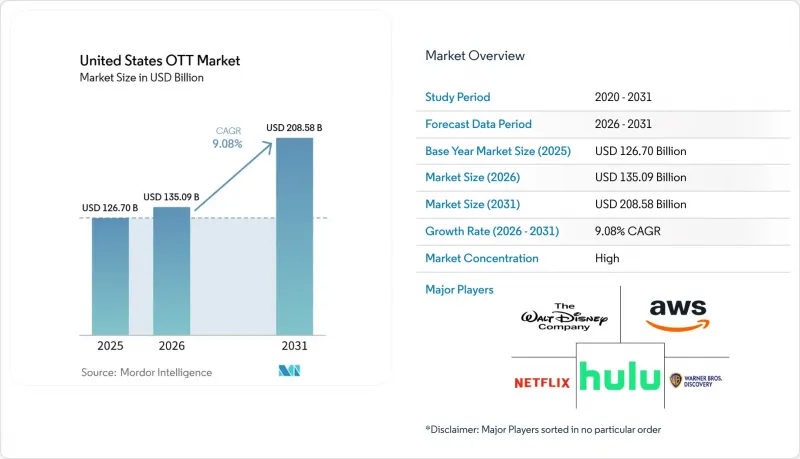
根據 Mordor Intelligence 預測,美國 OTT 市場規模預計在 2026 年達到 1,350.9 億美元,到 2031 年將擴大到 2085.8 億美元,年複合成長率為 9.08%。
本報告按收入模式(SVOD、TVOD、AVOD 以及訂閱與廣告混合模式)、設備類型(智慧型手機和平板電腦、智慧型電視、筆記型電腦和桌上型電腦、遊戲機、機上盒和串流媒體裝置)以及內容類型(電影、電視劇和劇集、紀錄片和其他內容類型)進行分類。市場預測以美元計價。
美國OTT市場趨勢與洞察
美國家庭「停掉有線電視服務」(放棄有線電視服務)的現像日益增多,加速了直接面對消費者(DTC)產品的普及。
到2025年,未訂閱付費電視的家庭數量將超過訂閱付費電視的家庭數量,使得「剪線族」(停掉有線電視服務 cutting )成為塑造美國OTT市場格局的關鍵因素。根據影片廣告局(Video Advertising Bureau)統計,2025年將有7,720萬戶家庭取消了停掉有線電視服務,預計到2026年底,這一數字將達到8,070萬。截至2025年12月,串流媒體占美國電視總觀看時間的47.5%,有線電視佔20.2%,地面電波廣播佔21.4%。每個取消傳統付費電視訂閱的家庭都將成為一項或多項OTT服務的直接用戶。這種轉變使平台對收費、套餐選擇和廣告曝光有更大的控制權。此外,由於消費者可以更輕鬆地更換服務供應商,客戶維繫也變得越來越重要。
光纖和5G網路的快速擴張將實現更高品質的串流媒體播放。
寬頻品質的提升透過提高高清影片串流的可靠性,為美國OTT市場提供了支援。固網和無線連線速度的提高將減少緩衝,並有望提高4K內容的觀看完成率。更佳的觀看體驗將減少因服務品質不佳而導致的用戶流失,並為聯網電視服務騰出更多廣告空間。光纖和固定無線存取將使優質串流媒體服務能夠擴展到郊區和農村地區,在這些地區,傳統的有線電視網路難以提供穩定、高頻寬的觀賞體驗。美國聯邦通訊委員會(FCC)將繼續支持農村地區的寬頻發展和基礎設施擴建。如果平台能夠提供滿足新接取家庭需求的服務和內容,這些投資可望在預測期內擴大服務所涵蓋的家庭數量。
內容授權成本不斷上漲以及對優質IP的競爭正在給利潤率帶來壓力。
內容授權成本仍是美國OTT市場面臨的一大限制因素。 Netflix和SONY影視娛樂於2026年1月簽署了一項價值超過70億美元的全球「一次性付費」授權合約。同時,迪士尼將其2026會計年度的內容預算增加了10億美元,達到240億美元,並指出NBA轉播權是主要因素。這些舉措表明,優質IP、院線發行權和體育賽事直播對大型平台仍然至關重要。新的AVC(H.264)串流收費系統也可能增加大規模平台的年度固定成本。小規模的服務提供者可能缺乏足夠的規模,無法將內容和技術成本分攤到大量用戶身上。各平台都在透過定價、廣告收入、嚴格的內容支出控制、授權合作和收購來應對這些挑戰。
細分市場分析
到2025年,SVOD將佔據美國OTT市場51.75%的佔有率,成為最大的收入模式。月度定期訂閱在平台經濟中仍扮演核心角色,提供穩定的收入來源。連續劇和龐大的內容庫支援在後續發行中重複利用熱門影片。迪士尼推出的Disney+、Hulu和ESPN+的29.99美元/月捆綁套餐,展示了服務整合如何提升每個家庭的價值。報告顯示,自2026年1月以來,該捆綁方案已在美國新增1,100萬用戶。 TVOD則迎合了那些更傾向於按影片或實況活動付費,而非簽訂長期服務合約的觀眾。隨著訂閱服務更快地在其片庫中添加新片,TVOD的作用正變得越來越有限。
結合訂閱和廣告的混合模式正在改變各大平台服務不同預算家庭的方式。根據一份草案,預計到2026年,80.4%的OTT用戶將至少使用一項廣告支援的訂閱服務,高於2024年的71.5%。 AVOD(廣告支援的隨選視訊)是成長最快的營收模式,預計到2031年,美國OTT市場的AVOD規模將以9.71%的複合年成長率成長。影片廣告局預測,到2026年,美國將有2.094億AVOD用戶。 FAST(廣告支援的隨選視訊)用戶預計到2026年也將超過1.25億。這種規模化成長將吸引廣告商,為內容採購提供資金,並提升免費或低成本服務的吸引力。正如Netflix自身的廣告平台所展示的那樣,各大訂閱服務如今正將廣告基礎設施定位為一項策略性功能。
其他好處:
- Excel格式的市場預測(ME)表
- 3個月的分析師支持
目錄
第1章:引言
- 研究假設和市場定義
- 調查範圍
第2章:調查方法
第3章執行摘要
第4章 市場狀況
- 市場概覽
- 市場促進因素
- 美國家庭「停掉有線電視服務」(放棄有線電視服務)的現像日益增多,加速了D2C(直接面對消費者)業務的擴張。
- 光纖和5G網路的快速擴張將實現更高品質的串流媒體播放。
- 向廣告模式和混合模式的轉變正在擴大受眾群體。
- 針對多元文化社區和宗教團體的利基SVOD服務的興起,正在吸引新的用戶群體。
- 各州針對本州原創內容製作提供的稅收優惠政策正在降低成本門檻。
- 人工智慧驅動的超個人化功能的引入提高了平均觀看時長和用戶留存率。
- 市場限制因素
- 內容授權成本不斷上漲以及對優質IP的競爭正在給利潤率帶來壓力。
- 市場飽和和用戶流失率高,原因是轉換成本低。
- 應用程式過剩降低了內容的可發現性,並減少了用戶參與度。
- 對串流媒體工作負載碳足跡的審查日益嚴格,為監管帶來了阻力。
- 產業價值鏈分析
- 監理展望
- 宏觀經濟因素對市場的影響
- 技術展望
- 波特五力分析
第5章 市場規模與成長預測
- 按收入模式
- SVOD
- TVOD
- AVOD
- 混合模式(訂閱與廣告結合)
- 依設備類型
- 智慧型手機和平板電腦
- 智慧電視
- 筆記型電腦和桌上型電腦
- 遊戲機
- 機上盒和串流媒體裝置
- 按內容類型
- 電影和影像作品
- 電視節目和劇集內容
- 記錄
- 其他內容類型
第6章 競爭情勢
- 市場集中度
- 策略趨勢
- 市佔率分析
- 公司簡介
- Netflix, Inc.
- The Walt Disney Company
- Amazon.com, Inc.
- Hulu, LLC(The Walt Disney Company)
- Warner Bros. Discovery, Inc.
- Comcast Corporation
- Paramount Global
- Apple Inc.
- Roku, Inc.
- Google LLC
- DISH Network Corporation(EchoStar Corporation)
- FuboTV Inc.
- Fox Corporation
- Crunchyroll, LLC(Sony Group Corporation)
- BritBox LLC
- Starz Entertainment, LLC(Lions Gate Entertainment Corp.)
- ESPN+(The Walt Disney Company)
- AMC Networks Inc.
第7章 市場機會與未來展望
According to Mordor Intelligence, the United States OTT market size reached USD 135.09 billion in 2026 and is projected to climb to USD 208.58 billion by 2031, advancing at an 9.08% CAGR.
This report is Segmented by Revenue Model (SVOD, TVOD, AVOD, and Hybrid Subscription and Ads), Device Type (Smartphones and Tablets, Smart TVs, Laptops and Desktops, Game Consoles, and Set-Top Boxes and Media Streamers), and Content Genre (Movies and Films, TV Shows and Episodic Content, Documentaries, and Other Content Genres). The Market Forecasts are Provided in Terms of Value (USD).
United States OTT Market Trends and Insights
Rising Cord-Cutting Rates Among US Households Accelerate Direct-to-Consumer Adoption
Cord-cutting became a defining force for the United States OTT market in 2025, when non-pay-TV households outnumbered pay-TV households. The Video Advertising Bureau reported that 77.2 million US households had cut the cord in 2025, and it expects the total to reach 80.7 million by the end of 2026. Streaming accounted for 47.5% of total US television viewing in December 2025, compared with 20.2% for cable and 21.4% for broadcast. Each household that leaves traditional pay television becomes a direct customer of one or more OTT services. The change gives platforms more control over billing, plan selection, and advertising exposure. It also makes retention more important, as consumers can switch providers with little effort.
Rapid Expansion of Fiber and 5G Networks Enables Higher-Quality Streaming
Broadband quality supports the United States OTT market by improving the reliability of high-resolution video delivery. Faster fixed and wireless connections reduce buffering and can improve completion rates for 4K programming. Better viewing experiences can reduce cancellations caused by poor service quality and increase advertising inventory on connected television services. Fiber and fixed wireless access can extend premium streaming to exurban and rural areas where legacy cable networks may not support consistent high-bandwidth viewing. The Federal Communications Commission has continued to direct broadband support toward rural coverage and infrastructure expansion. These investments can enlarge the addressable household base over the forecast period if platforms offer services and content that meet the needs of newly connected households.
Growing Content Licensing Costs and Competition for Premium IP Squeeze Margins
Content licensing costs remain a significant restraint on the United States OTT market. Netflix and Sony Pictures Entertainment finalized a global Pay-1 licensing agreement valued above USD 7 billion in January 2026, while Disney increased its fiscal 2026 content budget by USD 1 billion to USD 24 billion, with NBA rights identified as a major driver. These commitments show the continuing importance of premium franchises, theatrical rights, and live sports to leading platforms. New AVC, or H.264, streaming fee structures can also add fixed annual expenses for large platforms. Smaller services may lack the scale needed to spread content and technology costs across a large subscriber base. Platforms are responding through pricing, advertising income, disciplined content spending, licensing partnerships, and acquisitions.
Other drivers and restraints analyzed in the detailed report include:
- Shift Toward Ad-Supported and Hybrid Models Expands Audience Reach
- Niche SVOD Services Targeting Multicultural and Faith-Based Audiences Unlock New Subscriber Pools
- Market Saturation and Subscriber Churn Fueled by Low Switching Costs
For complete list of drivers and restraints, kindly check the Table Of Contents.
Segment Analysis
SVOD held 51.75% of the United States OTT market share in 2025, making it the largest revenue model. Recurring monthly subscriptions remain central to platform economics because they provide a predictable revenue base. Serialized programming and broad content libraries support reuse across major releases. Disney's USD 29.99 monthly bundle for Disney+, Hulu, and ESPN+ illustrates how combined services can increase value for households. The bundle reportedly added 11 million domestic subscribers since January 2026. TVOD serves viewers who prefer to pay for individual titles or live events rather than maintain a recurring service. Its role is more limited as subscription services move recent releases into their catalogs faster.
Hybrid subscription and advertising plans are changing the way leading platforms serve households across different budgets. The draft states that 80.4% of sub-OTT viewers are expected to have at least 1 advertising-supported subscription in 2026, compared with 71.5% in 2024. AVOD is the fastest-growing revenue model, with the United States OTT market size for AVOD projected to expand at a 9.71% CAGR through 2031. The Video Advertising Bureau projects that there will be 209.4 million AVOD viewers in the United States in 2026. FAST viewership is also projected to exceed 125 million viewers in 2026. Greater scale can attract advertisers, fund content acquisitions, and improve the appeal of free or low-cost services. Netflix's in-house advertising platform shows that the largest subscription services now treat advertising infrastructure as a strategic capability.
Complete Report Scope:
- By Revenue Model
- SVOD
- TVOD
- AVOD
- Hybrid Subscription and Ads
- By Device Type
- Smartphones and Tablets
- Smart TVs
- Laptops and Desktops
- Game Consoles
- Set-Top Boxes and Media Streamers
- By Content Genre
- Movies and Films
- TV Shows and Episodic Content
- Documentaries
- Other Content Genres
List of Companies Covered in this Report:
- Netflix, Inc.
- The Walt Disney Company
- Amazon.com, Inc.
- Hulu, LLC (The Walt Disney Company)
- Warner Bros. Discovery, Inc.
- Comcast Corporation
- Paramount Global
- Apple Inc.
- Roku, Inc.
- Google LLC
- DISH Network Corporation (EchoStar Corporation)
- FuboTV Inc.
- Fox Corporation
- Crunchyroll, LLC (Sony Group Corporation)
- BritBox LLC
- Starz Entertainment, LLC (Lions Gate Entertainment Corp.)
- ESPN+ (The Walt Disney Company)
- AMC Networks Inc.
Additional Benefits:
- The market estimate (ME) sheet in Excel format
- 3 months of analyst support
TABLE OF CONTENTS
1 INTRODUCTION
- 1.1 Study Assumptions and Market Definition
- 1.2 Scope of the Study
2 RESEARCH METHODOLOGY
3 EXECUTIVE SUMMARY
4 MARKET LANDSCAPE
- 4.1 Market Overview
- 4.2 Market Drivers
- 4.2.1 Rising Cord-Cutting Rates Among US Households Accelerating Direct-to-Consumer Adoption
- 4.2.2 Rapid Expansion of Fiber and 5G Networks Enabling Higher-Quality Streaming
- 4.2.3 Shift Toward Ad-Supported and Hybrid Models Expanding Audience Reach
- 4.2.4 Emergence of Niche SVOD Services Targeting Multicultural and Faith-Based Audiences Unlocking New Subscriber Pools
- 4.2.5 Tax Incentive Programs by States for In-State Original Content Production Lowering Cost Barriers
- 4.2.6 Adoption of AI-Powered Hyper-Personalization Increasing Average Watch Time and Retention
- 4.3 Market Restraints
- 4.3.1 Growing Content Licensing Costs and Competition for Premium IP Squeezing Margins
- 4.3.2 Market Saturation and Subscriber Churn Fueled by Low Switching Costs
- 4.3.3 Declining Content Discoverability Amid App Overload Reducing Engagement
- 4.3.4 Rising Carbon Footprint Scrutiny of Streaming Workloads Triggering Regulatory Headwinds
- 4.4 Industry Value Chain Analysis
- 4.5 Regulatory Outlook
- 4.6 Impact of Macroeconomic Factors on the Market
- 4.7 Technological Outlook
- 4.8 Porter's Five Forces Analysis
- 4.8.1 Bargaining Power of Suppliers
- 4.8.2 Bargaining Power of Buyers
- 4.8.3 Threat of New Entrants
- 4.8.4 Threat of Substitutes
- 4.8.5 Intensity of Competitive Rivalry
5 MARKET SIZE AND GROWTH FORECASTS (VALUE)
- 5.1 By Revenue Model
- 5.1.1 SVOD
- 5.1.2 TVOD
- 5.1.3 AVOD
- 5.1.4 Hybrid Subscription and Ads
- 5.2 By Device Type
- 5.2.1 Smartphones and Tablets
- 5.2.2 Smart TVs
- 5.2.3 Laptops and Desktops
- 5.2.4 Game Consoles
- 5.2.5 Set-Top Boxes and Media Streamers
- 5.3 By Content Genre
- 5.3.1 Movies and Films
- 5.3.2 TV Shows and Episodic Content
- 5.3.3 Documentaries
- 5.3.4 Other Content Genres
6 COMPETITIVE LANDSCAPE
- 6.1 Market Concentration
- 6.2 Strategic Moves
- 6.3 Market Share Analysis
- 6.4 Company Profiles (includes Global Level Overview, Market Level Overview, Core Segments, Financials as Available, Strategic Information, Market Rank/Share for Key Companies, Products and Services, and Recent Developments)
- 6.4.1 Netflix, Inc.
- 6.4.2 The Walt Disney Company
- 6.4.3 Amazon.com, Inc.
- 6.4.4 Hulu, LLC (The Walt Disney Company)
- 6.4.5 Warner Bros. Discovery, Inc.
- 6.4.6 Comcast Corporation
- 6.4.7 Paramount Global
- 6.4.8 Apple Inc.
- 6.4.9 Roku, Inc.
- 6.4.10 Google LLC
- 6.4.11 DISH Network Corporation (EchoStar Corporation)
- 6.4.12 FuboTV Inc.
- 6.4.13 Fox Corporation
- 6.4.14 Crunchyroll, LLC (Sony Group Corporation)
- 6.4.15 BritBox LLC
- 6.4.16 Starz Entertainment, LLC (Lions Gate Entertainment Corp.)
- 6.4.17 ESPN+ (The Walt Disney Company)
- 6.4.18 AMC Networks Inc.
7 MARKET OPPORTUNITIES AND FUTURE OUTLOOK
- 7.1 White-Space and Unmet-Need Assessment

 全球Over-The-Top服務市場規模、佔有率、趨勢和成長分析報告(2026-2034年)
 商業媒體服務:市場佔有率分析、產業趨勢與統計、成長預測(2026-2031 年)英國OTT:市場佔有率分析、產業趨勢與統計、成長預測(2026-2031年)雲端OTT:市場佔有率分析、產業趨勢與統計、成長預測(2026-2031年)中國OTT市場:市場佔有率分析、產業趨勢與統計及成長預測(2026-2031年)印度OTT市場:市場佔有率分析、產業趨勢與統計及成長預測(2026-2031年)德國OTT:市場佔有率分析、產業趨勢與統計及成長預測(2026-2031年)OTT(Over The Top):市場佔有率分析、產業趨勢與統計數據、成長預測(2026-2031)北美OTT:市佔率分析、產業趨勢與統計及成長預測(2026-2031年)OTT機上盒:市場佔有率分析、產業趨勢與統計及成長預測(2026-2031年)