


 |
市場調查報告書
商品編碼
2119245
商業媒體服務:市場佔有率分析、產業趨勢與統計、成長預測(2026-2031 年)Commerce Media Services - Market Share Analysis, Industry Trends & Statistics, Growth Forecasts (2026 - 2031) |
||||||

※ 本網頁內容可能與最新版本有所差異。詳細情況請與我們聯繫。
根據 Mordor Intelligence 預測,商業媒體服務市場規模將從 2025 年的 113.2 億美元和 2026 年的 123.4 億美元成長到 2031 年的 198.1 億美元,2026 年至 2031 年的複合年成長率為 9.92%。
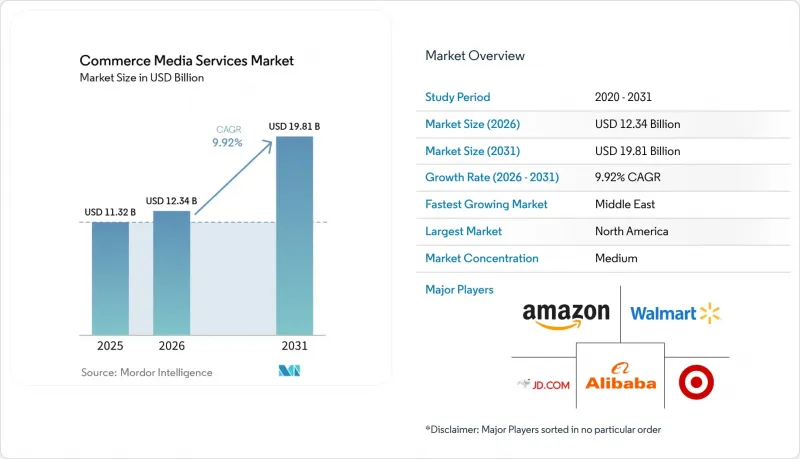
本報告按平台所有權模式(自有自營、第三方網路、整合電商媒體平台、白牌平台)、廣告形式(產品推廣廣告和搜尋廣告、展示廣告、影片廣告、原生廣告和購物廣告、音訊廣告、數位戶外廣告和交通廣告)以及地區(北美等)進行細分。市場預測以美元計價。
全球商業媒體服務市場趨勢與洞察
在第三方 Cookie 遺失後,如何利用第一方資料獲利
隨著第三方識別碼的減少,第一方購買和忠誠度數據在電商媒體服務市場的重要性日益凸顯。零售商可以利用用戶許可的交易訊號,在其數位資產中實現精準定位和效果衡量。 IAB預測,到2026年,電商媒體市場的成長率將達到12.1%,並將這一前景與第一方數據生態系統的持續發展和重複購買的增加聯繫起來。這使得零售商能夠取得開放網路發布商在沒有直接交易關係的情況下無法複製的資料資產。小規模零售商還可以利用特定品類的忠誠度數據,例如在藥局和特色食品領域,相關性比受眾規模更為重要。因此,電商媒體服務市場能夠支援更多細分領域的網路,為廣告主提供清晰的客戶背景和可衡量的購買結果。
透過高毛利率媒體收入擴大利潤率
隨著零售商核心業務面臨盈利壓力,媒體收入已成為一項重要的策略收入來源。沃爾瑪的全球廣告收入實現了強勁成長,其在美國的沃爾瑪互聯(Walmart Connect)收入也顯著提升。這一業績促使零售商利用廣告收入實現門市數位化、開發忠誠度計畫並投資數據基礎設施。對於淨利率普遍較低的食品零售商而言,發展能夠利用客戶數據和現有數位流量的媒體業務具有強大的動力。這種模式可望增強電商媒體服務市場,因為對廣告工具的投資也能提升零售商的銷售能力和衡量宣傳活動效果的能力。此外,它還可能進一步拉大已建立有效數位化客戶關係的零售商與尚未建立此類關係的零售商之間的差距。
測量和報告標準的碎片化
缺乏通用的報告標準仍是電商媒體服務市場的一大限制。 IAB Europe 的一項調查顯示,許多受訪者認為缺乏標準化和網路分散化是零售媒體發展的主要障礙。每個平台在定義廣告支出回報率 (ROAS)、歸因週期和處理瀏覽後廣告活動方面都採用不同的標準。這些差異使得跨零售商的預算編制變得困難,並增加了廣告主和代理商的人工工作量。 IAB Europe 的電商媒體指標 (Commerce Media Metrics) 和 IAB 的 Project EIDOS 為更一致的報告提供了一個框架;然而,它們的採用仍然不均衡,尤其是在工程能力有限且業務遍及多個司法管轄區的小規模網路中。
細分市場分析
到2025年,亞馬遜憑藉其獨有的購買、忠誠度、瀏覽和店內行為數據,自有網路將佔據電商媒體服務市場43.80%的佔有率。它與消費者的直接聯繫使其能夠實現第三方供應商無法以類似方式複製的閉合迴路衡量。這項特性使廣告主能夠將宣傳活動活動與銷售績效關聯起來,並評估廣告投放的價值。亞馬遜也表示,「贊助商品」仍然是其最大的廣告服務。據該公司稱,與不支援的設定相比,使用其「廣告代理商」可降低每次展示成本 (CPM) 和每次轉換成本 (CPA)。美國和歐洲對贊助排名做法的監管審查可能會限制大型網路的獲利擴張。這將為中型營運商提供在透明度、品牌安全和客戶體驗方面參與競爭的機會。
預計整合型電商媒體平台將實現最快成長,2026年至2031年的複合年成長率(CAGR)將達到10.89%。這種模式將品牌自有網站、外部網站和實體店的廣告資源整合到一個統一的購買和衡量環境中。品牌可以利用這些平台規劃貫穿整個電商流程多個階段的宣傳活動,而無需為每個管道單獨使用工具。這種方法降低了因孤立的內部網路和分散的第三方資源而導致的營運複雜性。第三方網路的重要性也日益凸顯,因為它們整合了中型零售商的廣告資源,並透過單一的需求端平台(DSP)連線提供存取權。這種機制使快速消費品(FMCG)廣告商能夠在雜貨店、藥局和便利商店接觸到不同的顧客群體,同時有效管理重疊區域。白牌賦能平台雖然在直接收入方面仍處於較低水平,但為沒有內部廣告技術團隊的零售商提供了技術基礎。這些平台的出現可望拓展中東、東南亞和非洲地區的電商媒體服務市場。
區域分析
到2025年,北美將佔據商業媒體服務市場佔有率的39.00%。美國零售媒體廣告支出顯著成長,預計將持續擴大。其中,異地廣告佔了相當大的比例。沃爾瑪透過通用技術和平台整合了「Walmart Connect Us」、「Walmart Connect International」和「Sam's Club」。
亞太地區是電商媒體服務市場第二大區域叢集。阿里巴巴旗下的阿里媽媽平台和京東的京準通系統在中國建構了一個大規模的生態系統,由阿里巴巴和京東組成的聯盟正在為零售業提供大量即時補貼。日本國內零售媒體產業也實現了顯著的年成長。谷歌日本和波士頓顧問公司(BCG)預測,店內零售媒體可望實現長期的顯著成長。在歐洲,隨著零售商建立授權管理和無塵室功能,市場正在不斷擴張,而家樂福Links擁有龐大的交易記錄和全球基本客群。
預計中東將成為成長最快的地區,預測期內複合年成長率將達到10.81%。 IAB MENA報告顯示,波灣合作理事會(GCC)成員國中存在多個活躍的零售媒體網路。在南美,MercadoLibre的美元計價廣告收入實現了強勁的年成長。非洲市場仍處於起步階段,但Criteo和Masmart已在南非推出了贊助商品廣告和站內展示廣告。這些發展正在將電商媒體服務市場拓展到零售系統,而行動效果廣告在這些系統中正變得日益重要。
其他好處:
- Excel格式的市場預測(ME)表
- 3個月的分析師支持
目錄
第1章:引言
- 研究假設和市場定義
- 調查範圍
第2章:調查方法
第3章執行摘要
第4章 市場狀況
- 市場概覽
- 宏觀經濟因素對市場的影響
- 市場促進因素
- 在第三方 Cookie 遺失後,如何利用第一方資料獲利
- 透過高毛利率媒體收入擴大利潤率
- 封閉回路型測量和增量性驗證
- 異地及全通路部署至連網電視及社群媒體。
- 旅遊酒店預訂平台進軍電商媒體市場。
- 潔淨室中的協作會導致非內源性支出的產生。
- 市場限制因素
- 測量和報告標準的差異
- 廣告加載飽和導致消費者體驗下降
- 贊助排名的透明度和反壟斷審查
- 產業特定目錄與ID之間的互通性差距
- 產業價值鏈分析
- 監理情勢
- 技術展望
- 波特五力分析
第5章 市場規模與成長預測
- 按平台所有權模式
- 公司擁有和經營的網路
- 第三方網路
- 整合商務媒體平台
- 白牌相容平台
- 廣告格式
- 贊助商品和贊助搜尋廣告
- 展示廣告
- 影片廣告(含聯網電視廣告)
- 原生廣告和有購物功能的內容廣告
- 音訊廣告
- 數位戶外廣告 (DOOH) 和公共交通廣告
- 按地區
- 北美洲
- 美國
- 加拿大
- 墨西哥
- 南美洲
- 巴西
- 阿根廷
- 智利
- 其他南美國家
- 歐洲
- 德國
- 英國
- 法國
- 義大利
- 西班牙
- 俄羅斯
- 荷蘭
- 北歐的
- 其他歐洲國家
- 亞太地區
- 中國
- 日本
- 印度
- 韓國
- 澳洲
- 東南亞
- 其他亞太國家
- 中東
- 沙烏地阿拉伯
- 阿拉伯聯合大公國
- 土耳其
- 以色列
- 其他中東國家
- 非洲
- 南非
- 埃及
- 奈及利亞
- 肯亞
- 其他非洲國家
- 北美洲
第6章 競爭情勢
- 市場集中度
- 策略趨勢
- 市佔率分析
- 公司簡介
- Amazon.com, Inc.
- Alibaba Group Holding Limited
- JD.com, Inc.
- Walmart Inc.
- Target Corporation
- The Kroger Co.
- Maplebear Inc.
- DoorDash, Inc.
- Uber Technologies, Inc.
- Criteo SA
- Publicis Groupe SA
- Albertsons Companies, Inc.
- Koninklijke Ahold Delhaize NV
- Carrefour SA
- Tesco PLC
- MercadoLibre, Inc.
- eBay Inc.
- Booking Holdings Inc.
- Expedia Group, Inc.
- Marriott International, Inc.
第7章 市場機會與未來展望
According to Mordor Intelligence, the commerce media services market size is projected to expand from USD 11.32 billion in 2025 and USD 12.34 billion in 2026 to USD 19.81 billion by 2031, registering a CAGR of 9.92% between 2026 to 2031.
This report is Segmented by Platform Ownership Model (Owned and Operated, Third-Party Networks, Integrated Commerce Media Platforms, White-Label Enablement Platforms), Advertising Format (Sponsored Products and Search Ads, Display Ads, Video Ads, Native and Shoppable, Audio Ads, DOOH and In-Transit Ads), and Geography (North America, and More). The Market Forecasts are Provided in Terms of Value (USD).
Global Commerce Media Services Market Trends and Insights
First-Party Data Monetization After Third-Party Cookie Loss
The decline of third-party identifiers has made first-party purchase and loyalty data more important to the commerce media services market. Retailers can use consented transaction signals to support targeting and measurement within their own digital properties. IAB projected 12.1% commerce media growth in 2026 and linked the outlook to the continued development of first-party data ecosystems and repeat purchases. This position gives retailers a data asset that open-web publishers cannot replicate without direct transactional relationships. Smaller retailers can also use category-specific loyalty data in areas such as pharmacy and specialty food, where relevance may matter more than audience scale. The commerce media services market can therefore support narrower networks that offer advertisers a defined customer context and measurable purchase outcomes.
Margin Expansion From High-Gross-Margin Media Revenue
Media income has become a strategic revenue stream for retailers as their core operations face profitability pressure. Walmart reported strong growth in global advertising revenue, while Walmart Connect U.S. revenue also grew significantly. This performance has encouraged retailers to use advertising to fund store digitization, loyalty program development, and data infrastructure. Grocery retailers, which typically operate with lower net margins, have a strong incentive to develop media businesses that leverage customer data and existing digital traffic. This model can strengthen the commerce media services market, as investments in advertising tools also enhance retailers' ability to sell and measure campaigns. It may also widen the gap between retailers with meaningful digital customer relationships and those that have not yet developed them.
Fragmented Measurement and Reporting Standards
The absence of a common reporting standard remains a material constraint for the commerce media services market. IAB Europe found that many respondents identified a lack of standardization and network fragmentation as significant barriers to retail media growth. Platforms use different return-on-ad-spend definitions, attribution windows, and treatments of view-through activity. These differences make cross-retailer budget decisions more difficult and can increase manual work for advertisers and agencies. IAB Europe's Commerce Media Measurement Standards and IAB's Project Eidos offer frameworks for more consistent reporting. Adoption is still uneven, particularly among smaller networks that have limited engineering capacity and operate across multiple jurisdictions.
Other drivers and restraints analyzed in the detailed report include:
- Closed-Loop Measurement and Incrementality Proof
- Offsite and Full-Funnel Expansion Into CTV and Social
- Ad Load Saturation and Shopper Experience Erosion
For complete list of drivers and restraints, kindly check the Table Of Contents.
Segment Analysis
Owned and Operated Networks held 43.80% of commerce media services market share in 2025, supported by their exclusive access to purchase, loyalty, browsing, and in-store behavior data. Their direct relationship with the shopper supports closed-loop measurement that third-party providers cannot reproduce in the same way. This feature helps advertisers connect campaign activity with sales outcomes and evaluate the value of placements. Amazon also stated that Sponsored Products remained its largest advertising offering. Its Ads Agent reduced cost per impression and cost per acquisition compared with an unassisted setup, according to the company. Regulatory scrutiny of sponsored ranking practices in the United States and Europe may limit how far the largest networks can increase monetization. This gives mid-tier operators an opening to compete on transparency, brand safety, and customer experience.
Integrated Commerce Media Platforms are projected to record the fastest growth at a CAGR of 10.89% from 2026 to 2031. Their model brings onsite, offsite, and in-store inventory into one buying and measurement environment. Brands can use these platforms to plan campaigns across several stages of the commerce journey without relying on separate tools for each channel. This approach can reduce the operational complexity created by isolated owned networks and fragmented third-party supply. Third-Party Networks are also gaining relevance because they aggregate mid-market retailer inventory and provide access through a single demand-side platform connection. That structure can help consumer packaged goods advertisers reach grocery, pharmacy, and convenience retail audiences while managing duplication. White-Label Enablement Platforms remain smaller by direct revenue, but they provide the technical foundation for retailers that lack internal advertising technology teams. Their presence can widen participation in the commerce media services market across the Middle East, Southeast Asia, and Africa.
Complete Report Scope:
- By Platform Ownership Model
- Owned and Operated Networks
- Third-Party Networks
- Integrated Commerce Media Platforms
- White-Label Enablement Platforms
- By Advertising Format
- Sponsored Products and Sponsored Search Ads
- Display Ads
- Video Ads (including Connected TV)
- Native and Shoppable Content Ads
- Audio Ads
- Digital Out-of-Home (DOOH) and In-Transit Ads
- By Geography
- North America
- United States
- Canada
- Mexico
- South America
- Brazil
- Argentina
- Chile
- Rest of South America
- Europe
- Germany
- United Kingdom
- France
- Italy
- Spain
- Russia
- Netherlands
- Nordics
- Rest of Europe
- Asia-Pacific
- China
- Japan
- India
- South Korea
- Australia
- Southeast Asia
- Rest of Asia-Pacific
- Middle East
- Saudi Arabia
- United Arab Emirates
- Turkey
- Israel
- Rest of Middle East
- Africa
- South Africa
- Egypt
- Nigeria
- Kenya
- Rest of Africa
- North America
Geography Analysis
North America held 39.00% of the commerce media services market share in 2025. U.S. retail media advertising spending has grown significantly and is expected to continue expanding. Offsite activation represents a meaningful share of this total. Walmart is aligning Walmart Connect U.S., Walmart Connect International, and Sam's Club through shared technology and platforms.
Asia-Pacific is the second-largest regional cluster within the commerce media services market. Alibaba's Alimama platform and JD.com's Jingzhuntong system anchor a large ecosystem in China, where a coalition including Alibaba and JD.com committed substantial instant retail subsidies. Japan's domestic retail media sector expanded significantly year over year. Google Japan and BCG estimated that in-store retail media could grow substantially over the long term. Europe is expanding as retailers build consent management and clean-room capabilities, while Carrefour Links is built on a large base of transactions and global customers.
The Middle East is projected to be the fastest-expanding geography at 10.81% CAGR during the forecast period. IAB MENA documented several active retail media networks across the Gulf Cooperation Council. In South America, MercadoLibre reported strong year-over-year advertising revenue growth in U.S. dollars. Africa remains at an earlier stage, where Criteo and Massmart introduced Sponsored Product Ads and Onsite Display Ads in South Africa. These developments extend the commerce media services market into retail systems where mobile performance advertising is becoming more important.
- Amazon.com, Inc.
- Alibaba Group Holding Limited
- JD.com, Inc.
- Walmart Inc.
- Target Corporation
- The Kroger Co.
- Maplebear Inc.
- DoorDash, Inc.
- Uber Technologies, Inc.
- Criteo S.A.
- Publicis Groupe S.A.
- Albertsons Companies, Inc.
- Koninklijke Ahold Delhaize N.V.
- Carrefour SA
- Tesco PLC
- MercadoLibre, Inc.
- eBay Inc.
- Booking Holdings Inc.
- Expedia Group, Inc.
- Marriott International, Inc.
Additional Benefits:
- The market estimate (ME) sheet in Excel format
- 3 months of analyst support
TABLE OF CONTENTS
1 INTRODUCTION
- 1.1 Study Assumptions and Market Definition
- 1.2 Scope of the Study
2 RESEARCH METHODOLOGY
3 EXECUTIVE SUMMARY
4 MARKET LANDSCAPE
- 4.1 Market Overview
- 4.2 Impact of Macroeconomic Factors on the Market
- 4.3 Market Drivers
- 4.3.1 First-Party Data Monetization After Third-Party Cookie Loss
- 4.3.2 Margin Expansion from High-Gross-Margin Media Revenue
- 4.3.3 Closed-Loop Measurement and Incrementality Proof
- 4.3.4 Offsite and Full-Funnel Expansion into CTV and Social
- 4.3.5 Travel and Hospitality Booking Platforms Entering Commerce Media
- 4.3.6 Clean-Room Collaboration Unlocking Non-Endemic Spend
- 4.4 Market Restraints
- 4.4.1 Fragmented Measurement and Reporting Standards
- 4.4.2 Ad Load Saturation and Shopper Experience Erosion
- 4.4.3 Sponsored Ranking Transparency and Antitrust Scrutiny
- 4.4.4 Catalog and Identity Interoperability Gaps Across Verticals
- 4.5 Industry Value Chain Analysis
- 4.6 Regulatory Landscape
- 4.7 Technological Outlook
- 4.8 Porter's Five Forces Analysis
- 4.8.1 Threat of New Entrants
- 4.8.2 Bargaining Power of Buyers
- 4.8.3 Bargaining Power of Suppliers
- 4.8.4 Threat of Substitutes
- 4.8.5 Industry Rivalry
5 MARKET SIZE AND GROWTH FORECASTS (VALUE)
- 5.1 By Platform Ownership Model
- 5.1.1 Owned and Operated Networks
- 5.1.2 Third-Party Networks
- 5.1.3 Integrated Commerce Media Platforms
- 5.1.4 White-Label Enablement Platforms
- 5.2 By Advertising Format
- 5.2.1 Sponsored Products and Sponsored Search Ads
- 5.2.2 Display Ads
- 5.2.3 Video Ads (including Connected TV)
- 5.2.4 Native and Shoppable Content Ads
- 5.2.5 Audio Ads
- 5.2.6 Digital Out-of-Home (DOOH) and In-Transit Ads
- 5.3 By Geography
- 5.3.1 North America
- 5.3.1.1 United States
- 5.3.1.2 Canada
- 5.3.1.3 Mexico
- 5.3.2 South America
- 5.3.2.1 Brazil
- 5.3.2.2 Argentina
- 5.3.2.3 Chile
- 5.3.2.4 Rest of South America
- 5.3.3 Europe
- 5.3.3.1 Germany
- 5.3.3.2 United Kingdom
- 5.3.3.3 France
- 5.3.3.4 Italy
- 5.3.3.5 Spain
- 5.3.3.6 Russia
- 5.3.3.7 Netherlands
- 5.3.3.8 Nordics
- 5.3.3.9 Rest of Europe
- 5.3.4 Asia-Pacific
- 5.3.4.1 China
- 5.3.4.2 Japan
- 5.3.4.3 India
- 5.3.4.4 South Korea
- 5.3.4.5 Australia
- 5.3.4.6 Southeast Asia
- 5.3.4.7 Rest of Asia-Pacific
- 5.3.5 Middle East
- 5.3.5.1 Saudi Arabia
- 5.3.5.2 United Arab Emirates
- 5.3.5.3 Turkey
- 5.3.5.4 Israel
- 5.3.5.5 Rest of Middle East
- 5.3.6 Africa
- 5.3.6.1 South Africa
- 5.3.6.2 Egypt
- 5.3.6.3 Nigeria
- 5.3.6.4 Kenya
- 5.3.6.5 Rest of Africa
- 5.3.1 North America
6 COMPETITIVE LANDSCAPE
- 6.1 Market Concentration
- 6.2 Strategic Moves
- 6.3 Market Share Analysis
- 6.4 Company Profiles (includes Global Level Overview, Market Level Overview, Core Segments, Financials as available, Strategic Information, Market Rank/Share, Products and Services, Recent Developments)
- 6.4.1 Amazon.com, Inc.
- 6.4.2 Alibaba Group Holding Limited
- 6.4.3 JD.com, Inc.
- 6.4.4 Walmart Inc.
- 6.4.5 Target Corporation
- 6.4.6 The Kroger Co.
- 6.4.7 Maplebear Inc.
- 6.4.8 DoorDash, Inc.
- 6.4.9 Uber Technologies, Inc.
- 6.4.10 Criteo S.A.
- 6.4.11 Publicis Groupe S.A.
- 6.4.12 Albertsons Companies, Inc.
- 6.4.13 Koninklijke Ahold Delhaize N.V.
- 6.4.14 Carrefour SA
- 6.4.15 Tesco PLC
- 6.4.16 MercadoLibre, Inc.
- 6.4.17 eBay Inc.
- 6.4.18 Booking Holdings Inc.
- 6.4.19 Expedia Group, Inc.
- 6.4.20 Marriott International, Inc.
7 MARKET OPPORTUNITIES AND FUTURE OUTLOOK
- 7.1 White-Space and Unmet-Need Assessment

 全球Over-The-Top服務市場規模、佔有率、趨勢和成長分析報告(2026-2034年)
 英國OTT:市場佔有率分析、產業趨勢與統計、成長預測(2026-2031年)美國OTT:市場佔有率分析、行業趨勢和統計數據、成長預測(2026-2031年)雲端OTT:市場佔有率分析、產業趨勢與統計、成長預測(2026-2031年)中國OTT市場:市場佔有率分析、產業趨勢與統計及成長預測(2026-2031年)印度OTT市場:市場佔有率分析、產業趨勢與統計及成長預測(2026-2031年)德國OTT:市場佔有率分析、產業趨勢與統計及成長預測(2026-2031年)OTT(Over The Top):市場佔有率分析、產業趨勢與統計數據、成長預測(2026-2031)北美OTT:市佔率分析、產業趨勢與統計及成長預測(2026-2031年)OTT機上盒:市場佔有率分析、產業趨勢與統計及成長預測(2026-2031年)