


 |
市場調查報告書
商品編碼
2118098
雲端OTT:市場佔有率分析、產業趨勢與統計、成長預測(2026-2031年)Cloud OTT - Market Share Analysis, Industry Trends & Statistics, Growth Forecasts (2026 - 2031) |
||||||

※ 本網頁內容可能與最新版本有所差異。詳細情況請與我們聯繫。
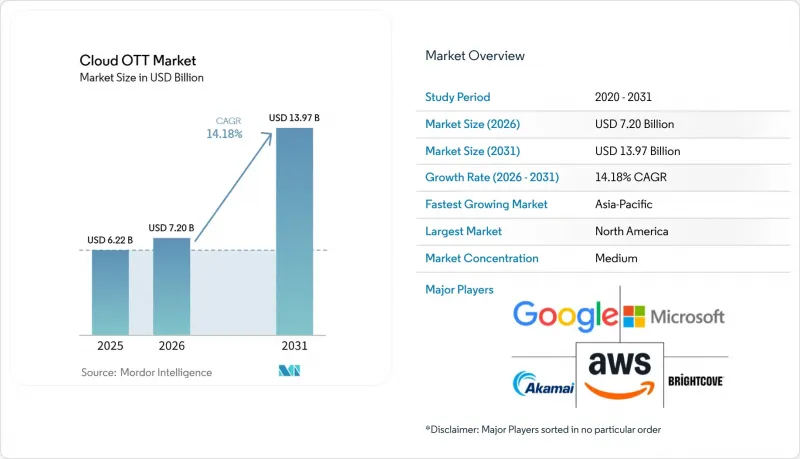
根據 Mordor Intelligence 預測,雲端 OTT 市場規模將從 2025 年的 62.2 億美元和 2026 年的 71 億美元成長到 2031 年的 139.7 億美元,2026 年至 2031 年的複合年成長率為 14.18%。
本報告按最終用戶(廣播公司和付費電視營運商、電信營運商和網路服務供應商等)、產業(媒體和娛樂、數位學習和教育等)、部署類型(公共雲端、私有雲端、混合雲端)以及地區(北美、南美、歐洲、亞太、中東和非洲)進行細分。市場預測以美元計價。
全球雲端OTT市場趨勢與洞察
高速寬頻、光纖和5G擴展
預計2026年第一季,全球5G用戶數將超過31億,2031年將達64億。愛立信的報告顯示,截至2025年底,5G流量佔全球行動數據流量的48%,預計2031年將達到85%。這項覆蓋廣泛的高頻寬基礎設施透過提升高清影片和點播影片的傳輸質量,為雲端OTT市場提供了有力支撐。愛立信的研究也表明,到2025年,55家電信業者中有43家的上行流量成長超過了下行流量成長,從而促進了內容分發和接收流程的最佳化。 2026年中期,以5G為基礎的固定無線接取將佔全球固定無線接取供應商的71%,為人口密集都會區以外的用戶提供媲美寬頻的接取服務。因此,國家頻段和寬頻計劃允許基於雲端的影片服務擴大其用戶群,而無需平台提供商建立最後一公里網路。
實施雲端原生OTT工作流程
廣播公司和媒體公司正在用基於軟體的雲端工作流程取代傳統的播出設備。在許多遷移專案中,變更管理比籌集資金更為阻礙因素。公共雲端系統現在可以利用微服務、容器和基於 API 的編配來支援直播頻道的運作。 Amagi 公司表示,其 CLOUDPORT 平台在 2025-2026 會計年度推出了 250 多項功能,為單一租戶內的 200 台播放器提供多可用區冗餘,並支援 100 多個並發訊號源。該公司還報告稱,在 2025 年底發布的監控套件可預防 80% 以上的潛在運作故障。這種轉變使得雲端 OTT 市場僅需配置即可支援新的頻道和服務,而無需依賴漫長的硬體採購週期。
內容版權、製作和雲端分發方面的成本壓力。
簡化雲端工作流程並不能消除加值內容版權和直播需求帶來的成本壓力。體育發送服務面臨版權費、多CDN出口流量和計量收費格式編碼等綜合成本。這些成本會限制平台從按需付費雲端基礎架構中獲得的預期營運效益。在地化也會產生額外的成本,例如配音、字幕和特定地區的版權許可。在歐洲和加拿大,無障礙存取義務意味著這些要求已納入產品預算,而不是作為可選附加功能。未在其雲端OTT市場計畫中包含在地化功能的平台,日後可能被迫承擔合規成本,進而影響其利潤率目標。
細分市場分析
到2025年,廣播公司和付費電視業者將佔終端用戶收入的25.29%,成為最大的終端用戶群。他們的支出反映了從傳統線性電視系統向基於雲端的播出、轉碼和分發方式的轉變。這些業者正在以基於CDN的分發方式取代其傳輸鏈路,並在其線性工作流程中引入伺服器端廣告。他們也正在整合付費電視和串流媒體的後勤部門系統。電信業者和網際服務供應商是雲端OTT市場中另一個重要的客戶群。這些業者透過將影片服務與寬頻配套服務捆綁銷售,降低了客戶解約率並提高了每用戶平均收入(ARPU)。這種方法使雲端OTT業者能夠在無需購買額外版權的情況下提升其內容的價值。它也使得寬頻服務的品質與影片服務的留存率之間建立了更緊密的聯繫。
從2026年到2031年,企業和機構用戶預計將以14.91%的複合年成長率(CAGR)實現最高成長。內部溝通、混合活動和麵向客戶的影片體驗正在轉移到企業影片系統。純OTT營運商和D2C(直接面對消費者)供應商由於其精簡的基礎設施模式,仍然是雲端用戶。內容擁有者、工作室和數位媒體公司正在採用基於雲端的媒體資產管理和版權管理感知型交付工具。 Kaltura在2026年Gartner視訊平台服務市場指南中被評為領先供應商。該公司已獲得ISO/IEC 42001認證,這意味著企業採購流程中已納入對人工智慧管理的期望。因此,雲端OTT產業正透過類似的核心基礎設施來滿足面向影片和機構的影片需求。此外,隨著企業需求的成長,安全性、合規性和內容管治的重要性也日益凸顯。
區域分析
2025年,北美仍將是最大的區域貢獻者,佔全球整體收入的45.50%。該地區聚集了眾多串流媒體原生服務商、體育版權所有擁有者和雲端基礎設施提供者。這些因素降低了視訊平台遷移到雲端OTT市場的門檻。此外,美國擁有成熟的快速廣告環境。 2026年4月至6月,北美和加拿大佔了全球快速廣告曝光量的74%。這種集中度支撐了雲端OTT市場對廣告、元資料和發行能力的需求。
歐洲是全球第二大區域市場,其中德國、英國和法國占主導地位。這些國家的公共廣播公司和付費電視業者正擴大將其影片工作流程遷移到雲端環境。歐盟資料法將於2025年9月全面實施,屆時將對雲端服務供應商提出可攜性和遷移要求。這些要求正在影響營運商對供應商的選擇,因為他們需要確保資料主權。法國、德國和北歐國家也在製定主權雲框架。俄羅斯在與西方雲端服務供應商的合作方面仍然落後。這種情況可能會促使歐洲供應商在一些政府和公共部門的專案中採用雲端服務。
預計亞太地區在2026年至2031年間將以15.01%的複合年成長率成長,成為所有地區中成長最快的地區。印度、韓國和日本較高的5G普及率正在推動行動優先影片觀看模式的發展。這些市場正在形成一種對傳統付費電視系統依賴性較低的影片觀看習慣。預計日本將透過提高每位用戶平均收入(ARPU)和以體育內容為中心的差異化服務來促進市場成長。預計印度將透過用戶數量的成長和廣告支援服務的擴展來促進市場成長。在南美洲,2026年4月至6月期間,FAST觀看時長成長了190%,顯示人們對低成本廣告支援影片有著濃厚的興趣。沙烏地阿拉伯和阿拉伯聯合大公國已製定資料保護法規,以鼓勵媒體在區域內部署,而不是將所有流量路由到海外。非洲的基礎設施建設仍處於起步階段,但行動寬頻的普及和設備價格的下降預計將支持未來用戶數量的成長。
其他好處:
- Excel格式的市場預測(ME)表
- 3個月的分析師支持
目錄
第1章:引言
- 研究假設和市場定義
- 調查範圍
第2章:調查方法
第3章執行摘要
第4章 市場狀況
- 市場概覽
- 市場促進因素
- 高速寬頻、光纖和 5G 的廣泛應用。
- 實施雲端原生OTT工作流程
- 過渡到直播體育賽事、FAST 和活動串流媒體
- 人工智慧驅動的個人化、在地化和廣告收入最佳化。
- 電信業者、連網電視和付費電視的雲端轉型
- 提供主權和低延遲的區域雲媒體區
- 市場限制因素
- 來自內容版權、製作成本和雲端分發成本的壓力。
- 盜版、濫用身分驗證資訊以及因內容保護造成的損失
- 資料主權、隱私和跨境合規的複雜性。
- 出口經濟性、尖峰容量波動和供應商鎖定
- 價值鏈分析
- 內容擁有者和權利持有者
- 生產、進口和郵寄
- 編碼、轉碼和打包
- 媒體資產管理與雲端存儲
- 內容管理、元資料和搜尋
- CDN、邊緣交付和網路最佳化
- 數位版權管理、身分識別和存取控制
- 貨幣化、廣告決策與支付
- 應用、裝置和使用者人口統計分析
- 監理情勢
- 隱私、國內資料儲存與消費者保護
- 版權、授權和轉載規則
- 廣告揭露與地址定向廣告
- 無障礙、字幕和當地語言要求
- 平台責任與網路安全
- 技術展望
- 雲端原生微服務和容器化媒體工作流程
- 人工智慧驅動的媒體運作和基於代理的工作流程
- 低延遲串流媒體、邊緣運算和 5G 網路 API
- AV1、VVC、HDR 和編碼效率藍圖
- 多CDN、對等輔助分發和流量控制
- 伺服器端廣告插入和基於上下文的貨幣化
- 波特五力分析
第5章 市場規模與成長預測
- 最終用戶
- 廣播公司及付費電視業者
- 電信營運商和網際服務供應商
- 純OTT提供者和D2C提供商
- 內容擁有者、工作室和數位媒體公司
- 企業和機構組織
- 按行業
- 媒體與娛樂
- 數位學習與教育
- BFSI
- 零售與電子商務
- 資訊科技/通訊
- 醫療保健和生命科學
- 政府/公共部門
- 其他行業
- 依部署類型
- 公共雲端
- 私有雲端
- 混合雲端
- 按地區
- 北美洲
- 美國
- 加拿大
- 墨西哥
- 南美洲
- 巴西
- 阿根廷
- 其他南美國家
- 歐洲
- 德國
- 英國
- 法國
- 俄羅斯
- 義大利
- 其他歐洲國家
- 亞太地區
- 中國
- 印度
- 日本
- 韓國
- 澳洲
- 其他亞太國家
- 中東
- 沙烏地阿拉伯
- 阿拉伯聯合大公國
- 土耳其
- 其他中東國家
- 非洲
- 南非
- 奈及利亞
- 埃及
- 其他非洲國家
- 北美洲
第6章 競爭情勢
- 市場集中度
- 策略趨勢
- 市佔率分析
- 公司簡介
- Amazon Web Services, Inc.
- Google LLC
- Microsoft Corporation
- Akamai Technologies, Inc.
- Brightcove Inc.
- Kaltura, Inc.
- Amagi Corporation
- Harmonic Inc.
- Synamedia Limited
- MediaKind
- Comcast Technology Solutions
- Roku, Inc.
- Cloudflare, Inc.
- IBM Corporation
- Tencent Cloud
- Endeavor Streaming
- Deltatre SpA
- Accedo Group
- Muvi LLC
- Vimeo, Inc.
- JW Player
第7章 市場機會與未來展望
According to Mordor Intelligence, the cloud OTT market size is projected to expand from USD 6.22 billion in 2025 and USD 7.10 billion in 2026 to USD 13.97 billion by 2031, registering a CAGR of 14.18% between 2026 and 2031.
This report is Segmented by End User (Broadcasters and Pay-TV Operators, Telecom Operators and Internet Service Providers, and More), Vertical (Media and Entertainment, E-Learning and Education, and More), Deployment (Public Cloud, Private Cloud, and Hybrid Cloud), and Geography (North America, South America, Europe, Asia-Pacific, Middle East, and Africa). The Market Forecasts are Provided in Terms of Value (USD).
Global Cloud OTT Market Trends and Insights
High-Speed Broadband, Fiber, and 5G Expansion
Global 5G subscriptions exceeded 3.1 billion in the first quarter of 2026 and are forecast to reach 6.4 billion by the end of 2031. Ericsson reported that 5G carried 48% of global mobile data traffic by the end of 2025, with this share expected to reach 85% by 2031. This wider high-bandwidth base supports the Cloud OTT market because it improves the delivery of high-resolution live and on-demand video. Ericsson also found that 43 of 55 operators had faster uplink than downlink traffic growth in 2025, which supports contribution and content-ingest workflows. Fixed wireless access based on 5G accounted for 71% of global fixed wireless access providers by mid-2026, extending broadband-like access to audiences outside dense urban areas. National spectrum and broadband programs can therefore expand the audience available to cloud-based video services without requiring platforms to build last-mile networks.
Cloud-Native OTT Workflow Adoption
Broadcasters and media operators are replacing legacy playout equipment with software-based cloud workflows. Change management has become a more important constraint than capital availability for many migration programs. Public cloud systems can now support live channel operations using microservices, containers, and API-based orchestration. Amagi stated that its CLOUDPORT platform introduced more than 250 features in FY 2025-26 and supported more than 100 concurrent feeds with 200-player multi-AZ redundancy in one tenant. The company also reported that its monitoring suite had prevented more than 80% of potential operational disruptions since its late-2025 launch. This shift allows the Cloud OTT market to support new channels and services through configuration rather than long hardware procurement cycles.
Content Rights, Production, and Cloud Delivery Cost Pressure
Cloud workflow efficiencies do not remove the cost pressure created by premium content rights and live delivery requirements. Sports services face combined expenses for rights, multi-CDN egress, and multi-format encoding. These costs can limit the operating benefits that platforms expect from consumption-based cloud infrastructure. Localization adds another expense through dubbing, captioning, and territory-specific rights clearance. Accessibility obligations in Europe and Canada can place these requirements in product budgets rather than treating them as optional additions. Platforms that do not include localization capabilities in their Cloud OTT market planning may face later compliance spending that affects margin objectives.
Other drivers and restraints analyzed in the detailed report include:
- Live Sports, FAST, and Event Streaming Migration
- AI-Enabled Personalization, Localization, and Ad Yield Optimization
- Piracy, Credential Abuse, and Content Protection Losses
For complete list of drivers and restraints, kindly check the Table Of Contents.
Segment Analysis
Broadcasters and Pay-TV Operators held 25.29% of end-user revenue in 2025, making them the largest end-user group. Their spending reflects the movement of legacy linear television systems to cloud-based playout, transcoding, and distribution. These operators are replacing transmission chains with CDN-based delivery and are adding server-side advertising to linear workflows. They are also connecting pay-TV and streaming back-office systems. Telecom Operators and Internet Service Providers form another important customer group for the Cloud OTT market. They use video services with broadband bundles to reduce customer churn and increase average revenue per user. This approach lets Cloud OTT market operators add content value without necessarily purchasing more rights. It also links the quality of broadband services more closely to video-service retention.
Enterprises and Institutional Organizations are projected to record the highest end-user CAGR at 14.91% from 2026 to 2031. Internal communications, hybrid events, and customer video experiences are moving onto enterprise video systems. Pure-play OTT and direct-to-consumer providers remain major cloud users because they operate with lean infrastructure models. Content owners, studios, and digital media companies are adopting cloud media asset management and rights-aware delivery tools. Kaltura was recognized as a Representative Vendor in the 2026 Gartner Market Guide for Video Platform Services. The company stated that it held ISO/IEC 42001 certification, which brings AI management expectations into enterprise procurement. The Cloud OTT industry is therefore serving both consumer video distribution and institutional video requirements through similar core infrastructure. Enterprise demand also increases the importance of security, compliance, and content governance.
Complete Report Scope:
- By End User
- Broadcasters and Pay-TV Operators
- Telecom Operators and Internet Service Providers
- Pure-play OTT and Direct-to-Consumer Providers
- Content Owners, Studios, and Digital Media Companies
- Enterprises and Institutional Organizations
- By Vertical
- Media and Entertainment
- E-Learning and Education
- BFSI
- Retail and E-commerce
- IT and Telecommunication
- Healthcare and Life Sciences
- Government and Public Sector
- Other Verticals
- By Deployment Type
- Public Cloud
- Private Cloud
- Hybrid Cloud
- By Geography
- North America
- United States
- Canada
- Mexico
- South America
- Brazil
- Argentina
- Rest of South America
- Europe
- Germany
- United Kingdom
- France
- Russia
- Italy
- Rest of Europe
- Asia-Pacific
- China
- India
- Japan
- South Korea
- Australia
- Rest of Asia-Pacific
- Middle East
- Saudi Arabia
- United Arab Emirates
- Turkey
- Rest of Middle East
- Africa
- South Africa
- Nigeria
- Egypt
- Rest of Africa
- North America
Geography Analysis
North America held 45.50% of global revenue in 2025 and remained the largest regional contributor. The region has a high concentration of streaming-native services, sports rights holders, and cloud infrastructure providers. These factors reduce adoption barriers for video platforms moving to cloud-based systems in the Cloud OTT market. The United States also has a developed FAST advertising environment. North America and Canada produced 74% of global FAST advertising impressions during April through June 2026. This concentration supports demand for advertising, metadata, and delivery functions in the Cloud OTT market.
Europe is the second-largest regional market, led by Germany, the United Kingdom, and France. Public broadcasters and pay-TV operators in these countries are moving more video workflows into cloud environments. The EU Data Act entered full application in September 2025 and introduced portability and switching requirements for cloud service providers. These requirements influence vendor selection for operators that need data sovereignty assurances. France, Germany, and Nordic countries are also developing sovereign cloud frameworks. Russia remains less connected to Western cloud providers. These conditions can support European vendors in some government and public-sector deployments.
Asia-Pacific is forecast to grow at a 15.01% CAGR from 2026 to 2031, the fastest regional rate. Higher 5G density in India, South Korea, and Japan supports mobile-first video consumption. These markets have developed video habits that are less dependent on traditional pay-TV systems. Japan is expected to contribute through average revenue per user improvements and sports-led service differentiation. India is expected to contribute through user growth and greater adoption of advertising-supported services. South America recorded 190% growth in FAST viewing hours during April through June 2026, indicating strong interest in lower-cost ad-supported video. Saudi Arabia and the United Arab Emirates have data-protection rules that encourage regional media deployment rather than routing all traffic through overseas locations. Africa remains at an earlier infrastructure stage, with mobile broadband expansion and lower device costs supporting future audience growth.
- Amazon Web Services, Inc.
- Google LLC
- Microsoft Corporation
- Akamai Technologies, Inc.
- Brightcove Inc.
- Kaltura, Inc.
- Amagi Corporation
- Harmonic Inc.
- Synamedia Limited
- MediaKind
- Comcast Technology Solutions
- Roku, Inc.
- Cloudflare, Inc.
- IBM Corporation
- Tencent Cloud
- Endeavor Streaming
- Deltatre S.p.A.
- Accedo Group
- Muvi LLC
- Vimeo, Inc.
- JW Player
Additional Benefits:
- The market estimate (ME) sheet in Excel format
- 3 months of analyst support
TABLE OF CONTENTS
1 INTRODUCTION
- 1.1 Study Assumptions and Market Definition
- 1.2 Scope of the Study
2 RESEARCH METHODOLOGY
3 EXECUTIVE SUMMARY
4 MARKET LANDSCAPE
- 4.1 Market Overview
- 4.2 Market Drivers
- 4.2.1 High-Speed Broadband, Fiber, and 5G Expansion
- 4.2.2 Cloud-Native OTT Workflow Adoption
- 4.2.3 Live Sports, FAST, and Event Streaming Migration
- 4.2.4 AI-Enabled Personalization, Localization, and Ad Yield Optimization
- 4.2.5 Telco, CTV, and Pay-TV Cloud Transformation
- 4.2.6 Regionalized Cloud Media Zones for Sovereign and Low-Latency Delivery
- 4.3 Market Restraints
- 4.3.1 Content Rights, Production, and Cloud Delivery Cost Pressure
- 4.3.2 Piracy, Credential Abuse, and Content Protection Losses
- 4.3.3 Data Sovereignty, Privacy, and Cross-Border Compliance Complexity
- 4.3.4 Egress Economics, Peak-Capacity Volatility, and Vendor Lock-In
- 4.4 Value-Chain Analysis
- 4.4.1 Content Owners and Rights Holders
- 4.4.2 Production, Ingest, and Contribution
- 4.4.3 Encoding, Transcoding, and Packaging
- 4.4.4 Media Asset Management and Cloud Storage
- 4.4.5 Content Management, Metadata, and Discovery
- 4.4.6 CDN, Edge Delivery, and Network Optimization
- 4.4.7 DRM, Identity, and Access Control
- 4.4.8 Monetization, Ad Decisioning, and Payments
- 4.4.9 Applications, Devices, and Audience Analytics
- 4.5 Regulatory Landscape
- 4.5.1 Privacy, Data Localization, and Consumer Protection
- 4.5.2 Copyright, Licensing, and Retransmission Rules
- 4.5.3 Advertising Disclosure and Addressable Advertising
- 4.5.4 Accessibility, Captioning, and Local-Language Requirements
- 4.5.5 Platform Liability and Online Safety
- 4.6 Technological Outlook
- 4.6.1 Cloud-Native Microservices and Containerized Media Workflows
- 4.6.2 AI-Assisted Media Operations and Agentic Workflows
- 4.6.3 Low-Latency Streaming, Edge Compute, and 5G Network APIs
- 4.6.4 AV1, VVC, HDR, and Encoding-Efficiency Roadmaps
- 4.6.5 Multi-CDN, Peer-Assisted Delivery, and Traffic Steering
- 4.6.6 Server-Side Ad Insertion and Contextual Monetization
- 4.7 Porter's Five Forces Analysis
- 4.7.1 Threat of New Entrants
- 4.7.2 Bargaining Power of Suppliers
- 4.7.3 Bargaining Power of Buyers
- 4.7.4 Threat of Substitutes
- 4.7.5 Competitive Rivalry
5 MARKET SIZE AND GROWTH FORECASTS (VALUE)
- 5.1 By End User
- 5.1.1 Broadcasters and Pay-TV Operators
- 5.1.2 Telecom Operators and Internet Service Providers
- 5.1.3 Pure-play OTT and Direct-to-Consumer Providers
- 5.1.4 Content Owners, Studios, and Digital Media Companies
- 5.1.5 Enterprises and Institutional Organizations
- 5.2 By Vertical
- 5.2.1 Media and Entertainment
- 5.2.2 E-Learning and Education
- 5.2.3 BFSI
- 5.2.4 Retail and E-commerce
- 5.2.5 IT and Telecommunication
- 5.2.6 Healthcare and Life Sciences
- 5.2.7 Government and Public Sector
- 5.2.8 Other Verticals
- 5.3 By Deployment Type
- 5.3.1 Public Cloud
- 5.3.2 Private Cloud
- 5.3.3 Hybrid Cloud
- 5.4 By Geography
- 5.4.1 North America
- 5.4.1.1 United States
- 5.4.1.2 Canada
- 5.4.1.3 Mexico
- 5.4.2 South America
- 5.4.2.1 Brazil
- 5.4.2.2 Argentina
- 5.4.2.3 Rest of South America
- 5.4.3 Europe
- 5.4.3.1 Germany
- 5.4.3.2 United Kingdom
- 5.4.3.3 France
- 5.4.3.4 Russia
- 5.4.3.5 Italy
- 5.4.3.6 Rest of Europe
- 5.4.4 Asia-Pacific
- 5.4.4.1 China
- 5.4.4.2 India
- 5.4.4.3 Japan
- 5.4.4.4 South Korea
- 5.4.4.5 Australia
- 5.4.4.6 Rest of Asia-Pacific
- 5.4.5 Middle East
- 5.4.5.1 Saudi Arabia
- 5.4.5.2 United Arab Emirates
- 5.4.5.3 Turkey
- 5.4.5.4 Rest of Middle East
- 5.4.6 Africa
- 5.4.6.1 South Africa
- 5.4.6.2 Nigeria
- 5.4.6.3 Egypt
- 5.4.6.4 Rest of Africa
- 5.4.1 North America
6 COMPETITIVE LANDSCAPE
- 6.1 Market Concentration
- 6.2 Strategic Moves
- 6.3 Market Share Analysis
- 6.4 Company Profiles (includes Global Level Overview, Market Level Overview, Core Segments, Financials as available, Strategic Information, Market Rank/Share, Products and Services, Recent Developments)
- 6.4.1 Amazon Web Services, Inc.
- 6.4.2 Google LLC
- 6.4.3 Microsoft Corporation
- 6.4.4 Akamai Technologies, Inc.
- 6.4.5 Brightcove Inc.
- 6.4.6 Kaltura, Inc.
- 6.4.7 Amagi Corporation
- 6.4.8 Harmonic Inc.
- 6.4.9 Synamedia Limited
- 6.4.10 MediaKind
- 6.4.11 Comcast Technology Solutions
- 6.4.12 Roku, Inc.
- 6.4.13 Cloudflare, Inc.
- 6.4.14 IBM Corporation
- 6.4.15 Tencent Cloud
- 6.4.16 Endeavor Streaming
- 6.4.17 Deltatre S.p.A.
- 6.4.18 Accedo Group
- 6.4.19 Muvi LLC
- 6.4.20 Vimeo, Inc.
- 6.4.21 JW Player
7 MARKET OPPORTUNITIES AND FUTURE OUTLOOK
- 7.1 White-Space and Unmet-Need Assessment

 全球Over-The-Top服務市場規模、佔有率、趨勢和成長分析報告(2026-2034年)
 商業媒體服務:市場佔有率分析、產業趨勢與統計、成長預測(2026-2031 年)英國OTT:市場佔有率分析、產業趨勢與統計、成長預測(2026-2031年)美國OTT:市場佔有率分析、行業趨勢和統計數據、成長預測(2026-2031年)中國OTT市場:市場佔有率分析、產業趨勢與統計及成長預測(2026-2031年)印度OTT市場:市場佔有率分析、產業趨勢與統計及成長預測(2026-2031年)德國OTT:市場佔有率分析、產業趨勢與統計及成長預測(2026-2031年)OTT(Over The Top):市場佔有率分析、產業趨勢與統計數據、成長預測(2026-2031)北美OTT:市佔率分析、產業趨勢與統計及成長預測(2026-2031年)OTT機上盒:市場佔有率分析、產業趨勢與統計及成長預測(2026-2031年)