


 |
市場調查報告書
商品編碼
2114397
OTT(Over The Top):市場佔有率分析、產業趨勢與統計數據、成長預測(2026-2031)Over The Top (OTT) - Market Share Analysis, Industry Trends & Statistics, Growth Forecasts (2026 - 2031) |
||||||

※ 本網頁內容可能與最新版本有所差異。詳細情況請與我們聯繫。
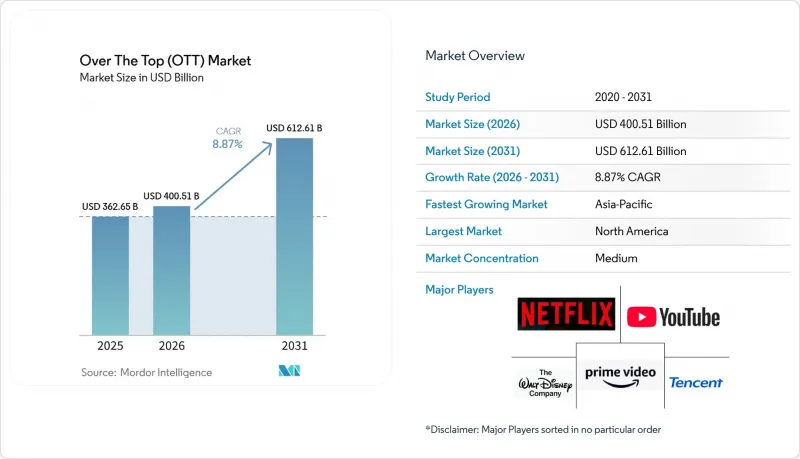
根據 Mordor Intelligence 預測,OTT(Over-The-Top)市場規模將從 2025 年的 3,626.5 億美元和 2026 年的 4005.1 億美元成長到 2031 年的 6,126.1 億美元,2026 年至 2031 年的年複合成長率(CAGR)。
本報告按獲利模式(SVOD、AVOD、TVOD、混合模式等)、設備類型(智慧型手機/平板電腦、智慧電視、筆記型電腦/桌上型電腦等)、內容類型(電影、電視劇/劇集、紀錄片等)和地區(北美、南美、歐洲、亞太、中東和非洲)進行細分。市場預測以美元計價。
全球OTT(Over-The-Top)市場趨勢與洞察
與電信業者和OTT夥伴關係捆綁銷售
電信業者提供的配套服務已成為OTT(Over-The-Top)市場的重要通路,尤其是在價格敏感地區。這種機制使營運商能夠降低用戶解約率,並使串流媒體平台能夠降低用戶獲取成本。 2026年5月,Reliance Jio推出了售價200印度盧比(約2.10美元)的“OTT通行證”,其中包含15個平台、1000個直播電影片道以及28天的無限量5G流量。該套餐將串流媒體服務定位為更廣泛的行動服務的一部分,而非單獨購買。雖然這種模式擴大了高需求市場的覆蓋範圍,但也迫使平台接受較低的單一用戶收入。這促使服務提供者利用廣告和混合套餐來彌補無法從獨立訂閱中獲得的收入。
體育賽事轉播權價格飆升
預計到2026年,串流平台在體育賽事轉播權上的支出將達到142億美元,高於2025年的132億美元。亞馬遜Prime Video預計將支出38億美元,主要得益於與NBA的首個完整賽季合作。體育賽事直播能夠在特定時間吸引觀眾,並為OTT(Over-The-Top)市場創造寶貴的廣告空間。在綜合娛樂訂閱成長放緩的成熟市場,同樣的轉播權也能促進新用戶的取得。然而,不斷飆升的轉播權費用給那些沒有其他主要收入來源的平台帶來了沉重的成本壓力。因此,在OTT市場,那些能夠利用體育節目在訂閱、廣告以及更廣泛的商業生態系統中獲利的平台,更有可能獲得青睞。
內容取得和製作成本不斷上升
內容支出仍是OTT(Over-The-Top)市場最大的成本壓力。 Netflix報告稱,2025會計年度新增內容資產價值171億美元,內容授權義務達240億美元。該公司預計2025年營收將達到451.8億美元,反映了其維持全球服務所需的巨額內容投資。體育賽事轉播權進一步加重了成本負擔,因為頂級體育賽事需要簽訂多年期的大規模合約。在印度,由於平台在中等預算製作項目上更加謹慎,OTT內容支出從2024年的267億印度盧比(約2.79億美元)下降到2025年的218億印度盧比(約2.28億美元)。因此,OTT市場正在推動授權、Over-The-Top製作和製作共享等機制的發展,使服務提供者能夠在不失去相關內容的情況下降低風險。
細分市場分析
2025年,以獲利模式分類,SVOD(訂閱視訊點播)將佔OTT(線上電視)市場54.52%的佔有率。訂閱收入仍然是主要平台的主要收入來源,因為它能提供持續的收入流,並有助於與客戶建立直接聯繫。混合型服務預計將實現最快成長,2026年至2031年的複合年成長率將達到10.54%。這類服務將訂閱費與來自同一受眾的廣告收入結合。 AVOD(廣告支援型點播)是第二大獲利模式,在亞太和南美等價格敏感型市場中發揮著尤為重要的作用。
儘管TVOD和免費增值服務在OTT市場中所佔佔有率仍然相對較小,但它們在特定應用場景中發揮重要作用。 TVOD非常適合體育賽事和實況活動,因為觀眾願意為限時觀看支付交易費用。免費增值服務則允許消費者在升級到付費服務之前體驗平台功能。隨著成熟服務用戶成長放緩,企業需要實現收入來源多元化,而無廣告訂閱模式的興起也反映了這一趨勢。 Netflix報告稱,2025年的廣告收入將超過15億美元,並預計2026年將接近30億美元。因此,OTT產業正在利用混合模式,這並非將其視為一種臨時的促銷手段,而是將其視為一種永續的經營模式。
區域分析
到2025年,北美將佔據OTT市場48.22%的佔有率。家庭寬頻普及率高、訂閱視訊服務市場成熟、廣告體系完善,都支撐了這一地位。截至2025年12月,Netflix、Disney+和Amazon合計佔據了美國訂閱隨選視訊用戶65%的佔有率。該地區面臨市場飽和的挑戰,許多新增用戶來自競爭對手或重新啟動服務的老用戶。加拿大將於2026年實施的15%本土節目強制要求,正在改變全球平台的製作外包選擇。
亞太地區預計將成為OTT市場成長最快的地區,2026年至2031年的複合年成長率(CAGR)將達到11.17%。 2025年,中國佔該地區線上影片收入的46%,其次是日本(17%)和澳洲(10%)。預計到2030年,印度將成為全球最大的SVOD(訂閱式隨選視訊)市場,擁有3.58億個人用戶。全部區域84%的SVOD訂閱用戶來自本地平台,儘管OTT(Over-The-Top)市場不斷擴張,但國際服務所能獲得的收入佔有率仍然有限。
歐洲是OTT市場第二大區域市場,以德國、英國和法國為中心。歐洲服務提供者必須遵守一項規定,即其30%的內容必須來自歐洲。在德國,一項將8%的收入用於本地投資的規定預計將於2027年1月開始實施。南美洲是一個新興市場,巴西在市場滲透率方面領先,電信業者提供的配套服務正將服務範圍擴展到主要城市以外的地區。在中東,沙烏地阿拉伯和阿拉伯聯合大公國是收入中心,而在非洲,行動接入在南非、埃及和奈及利亞仍然佔據主導地位。
其他好處:
- Excel格式的市場預測(ME)表
- 3個月的分析師支持
目錄
第1章:引言
- 研究假設和市場定義
- 調查範圍
第2章:調查方法
第3章執行摘要
第4章 市場狀況
- 市場概覽
- 市場促進因素
- 透過電信業者(Telco)和OTT服務供應商之間的合作配套服務。
- 體育賽事直播權價格飆升
- 聯網電視廣告的變革
- 政府國內採購配額
- 基於雲端的內容傳送和人工智慧驅動的個人化
- 混合獲利模式與廣告層級擴展
- 市場限制因素
- 取得和製作內容的成本不斷上升
- 高解約率和重疊的訂閱合約
- 頻寬限制和播放品質差異
- 監管、隱私和內容合規的複雜性。
- 宏觀經濟因素對市場的影響
- 產業價值鏈分析
- 監理情勢
- 技術展望
- 波特五力分析
第5章 市場規模與成長預測
- 透過貨幣化模式
- SVOD
- AVOD
- TVOD
- 混合
- 免費增值
- 依設備類型
- 智慧型手機和平板電腦
- 智慧電視
- 筆記型電腦和桌上型電腦
- 其他設備類型
- 按內容類型
- 電影和影像作品
- 電視節目和劇集內容
- 記錄
- 其他內容類型
- 按地區
- 北美洲
- 美國
- 加拿大
- 墨西哥
- 南美洲
- 巴西
- 阿根廷
- 智利
- 其他南美國家
- 歐洲
- 德國
- 英國
- 法國
- 義大利
- 西班牙
- 其他歐洲國家
- 亞太地區
- 中國
- 日本
- 印度
- 韓國
- 澳洲
- 其他亞太國家
- 中東
- 沙烏地阿拉伯
- 阿拉伯聯合大公國
- 卡達
- 其他中東國家
- 非洲
- 南非
- 埃及
- 奈及利亞
- 其他非洲國家
- 北美洲
第6章 競爭情勢
- 市場集中度
- 策略趨勢
- 市佔率分析
- 公司簡介
- Netflix Inc.
- Google LLC
- Prime Video(Amazon.com, Inc.)
- The Walt Disney Company
- Tencent Holdings Limited
- Apple Inc.
- Warner Bros. Discovery, Inc.
- Comcast Corporation
- Paramount Global
- Roku, Inc.
- Baidu, Inc.
- Alibaba Group Holding Limited
- DAZN Group Limited
- JioStar Private Limited
- PCCW Media Limited
- Zee Entertainment Enterprises Limited
- MBC Group
- Canal+Group
- Rakuten Group, Inc.
- Starz Entertainment, LLC
第7章 市場機會與未來展望
According to Mordor Intelligence, the over the top (OTT) market size is projected to expand from USD 362.65 billion in 2025 and USD 400.51 billion in 2026 to USD 612.61 billion by 2031, registering a CAGR of 8.87% between 2026 to 2031.
This report is Segmented by Monetization Model (SVOD, AVOD, TVOD, Hybrid, and More), Device Types (Smartphones and Tablets, Smart TVs, Laptops and Desktops, and More), Content Genre (Movies and Films, TV Shows and Episodic Content, Documentaries, and More), and Geography (North America, South America, Europe, Asia-Pacific, Middle East, and Africa). The Market Forecasts are Provided in Terms of Value (USD).
Global Over The Top (OTT) Market Trends and Insights
Bundled Telco and OTT Partnerships
Telecom bundles have become an important distribution route for the over the top (OTT) market, especially where customers are price sensitive. The arrangement can reduce cancellation rates for operators and lower subscriber acquisition costs for streaming platforms. Reliance Jio introduced an INR 200 (USD 2.10) OTT Pass in May 2026 that bundled 15 platforms, 1,000 live TV channels, and unlimited 5G access for 28 days. This package placed streaming services within a broader mobile offer rather than treating them as separate purchases. The model can broaden reach in high-volume markets, but it also places pressure on platforms to accept lower revenue per user. It has encouraged providers to use advertising and hybrid plans to recover revenue that a standalone subscription may not deliver.
Live Sports Rights Inflation
Streaming platforms are expected to spend USD 14.2 billion on sports rights in 2026, compared with USD 13.2 billion in 2025. Amazon Prime Video was expected to spend USD 3.8 billion, supported by the first full season of its NBA agreement. Live sports can attract viewers at a fixed time and create valuable advertising inventory for the over the top (OTT) market. The same rights can also support subscriber acquisition in mature markets where general entertainment subscriptions have slowed. However, rising rights fees create a difficult cost position for platforms that lack other large revenue streams. The OTT market is therefore likely to reward services that can use sports programming across subscriptions, advertising, and wider commercial ecosystems.
Escalating Content Acquisition and Production Costs
Content spending remains the largest cost pressure in the over the top (OTT) market. Netflix added USD 17.1 billion in content assets in fiscal 2025 and reported USD 24.0 billion in content obligations. Its 2025 revenue was USD 45.18 billion, which shows the scale of content investment needed to maintain a global service. Sports rights add a further cost burden because premium competitions require large multiyear commitments. In India, OTT content spending fell to INR 21.8 billion (USD 228 million) in 2025 from INR 26.7 billion (USD 279 million) in 2024 as platforms became more selective with mid-budget commissions. The over the top (OTT) market is consequently encouraging licensing, co-productions, and shared production arrangements where providers can limit risk without losing access to relevant content.
Other drivers and restraints analyzed in the detailed report include:
- Connected TV Advertising Shift
- Government Domestic Content Quotas
- High Churn and Subscription Stacking
For complete list of drivers and restraints, kindly check the Table Of Contents.
Segment Analysis
SVOD held 54.52% of the over the top (OTT) market by monetization model in 2025. Subscription revenue still anchors the largest platforms because it provides recurring income and a direct customer relationship. Hybrid services are projected to record the fastest growth at a 10.54% CAGR from 2026 to 2031. These plans combine a subscription charge with advertising revenue from the same viewer. AVOD is the second-largest monetization model and has particular relevance in price-sensitive markets across Asia-Pacific and South America.
TVOD and freemium services remain smaller parts of the OTT market, but they retain a clear role in selected use cases. TVOD is relevant for sports and live events where viewers may accept a transaction fee for time-sensitive access. Freemium services can introduce consumers to a platform before a paid conversion. The shift away from entirely ad-free subscriptions reflects the need to diversify revenue as mature services face slower subscriber additions. Netflix reported that advertising revenue exceeded USD 1.5 billion in 2025 and forecast that it would approach USD 3 billion in 2026. The OTT industry is therefore using hybrid plans as an enduring commercial model rather than a temporary promotional option.
Complete Report Scope:
- By Monetization Model
- SVOD
- AVOD
- TVOD
- Hybrid
- Freemium
- By Device Types
- Smartphones and Tablets
- Smart TVs
- Laptops and Desktops
- Other Device Types
- By Content Genre
- Movies and Films
- TV Shows and Episodic Content
- Documentaries
- Other Content Genres
- By Geography
- North America
- United States
- Canada
- Mexico
- South America
- Brazil
- Argentina
- Chile
- Rest of South America
- Europe
- Germany
- United Kingdom
- France
- Italy
- Spain
- Rest of Europe
- Asia-Pacific
- China
- Japan
- India
- South Korea
- Australia
- Rest of Asia-Pacific
- Middle East
- Saudi Arabia
- United Arab Emirates
- Qatar
- Rest of Middle East
- Africa
- South Africa
- Egypt
- Nigeria
- Rest of Africa
- North America
Geography Analysis
North America held 48.22% of the over the top market in 2025. High household broadband availability, established subscription video use, and mature advertising systems supported this position. Netflix, Disney, and Amazon collectively accounted for 65% of U.S. subscription VOD viewership in December 2025. The region faces a saturation challenge because new subscribers often come from competitors or from reactivated former subscribers. Canada's 15% domestic-programming contribution requirement, formalized in 2026, is changing the commissioning choices of global platforms.
Asia-Pacific is projected to be the fastest-growing OTT geography at an 11.17% CAGR from 2026 to 2031. China accounted for 46% of the region's online video revenue in 2025, followed by Japan at 17% and Australia at 10%. India is expected to become the world's largest SVOD subscription market by 2030 with 358 million individual subscriptions. Local platforms held 84% of SVOD subscriptions across Asia-Pacific, which limits the revenue share available to international services even as the over the top (OTT) expands.
Europe is the second-largest geographic segment in the over the top market and is centered on Germany, the United Kingdom, and France. European services operate under a 30% European content availability requirement. Germany is expected to apply an 8% local-revenue investment requirement from January 2027. South America is an emerging region where Brazil anchors adoption and telecom bundles are extending access beyond major cities. The Middle East has premium revenue centers in Saudi Arabia and the United Arab Emirates, while Africa remains centered on mobile access in South Africa, Egypt, and Nigeria.
- Netflix Inc.
- Google LLC
- Prime Video (Amazon.com, Inc.)
- The Walt Disney Company
- Tencent Holdings Limited
- Apple Inc.
- Warner Bros. Discovery, Inc.
- Comcast Corporation
- Paramount Global
- Roku, Inc.
- Baidu, Inc.
- Alibaba Group Holding Limited
- DAZN Group Limited
- JioStar Private Limited
- PCCW Media Limited
- Zee Entertainment Enterprises Limited
- MBC Group
- Canal+ Group
- Rakuten Group, Inc.
- Starz Entertainment, LLC
Additional Benefits:
- The market estimate (ME) sheet in Excel format
- 3 months of analyst support
TABLE OF CONTENTS
1 INTRODUCTION
- 1.1 Study Assumptions and Market Definition
- 1.2 Scope of the Study
2 RESEARCH METHODOLOGY
3 EXECUTIVE SUMMARY
4 MARKET LANDSCAPE
- 4.1 Market Overview
- 4.2 Market Drivers
- 4.2.1 Bundled Telco and OTT Partnerships
- 4.2.2 Live Sports Rights Inflation
- 4.2.3 Connected TV Advertising Shift
- 4.2.4 Government Domestic Content Quotas
- 4.2.5 Cloud-Based Content Delivery and AI Personalization
- 4.2.6 Hybrid Monetization and Ad Tier Expansion
- 4.3 Market Restraints
- 4.3.1 Escalating Content Acquisition and Production Costs
- 4.3.2 High Churn and Subscription Stacking
- 4.3.3 Bandwidth Constraints and Playback Quality Gaps
- 4.3.4 Regulatory, Privacy, and Content Compliance Complexity
- 4.4 Impact of Macroeconomic Factors on the Market
- 4.5 Industry Value Chain Analysis
- 4.6 Regulatory Landscape
- 4.7 Technological Outlook
- 4.8 Porter's Five Forces Analysis
- 4.8.1 Bargaining Power of Suppliers
- 4.8.2 Bargaining Power of Buyers
- 4.8.3 Threat of New Entrants
- 4.8.4 Threat of Substitutes
- 4.8.5 Competitive Rivalry
5 MARKET SIZE AND GROWTH FORECASTS (VALUE)
- 5.1 By Monetization Model
- 5.1.1 SVOD
- 5.1.2 AVOD
- 5.1.3 TVOD
- 5.1.4 Hybrid
- 5.1.5 Freemium
- 5.2 By Device Types
- 5.2.1 Smartphones and Tablets
- 5.2.2 Smart TVs
- 5.2.3 Laptops and Desktops
- 5.2.4 Other Device Types
- 5.3 By Content Genre
- 5.3.1 Movies and Films
- 5.3.2 TV Shows and Episodic Content
- 5.3.3 Documentaries
- 5.3.4 Other Content Genres
- 5.4 By Geography
- 5.4.1 North America
- 5.4.1.1 United States
- 5.4.1.2 Canada
- 5.4.1.3 Mexico
- 5.4.2 South America
- 5.4.2.1 Brazil
- 5.4.2.2 Argentina
- 5.4.2.3 Chile
- 5.4.2.4 Rest of South America
- 5.4.3 Europe
- 5.4.3.1 Germany
- 5.4.3.2 United Kingdom
- 5.4.3.3 France
- 5.4.3.4 Italy
- 5.4.3.5 Spain
- 5.4.3.6 Rest of Europe
- 5.4.4 Asia-Pacific
- 5.4.4.1 China
- 5.4.4.2 Japan
- 5.4.4.3 India
- 5.4.4.4 South Korea
- 5.4.4.5 Australia
- 5.4.4.6 Rest of Asia-Pacific
- 5.4.5 Middle East
- 5.4.5.1 Saudi Arabia
- 5.4.5.2 United Arab Emirates
- 5.4.5.3 Qatar
- 5.4.5.4 Rest of Middle East
- 5.4.6 Africa
- 5.4.6.1 South Africa
- 5.4.6.2 Egypt
- 5.4.6.3 Nigeria
- 5.4.6.4 Rest of Africa
- 5.4.1 North America
6 COMPETITIVE LANDSCAPE
- 6.1 Market Concentration
- 6.2 Strategic Moves
- 6.3 Market Share Analysis
- 6.4 Company Profiles (includes Global Level Overview, Market Level Overview, Core Segments, Financials as available, Strategic Information, Market Rank/Share, Products and Services, Recent Developments)
- 6.4.1 Netflix Inc.
- 6.4.2 Google LLC
- 6.4.3 Prime Video (Amazon.com, Inc.)
- 6.4.4 The Walt Disney Company
- 6.4.5 Tencent Holdings Limited
- 6.4.6 Apple Inc.
- 6.4.7 Warner Bros. Discovery, Inc.
- 6.4.8 Comcast Corporation
- 6.4.9 Paramount Global
- 6.4.10 Roku, Inc.
- 6.4.11 Baidu, Inc.
- 6.4.12 Alibaba Group Holding Limited
- 6.4.13 DAZN Group Limited
- 6.4.14 JioStar Private Limited
- 6.4.15 PCCW Media Limited
- 6.4.16 Zee Entertainment Enterprises Limited
- 6.4.17 MBC Group
- 6.4.18 Canal+ Group
- 6.4.19 Rakuten Group, Inc.
- 6.4.20 Starz Entertainment, LLC
7 MARKET OPPORTUNITIES AND FUTURE OUTLOOK
- 7.1 White-Space and Unmet-Need Assessment

 全球Over-The-Top服務市場規模、佔有率、趨勢和成長分析報告(2026-2034年)
 商業媒體服務:市場佔有率分析、產業趨勢與統計、成長預測(2026-2031 年)英國OTT:市場佔有率分析、產業趨勢與統計、成長預測(2026-2031年)美國OTT:市場佔有率分析、行業趨勢和統計數據、成長預測(2026-2031年)雲端OTT:市場佔有率分析、產業趨勢與統計、成長預測(2026-2031年)中國OTT市場:市場佔有率分析、產業趨勢與統計及成長預測(2026-2031年)印度OTT市場:市場佔有率分析、產業趨勢與統計及成長預測(2026-2031年)德國OTT:市場佔有率分析、產業趨勢與統計及成長預測(2026-2031年)北美OTT:市佔率分析、產業趨勢與統計及成長預測(2026-2031年)OTT機上盒:市場佔有率分析、產業趨勢與統計及成長預測(2026-2031年)