


 |
市場調查報告書
商品編碼
2119019
東南亞電線電纜市場:市場佔有率分析、產業趨勢與統計、成長預測(2026-2031)Southeast Asia Wire and Cable - Market Share Analysis, Industry Trends & Statistics, Growth Forecasts (2026 - 2031) |
||||||

※ 本網頁內容可能與最新版本有所差異。詳細情況請與我們聯繫。
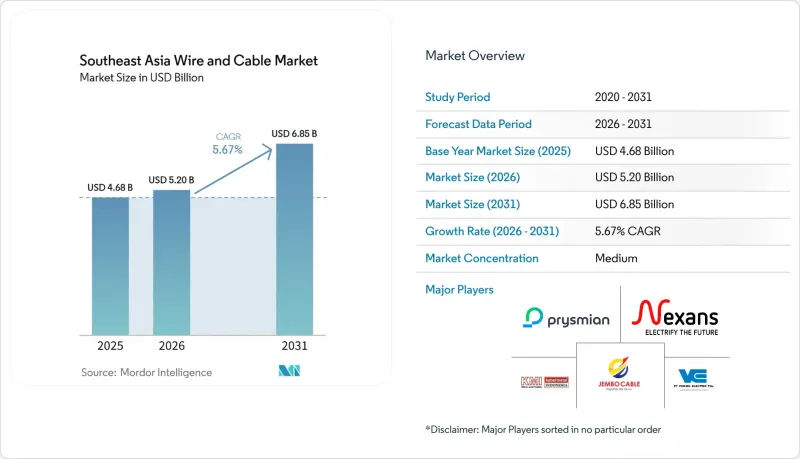
據 Mordor Intelligence 稱,東南亞電線電纜市場在 2025 年的價值為 46.8 億美元,預計到 2031 年將達到 68.5 億美元,而 2026 年為 52 億美元,預測期內(2026-2031 年)的複合年成長率為 5.67%預計為 5.67%。
本報告按電壓(例如,超高壓、高壓(35千伏以上))、電纜類型(例如,電力電纜)、導體材料(例如,銅、鋁)、安裝方式(架空、地下、水下)、最終用戶行業(例如,住宅建築)、絕緣方式(例如,帶有細分)和國家/地區進行絕緣。市場預測以美元計價。
東南亞電線電纜市場趨勢與洞察
東協電網網際網路絡的發展
東協電網資金籌措舉措由亞洲開發銀行、世界銀行、東協秘書處和東協能源中心於2025年10月啟動。該舉措已籌集超過125億美元的十年期資金籌措承諾,其中包括亞洲開發銀行提供的100億美元和世界銀行提供的25億美元。東協互聯互通總體規劃第三期研究報告估計,到2045年,需要7,640億美元的輸電和發電投資才能建造一個高比例可再生能源電網。國際能源總署(IEA)估計,在2025年至2040年的基本案例下,跨國互聯互通支出將達到270億美元。 2025年,東協能源部長們將海底電纜確定為區域電網的關鍵組成部分。單一高壓直流(HVDC)海底電纜計畫的投資金額可能超過10億美元,這將推動東南亞電線電纜市場的需求。
資料中心和雲端基礎設施的擴展
資料中心的建設正在推動整個東南亞線纜市場對電力和光纖電纜系統的需求成長。人工智慧最佳化型資料中心的機架運作為每機架10-20千瓦,而傳統運算設施的機架功率僅3-5千瓦。這種高功率密度增加了每個資料中心機房以及電網連接處對中高壓電纜的需求。 2026年1月,Digital Edge宣布投資45億美元,在印尼勿加泗興建一座500兆瓦的人工智慧園區。 AirTrunk宣布投資120億馬幣(約27億美元),在柔佛州新山興建兩座園區。超大規模業者也利用10-15年的購電協議(PPA)來支援分階段的場地開發和後續的電纜升級。
銅鋁價格波動
2026年1月,倫敦金屬交易所(LME)銅價盤中一度飆升至每噸14,527.50美元的歷史新高。銅鋁比價達到4.3,超過了電纜買家考慮替代材料的3.5-4.0區間。由於銅佔電纜製造成本的70-85%,製造商極易受到原物料價格劇烈波動的影響。金屬價格飆升可能會為電網合約帶來不確定性,並推遲最終的投資決策。如果電纜報價不再符合專案預算,開發商可能必須重新競標。根據路透社通報,耐吉森公司預測,到2030年,全球電網投資將達到10兆歐元(11.3兆美元)。因此,儘管短期價格波動會阻礙採購,但長期的電網投資仍將支撐市場。
細分市場分析
2025年,低壓電纜(1千伏以下)佔該地區銷售額的46.84%。在印尼、越南和菲律賓,住宅佈線、商業建築和工業園區電氣化是支撐這一市場地位的主要因素。由於低壓電纜廣泛應用於建築物和製造場所,因此這些應用領域持續產生需求。住宅的竣工和工業園區的建設仍將是推動該細分市場發展的重要因素。中壓電纜(1-35千伏特)用於擴建配電網和連接太陽能發電系統。它們也為泰國和馬來西亞電力公司的智慧電網專案提供支援。這些市場的需求與可再生能源設施的擴建和配電網的升級密切相關。低壓產品在全部區域的各種建設活動中繼續發揮核心作用。
預計2026年至2031年間,電壓等級超過35千伏特的超高壓和高壓電纜將以7.06%的複合年成長率成長,在所有電壓等級中增速最高。印尼的「綠色超級電網」計畫總長47,758公里,為這些系統提供了強勁的需求。此外,越南在其「第八個國家電力發展計畫」下制定的400千伏擴容計畫也需要增加高壓電纜的容量。東協地區的跨境互聯計畫也正在創造新的需求來源。泰航電纜越南公司於2026年3月開始興建越南首家400千伏超高壓電纜工廠。該工廠預計將降低越南國內項目對進口電纜的依賴。本地化生產預計也將縮短未來專案訂單的前置作業時間。
至2025年,電力電纜將佔東南亞電線電纜市場規模的68.76%。電力電纜的應用範圍十分廣泛,從低壓室內配電到高壓大規模輸電,無所不包。如此廣泛的應用支撐了電力電纜在銷售領域的主導地位。區域電纜供應鏈中的所有主要終端使用者群體都使用電力電纜。因此,電力電纜對東南亞電線電纜市場至關重要。同軸電纜和數據電纜用於商業連接、有線電視和傳統企業網路。在光纖正在取代銅線的高頻寬應用中,相關領域的成長較為有限。號誌和控制電纜則用於支援工業自動化、石油天然氣設施和建築管理系統。泰國東部經濟走廊和印尼經濟特區的製造業發展正在推動這些產品的需求。
預計2026年至2031年,光纖電纜市場將以7.48%的複合年成長率成長。資料中心互聯、5G去程傳輸、5G回程傳輸以及海底數位連結正在推動東南亞線纜市場的整體擴張。 2026年7月,Nongsa Changi海底光纜在巴淡島登陸。此光纜全長50公里,包含24對光纖。這是首個在Nongsa數位園區登陸的光纜系統。該計畫旨在加強印尼和新加坡之間的互聯互通,以迎接即將實施的東協數位經濟框架。此外,由於越南和菲律賓的大規模數位基礎設施項目,兩國的光纜消費量也有所成長。
其他好處:
- Excel格式的市場預測(ME)表
- 3個月的分析師支持
目錄
第1章:引言
- 市場分析與定義的前提條件
- 分析範圍
第2章 分析方法
第3章執行摘要
第4章 市場狀況
- 市場概覽
- 市場促進因素
- 東協電網網際網路絡的發展
- 資料中心和雲端基礎設施的擴展
- 可再生能源併網及電網現代化
- 建構能夠抵禦都市區地下化和氣候變遷的韌性網路。
- 製造轉移和工業自動化
- 擴展光纖網路以支援 5G 和跨境連接
- 市場限制因素
- 銅鋁價格波動
- 海底輸電和超高壓工程需要大量資金投入
- 國內標準和授權程序各不相同
- 假冒偽劣和不合規的電纜產品
- 產業供應鏈分析
- 監理情勢
- 技術展望
- 宏觀經濟因素對市場的影響
- 投資分析
- 波特五力分析
第5章:預測市場規模與成長率
- 透過電壓
- 超高壓/高壓(超過35千伏特)
- 中壓(1-35千伏特)
- 低電壓(低於1千伏特)
- 按電纜類型
- 電源線
- 光纖電纜
- 訊號和控制電纜
- 同軸電纜和資料電纜
- 按導體材料
- 銅
- 鋁
- 光學玻璃/聚合物
- 透過安裝方法
- 虛構的
- 地下
- 海底
- 按最終用戶行業分類
- 住宅
- 商業建築
- 電力基礎設施(公用事業、可再生能源)
- 通訊和資料中心
- 石油和天然氣、石油化學產品
- 汽車與出行
- 工業/製造業
- 絕緣類型
- 採用絕緣材料
- 無絕緣材料
- 國家
- 印尼
- 越南
- 泰國
- 馬來西亞
- 新加坡
- 其他東南亞國家
第6章 競爭情勢
- 市場集中度
- 策略趨勢
- 供應商定位分析
- 公司簡介
- Prysmian SpA
- Nexans SA
- Sumitomo Electric Industries, Ltd.
- Furukawa Electric Co., Ltd.
- LS Cable & System Ltd.
- Belden Inc.
- Tai Sin Electric Limited
- Bangkok Cable Co., Ltd.
- PT KMI Wire and Cable Tbk
- PT Voksel Electric Tbk
- PT Jembo Cable Company Tbk
- PT Supreme Cable Manufacturing & Commerce Tbk
- PT Sumi Indo Kabel Tbk
- PT Tranka Kabel Indonesia
- Nanyang Cable Group
- TE Connectivity Ltd.
- Corning Incorporated
- CommScope Holding Company, Inc.
- ZTT Group
- Fujikura Ltd.
第7章 市場機會與未來展望
According to Mordor Intelligence, the Southeast Asia wire and cable market size was valued at USD 4.68 billion in 2025 and is estimated to grow from USD 5.20 billion in 2026 to reach USD 6.85 billion by 2031, at a CAGR of 5.67% during the forecast period (2026-2031).
This report is Segmented by Voltage (Extra- and High-Voltage (Greater Than 35 KV), and More), Cable Type (Power Cable, and More), Conductor Material (Copper, Aluminum, and More), Installation (Overhead, Underground, and Submarine), End-User Vertical (Residential Construction, and More), Insulation (Insulated, and More), and Country. The Market Forecasts are Provided in Terms of Value (USD).
Southeast Asia Wire and Cable Market Trends and Insights
ASEAN Power Grid Interconnector Build-Out
The ASEAN Power Grid Financing Initiative was launched in October 2025 by the Asian Development Bank, the World Bank, the ASEAN Secretariat, and the ASEAN Center for Energy. It brought together more than USD 12.5 billion in committed financing, including USD 10 billion from the Asian Development Bank over 10 years and USD 2.5 billion from the World Bank. The ASEAN Interconnection Masterplan Study III identified USD 764 billion in transmission and generation investment needed for a high-renewables grid by 2045. The International Energy Agency identified USD 27 billion in cross-border interconnection spending in its base case between 2025 and 2040. In 2025, ASEAN energy ministers identified subsea cables as a key building block for the regional grid. Individual high-voltage direct current (HVDC) subsea projects can exceed USD 1 billion and provide demand for the Southeast Asia wire and cable market.
Data Center and Cloud Infrastructure Expansion
Data center construction increases demand for power and optical cable systems across the Southeast Asia wire and cable market. AI-optimized facilities operate at 10-20 kW per rack, compared with 3-5 kW for legacy computing facilities. This higher power density increases the need for medium- and high-voltage cables within each data hall and at the grid connection. Digital Edge announced a USD 4.5 billion investment for a 500 MW AI-ready campus in Bekasi, Indonesia, in January 2026. AirTrunk announced MYR 12 billion (USD 2.7 billion) for 2 campuses in Johor Bahru. Hyperscale operators also use 10-15-year power purchase agreements, which support phased site development and later cable upgrades.
Copper and Aluminum Price Volatility
London Metal Exchange copper reached a record intraday price of USD 14,527.50 per tonne in January 2026. The copper-to-aluminum price ratio reached 4.3, exceeding the 3.5-4.0 range where cable buyers consider material substitution. Copper can account for 70-85% of cable production cost, exposing manufacturers to sharp changes in input costs. High metal prices create uncertainty for distribution network contracts and can delay final investment decisions. They can also lead developers to re-tender projects when quoted cable prices no longer fit project budgets. Reuters reported that Nexans expected global grid investment of EUR 10 trillion (USD 11.3 trillion) by 2030. Long-term grid investment, therefore, remains supportive, even as near-term pricing disruptions disrupt procurement.
Other drivers and restraints analyzed in the detailed report include:
- Renewable Energy Integration and Grid Modernization
- Urban Undergrounding and Climate-Resilient Network Construction
- High Capital Requirements for Submarine and Extra-High-Voltage Projects
For complete list of drivers and restraints, kindly check the Table Of Contents.
Segment Analysis
Low-voltage cables, below 1 kV, captured 46.84% of regional revenue in 2025. Residential wiring, commercial construction, and industrial park electrification supported this position in Indonesia, Vietnam, and the Philippines. These applications create recurring volume demand because they are used across buildings and manufacturing sites. Housing completions and industrial-zone construction, therefore, remain important for the segment. Medium-voltage cables, ranging from 1 to 35 kV, are used for distribution grid extensions and solar photovoltaic connections. They also support utility smart-grid programs in Thailand and Malaysia. Demand in these markets is linked to renewable capacity additions and distribution upgrades. Low-voltage products remain central to broad construction activity across the region.
Extra- and high-voltage cables, above 35 kV, are projected to expand at a 7.06% CAGR from 2026 to 2031. This is the fastest growth rate within the voltage categories. Indonesia's 47,758 circuit-kilometer green supergrid program supports demand for these systems. Vietnam's 400 kV expansion under the National Power Development Plan 8 also requires increased capacity for higher-voltage cables. ASEAN cross-border interconnection projects add another source of demand. Taihan Cable Vina began construction of Vietnam's first 400 kV-class extra-high-voltage cable plant in March 2026. The plant is expected to reduce reliance on imported supplies for domestic projects. Regional production could also shorten lead times for future project awards.
Power cables accounted for 68.76% of the Southeast Asia wire and cable market size in 2025. They are required across low-voltage building distribution and high-voltage bulk transmission. This broad application base supports their leading revenue position. Every major end-user group in the regional cable supply chain uses Power cables. This makes the category essential to the Southeast Asia wire and cable market. Coaxial and data cables serve commercial connectivity, cable television, and legacy corporate networks. Their growth is more limited where fiber replaces copper-based links in high-bandwidth applications. Signal and control cables support industrial automation, oil and gas facilities, and building management systems. Manufacturing development in Thailand's Eastern Economic Corridor and Indonesia's Special Economic Zones supports demand for these products.
Fiber-optic cables are projected to expand at a 7.48% CAGR from 2026 to 2031. Data center interconnects, 5G fronthaul, 5G backhaul, and submarine digital links support expansion across the Southeast Asia wire and cable market. The Nongsa-Changi subsea cable was landed in Batam in July 2026. It spans 50 km and has 24 fiber pairs. It was the first cable system to land at Nongsa Digital Park. The project strengthened Indonesia-Singapore connectivity ahead of the planned ASEAN Digital Economy Framework. Vietnam and the Philippines also recorded higher cable consumption alongside large digital infrastructure programs.
Complete Report Scope:
- By Voltage
- Extra- and High-Voltage (Greater Than 35 kV)
- Medium-Voltage (1-35 kV)
- Low-Voltage (Less Than 1 kV)
- By Cable Type
- Power Cable
- Fiber-Optic Cable
- Signal and Control Cable
- Coaxial and Data Cable
- By Conductor Material
- Copper
- Aluminum
- Optical Glass/Polymer
- By Installation
- Overhead
- Underground
- Submarine
- By End-User Vertical
- Residential Construction
- Commercial Construction
- Power Infrastructure (Utilities and Renewables)
- Telecommunications and Data Centers
- Oil and Gas and Petrochemicals
- Automotive and Mobility
- Industrial Manufacturing
- By Insulation
- Insulated
- Non-Insulated
- By Country
- Indonesia
- Vietnam
- Thailand
- Malaysia
- Singapore
- Rest of Southeast Asia
List of Companies Covered in this Report:
- Prysmian S.p.A.
- Nexans S.A.
- Sumitomo Electric Industries, Ltd.
- Furukawa Electric Co., Ltd.
- LS Cable & System Ltd.
- Belden Inc.
- Tai Sin Electric Limited
- Bangkok Cable Co., Ltd.
- PT KMI Wire and Cable Tbk
- PT Voksel Electric Tbk
- PT Jembo Cable Company Tbk
- PT Supreme Cable Manufacturing & Commerce Tbk
- PT Sumi Indo Kabel Tbk
- PT Tranka Kabel Indonesia
- Nanyang Cable Group
- TE Connectivity Ltd.
- Corning Incorporated
- CommScope Holding Company, Inc.
- ZTT Group
- Fujikura Ltd.
Additional Benefits:
- The market estimate (ME) sheet in Excel format
- 3 months of analyst support
TABLE OF CONTENTS
1 INTRODUCTION
- 1.1 Study Assumptions and Market Definition
- 1.2 Scope of the Study
2 RESEARCH METHODOLOGY
3 EXECUTIVE SUMMARY
4 MARKET LANDSCAPE
- 4.1 Market Overview
- 4.2 Market Drivers
- 4.2.1 ASEAN Power Grid Interconnector Build-Out
- 4.2.2 Data Center and Cloud Infrastructure Expansion
- 4.2.3 Renewable Energy Integration and Grid Modernization
- 4.2.4 Urban Undergrounding and Climate-Resilient Network Construction
- 4.2.5 Manufacturing Relocation and Industrial Automation
- 4.2.6 Fiber-Optic Expansion for 5G and Cross-Border Connectivity
- 4.3 Market Restraints
- 4.3.1 Copper and Aluminum Price Volatility
- 4.3.2 High Capital Requirements for Submarine and Extra-High-Voltage Projects
- 4.3.3 Fragmented National Standards and Permitting Processes
- 4.3.4 Counterfeit and Non-Compliant Cable Products
- 4.4 Industry Supply Chain Analysis
- 4.5 Regulatory Landscape
- 4.6 Technological Outlook
- 4.7 Impact of Macroeconomic Factors on the Market
- 4.8 Investment Analysis
- 4.9 Porter's Five Forces Analysis
- 4.9.1 Bargaining Power of Suppliers
- 4.9.2 Bargaining Power of Buyers
- 4.9.3 Threat of New Entrants
- 4.9.4 Threat of Substitutes
- 4.9.5 Intensity of Competitive Rivalry
5 MARKET SIZE AND GROWTH FORECASTS (VALUE)
- 5.1 By Voltage
- 5.1.1 Extra- and High-Voltage (Greater Than 35 kV)
- 5.1.2 Medium-Voltage (1-35 kV)
- 5.1.3 Low-Voltage (Less Than 1 kV)
- 5.2 By Cable Type
- 5.2.1 Power Cable
- 5.2.2 Fiber-Optic Cable
- 5.2.3 Signal and Control Cable
- 5.2.4 Coaxial and Data Cable
- 5.3 By Conductor Material
- 5.3.1 Copper
- 5.3.2 Aluminum
- 5.3.3 Optical Glass/Polymer
- 5.4 By Installation
- 5.4.1 Overhead
- 5.4.2 Underground
- 5.4.3 Submarine
- 5.5 By End-User Vertical
- 5.5.1 Residential Construction
- 5.5.2 Commercial Construction
- 5.5.3 Power Infrastructure (Utilities and Renewables)
- 5.5.4 Telecommunications and Data Centers
- 5.5.5 Oil and Gas and Petrochemicals
- 5.5.6 Automotive and Mobility
- 5.5.7 Industrial Manufacturing
- 5.6 By Insulation
- 5.6.1 Insulated
- 5.6.2 Non-Insulated
- 5.7 By Country
- 5.7.1 Indonesia
- 5.7.2 Vietnam
- 5.7.3 Thailand
- 5.7.4 Malaysia
- 5.7.5 Singapore
- 5.7.6 Rest of Southeast Asia
6 COMPETITIVE LANDSCAPE
- 6.1 Market Concentration
- 6.2 Strategic Moves
- 6.3 Vendor Positioning Analysis
- 6.4 Company Profiles (includes Global Level Overview, Market Level Overview, Core Segments, Financials as available, Strategic Information, Market Rank/Share, Products and Services, Recent Developments)
- 6.4.1 Prysmian S.p.A.
- 6.4.2 Nexans S.A.
- 6.4.3 Sumitomo Electric Industries, Ltd.
- 6.4.4 Furukawa Electric Co., Ltd.
- 6.4.5 LS Cable & System Ltd.
- 6.4.6 Belden Inc.
- 6.4.7 Tai Sin Electric Limited
- 6.4.8 Bangkok Cable Co., Ltd.
- 6.4.9 PT KMI Wire and Cable Tbk
- 6.4.10 PT Voksel Electric Tbk
- 6.4.11 PT Jembo Cable Company Tbk
- 6.4.12 PT Supreme Cable Manufacturing & Commerce Tbk
- 6.4.13 PT Sumi Indo Kabel Tbk
- 6.4.14 PT Tranka Kabel Indonesia
- 6.4.15 Nanyang Cable Group
- 6.4.16 TE Connectivity Ltd.
- 6.4.17 Corning Incorporated
- 6.4.18 CommScope Holding Company, Inc.
- 6.4.19 ZTT Group
- 6.4.20 Fujikura Ltd.
7 MARKET OPPORTUNITIES AND FUTURE OUTLOOK
- 7.1 White-Space and Unmet-Need Assessment

 亞太地區電線電纜市場:市場佔有率分析、產業趨勢與統計、成長預測(2026-2031)北美電線電纜:市場佔有率分析、產業趨勢與統計及成長預測(2026-2031 年)亞太地區低菸無鹵(LSZH)電纜:市場佔有率分析、產業趨勢與統計及成長預測(2026-2031 年)歐洲低菸無鹵 (LSZH) 電纜:市場佔有率分析、產業趨勢和統計數據以及成長預測 (2026-2031)越南電線電纜市場:市場佔有率分析、產業趨勢與統計及成長預測(2026-2031)中東和非洲低菸無鹵 (LSZH) 電纜:市場佔有率分析、行業趨勢和統計數據以及成長預測 (2026-2031)中東電線電纜市場:市場佔有率分析、產業趨勢與統計、成長預測(2026-2031年)非洲電線電纜市場:市場佔有率分析、產業趨勢與統計、成長預測(2026-2031 年)北美低菸無鹵(LSZH)電纜:市場佔有率分析、產業趨勢和統計數據以及成長預測(2026-2031 年)德國電線電纜市場:市場佔有率分析、產業趨勢與統計、成長預測(2026-2031)