


 |
市場調查報告書
商品編碼
2119065
非洲電線電纜市場:市場佔有率分析、產業趨勢與統計、成長預測(2026-2031 年)Africa Wire and Cable - Market Share Analysis, Industry Trends & Statistics, Growth Forecasts (2026 - 2031) |
||||||

※ 本網頁內容可能與最新版本有所差異。詳細情況請與我們聯繫。
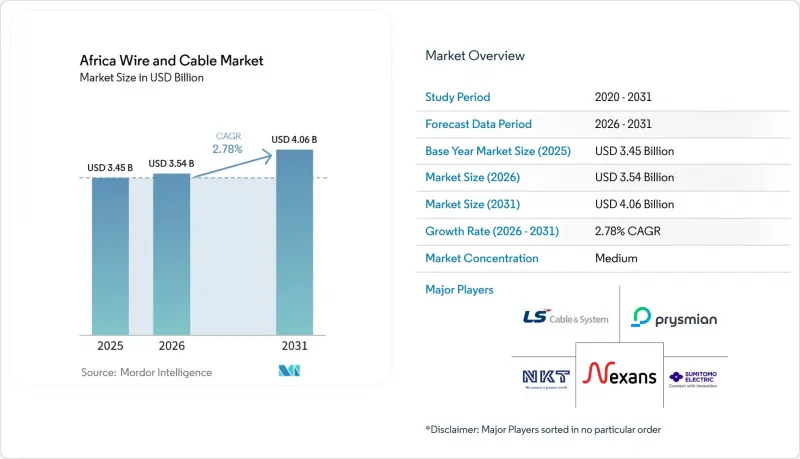
據 Mordor Intelligence 稱,2025 年非洲電線電纜市場價值 34.5 億美元,預計到 2031 年將達到 40.6 億美元,而 2026 年為 35.5 億美元,預測期內(2026-2031 年)的複合年預計成長率為 2.78%。
本報告按電壓等級(低壓、中壓、超高壓)、電纜類型(電力電纜、光纖電纜等)、導體材質(銅等)、安裝方式(架空、地下、水下)、最終用戶(建築(住宅)、其他)、絕緣方式(絕緣、非絕緣)以及地區(阿爾及利亞、肯亞、摩洛哥等)進行細分。市場預測以美元計價。
非洲電線電纜市場的趨勢與洞察
跨境電力聯營和多邊融資促進國內電氣化
多邊資金籌措支持了區域電力池對輸配電電纜的長期需求。 2025年,世界銀行批准了16億美元的資金,用於透過輸電網、跨境互聯和隔日交易市場來加強東非電力池(EAPP)。該計劃旨在2031年支持每年超過5000吉瓦時的跨國電力交易。喀麥隆-乍得互聯計畫也獲得了世界銀行、非洲開發銀行、伊斯蘭開發銀行和歐盟的共同融資,喀麥隆-乍得電力池總體規劃於2026年第二季最終確定。這些項目創造了對輸電線路建設、變電站整合以及後續配電網路擴建的需求。非洲電線電纜市場受益於區域項目,因為與孤立的區域項目相比,這些項目需要通用的技術規範和更長的採購計劃。
可再生能源和電網連接電纜的開發
對可再生能源的投資增加了發電廠與需求中心之間電纜連接的需求。 2020年至2025年間,非洲在清潔能源技術領域投資了340億美元,其中太陽能佔52%,陸上風電佔25%。由於許多太陽能和風能資源遠離主要城市,每個新計畫都會增加輸電需求。這一趨勢推動了對高壓系統、電網連接和變電站電纜的需求。摩洛哥提案的「西拉大西洋走廊」將15吉瓦的可再生能源發電容量與一條連接歐洲的4800公里海底電纜結合。因此,非洲電線電纜市場受益於既需要電力側連接又需要長距離輸電基礎設施的項目。
銅、鋁和聚合物的價格波動
原料成本仍然是電纜製造商和專案承包商面臨的直接商業風險。對於許多類型的電纜而言,銅棒佔原料成本的55%至65%,而尚比亞和剛果民主共和國以外地區有限的提煉能力使其極易受到全球價格波動的影響。銅價在2025年之前上漲了40%,並在2026年1月短暫突破每噸14,000美元,之後回落至每噸11,980美元。這種價格波動給固定價格合約和營運資金帶來了壓力,尤其是對中小製造商而言。鋁和絕緣材料也因受到全球大宗商品和能源價格波動的影響而加重了成本負擔。由於低價進口產品與本地製造的產品競爭,而本地製造的產品合規性和物流成本更高,非洲電線電纜市場面臨更大的壓力。
細分市場分析
2025年,低壓電纜在非洲電線電纜市場佔有率中佔56.38%,主要由住宅佈線、末端配電和商業建築需求驅動。這項裝機需求反映了家庭和小規模企業連接電網的必要性。配電網的擴張地域分佈廣泛,主要受住宅和零售設施的開發以及公共設施建設的推動。與輸電主導的採購相比,這些應用領域的需求集中度較低。由於配電網擴張需要進行線路延伸、更換和新增服務連接,低壓產品在電網升級中也繼續發揮至關重要的作用。中壓電纜則應用於工業設施、商業區、農業產業園區及電網密集化工程。南非、肯亞和埃及的國家標準使得供應商在這些應用領域競爭時,合規能力至關重要。
預計2026年至2031年間,超高壓和高壓電纜的複合年成長率將達到3.24%,成為電壓等級電纜中成長最快的細分市場。推動此細分市場成長的主要因素是聯網線路和可再生能源走廊對專用導體及相關配件的需求。大規模輸電專案也需要變電站、測試和安裝方面的專業知識。在非洲電線電纜市場,這些因素有利於那些擁有技術先進專案經驗和認證品管系統的供應商。
到2025年,電力電纜將佔非洲電線電纜市場規模的64.72%,成為銷量領先的電纜類型。電氣化、電網現代化和可再生能源併網推動了電力電纜的廣泛需求。電力電纜為電力傳輸、分配以及大型工業用電系統提供關鍵電力。訊號和控制電纜滿足了煉油廠、礦山、工廠和其他製程作業的需求。同軸電纜和數據電纜在傳統通訊系統和都市區監控設備中繼續發揮至關重要的作用。
預計到2031年,光纖電纜的複合年成長率將達到3.37%,在所有電纜類型中增速最高。海底系統登陸後需要陸上光纖線路,而新建資料設施則需要高密度的內部和外部光纖連接。在地化生產的重要性也日益凸顯,科爾曼電線電纜公司(Coleman Wire and Cables)於2025年在奧貢省運作了一家光纖工廠。該廠年產能為900萬根光纖,旨在滿足非洲大陸高達50%的光纖需求。光纖領域的投資已將非洲的電線電纜市場拓展到電力基礎設施之外,網路營運商、資料中心開發商和電信業者等也紛紛加入,成為新的買家。
其他好處:
- Excel格式的市場預測(ME)表
- 3個月的分析師支持
目錄
第1章:引言
- 市場分析與定義的前提條件
- 分析範圍
第2章 分析方法
第3章執行摘要
第4章 市場狀況
- 市場概覽
- 市場促進因素
- 跨境電力聯營和各國電力分配的多邊資金籌措
- 可再生能源和電網連接電纜的開發
- 光纖骨幹網路、海底電纜登陸和資料中心擴建
- 建築業的都市化、工業化和電氣化
- 網路升級以防止電纜被盜、非技術性損失和盜竊。
- 在地採購及進口替代製造
- 市場限制因素
- 銅、鋁和聚合物的價格波動
- 貨幣貶值和高昂的專案融資成本
- 標準、海關程序以及跨境物流的碎片化
- 缺乏高壓連接、測試和安裝方面的技能。
- 產業供應鏈分析
- 監理情勢
- 技術展望
- 宏觀經濟因素對市場的影響
- 投資分析
- 波特五力分析
第5章:預測市場規模與成長率
- 透過電壓
- 超高壓/高壓(35千伏特或更高)
- 中壓(1-35千伏特)
- 低電壓(低於1千伏特)
- 按電纜類型
- 電源線
- 光纖電纜
- 訊號和控制電纜
- 同軸電纜和資料電纜
- 按導體材料
- 銅
- 鋁
- 光學玻璃/聚合物
- 透過安裝方法
- 虛構的
- 地下
- 海底
- 按最終用戶行業分類
- 建築(住宅)
- 建築(商業設施)
- 電力基礎設施(公用事業、可再生能源)
- 通訊和資料中心
- 石油和天然氣、石油化學產品
- 汽車與出行
- 工業/製造業
- 絕緣類型
- 帶隔熱材料
- 無隔熱材料
- 國家
- 阿爾及利亞
- 肯亞
- 摩洛哥
- 南非
- 奈及利亞
- 迦納
- 埃及
- 坦尚尼亞
- 其他非洲國家
第6章 競爭情勢
- 市場集中度
- 策略趨勢
- 市佔率分析
- 供應商定位分析
- 公司簡介
- Prysmian SpA
- Nexans SA
- Sumitomo Electric Industries, Ltd.
- LS Cable & System Ltd.
- NKT A/S
- Elsewedy Electric SAE
- CBI-electric:african cables
- Aberdare Cables(Pty)Ltd
- Malesela Taihan Electric Cable(M-TEC)
- Coleman Wires and Cables
- East African Cables Plc
- Nigerian Wire and Cable Plc
- MicCom Cables & Wires Ltd
- Riyadh Cables Group Company
- Ducab Group
- Hengtong Optic-Electric Co., Ltd.
- ZTT Group
- Corning Incorporated
- CommScope Holding Company, Inc.
- Nexans Maroc
第7章 市場機會與未來展望
According to Mordor Intelligence, the Africa wire and cable market size was valued at USD 3.45 billion in 2025 and estimated to grow from USD 3.55 billion in 2026 to reach USD 4.06 billion by 2031, at a CAGR of 2.78% during the forecast period (2026-2031).
This report is Segmented by Voltage (Low, Medium, and Extra- and High-Voltage), Cable Type (Power, Fiber-Optic, and More), Conductor (Copper, and More), Installation (Overhead, Underground, and Submarine), End-User (Construction - Residential, and More), Insulation (Insulated, and Non-Insulated) and Geography (Algeria, Kenya, Morocco, and More). The Market Forecasts are Provided in Terms of Value (USD).
Africa Wire and Cable Market Trends and Insights
Multilateral Financing for Cross-Border Power Pools and National Electrification
Multilateral financing supported long-term demand for transmission and distribution cables across regional power pools. The World Bank approved USD 1.6 billion in 2025 to strengthen the Eastern Africa Power Pool through transmission networks, cross-border interconnection, and a day-ahead market. The program was designed to support more than 5,000 gigawatt-hours of annual cross-border electricity trade by 2031. The Cameroon-Chad interconnection also drew co-financing from the World Bank, the African Development Bank, the Islamic Development Bank, and the European Union, while the CAPP Master Plan was finalized in the second quarter of 2026. These projects created demand during transmission construction, substation integration, and later distribution expansion. The Africa wire and cable market benefited because regional projects require common technical specifications and longer procurement programs than isolated local works.
Renewable Energy and Grid-Connection Cable Build-Out
Renewable energy investment increased the need for cable links between generation sites and demand centers. Africa invested USD 34 billion in clean power technologies from 2020 through 2025, with solar receiving 52% and onshore wind receiving 25%. Many solar and wind resources are located far from major cities, which increases transmission requirements for each new project. This pattern supported demand for high-voltage systems, grid connections, and substation cable. Morocco's proposed Sila Atlantik corridor combined 15 gigawatts of renewable capacity with a planned 4,800-kilometer subsea link to Europe. The Africa wire and cable market, therefore, benefited from projects that required both generation-side connections and long-distance export infrastructure.
Copper, Aluminum, and Polymer Price Volatility
Material costs remained a direct commercial risk for cable producers and project contractors. Copper rod accounted for 55-65% of raw material costs across many cable types, and limited refining outside Zambia and the Democratic Republic of Congo increased exposure to global pricing. Copper prices rose by 40% over 2025 and briefly exceeded USD 14,000 per ton in January 2026 before falling to USD 11,980 per ton. This movement put pressure on fixed-price contracts and working capital, especially for smaller manufacturers. Aluminum and insulation compounds added to the cost burden because they were also subject to global commodity and energy price movements. The Africa wire and cable market faced additional pressure as low-priced imports competed with locally manufactured products, which incurred higher compliance and logistics costs.
Other drivers and restraints analyzed in the detailed report include:
- Fiber Backbone, Submarine Landing, and Data Center Expansion
- Urbanization, Industrialization, and Construction Electrification
- Currency Depreciation and High Project Financing Costs
For complete list of drivers and restraints, kindly check the Table Of Contents.
Segment Analysis
Low-Voltage cable held 56.38% of the Africa wire and cable market share in 2025, supported by residential wiring, last-mile distribution, and commercial construction. This installed-demand base reflected the continuing need to connect households and smaller businesses to electricity networks. Distribution expansion has a broad geographic footprint because it accompanies formal housing, retail development, and public facilities. These applications make demand less concentrated than transmission-led procurement. Low-voltage products also remained important during grid upgrades, as distribution networks require extensions, replacements, and new service connections. Medium-Voltage cable served industrial facilities, commercial districts, agro-industrial parks, and grid densification programs. National requirements in South Africa, Kenya, and Egypt made compliance capability important for suppliers competing in these applications.
Extra- and High-Voltage cable is projected to expand at a 3.24% CAGR from 2026 through 2031, making it the fastest-growing voltage category. The segment was supported by power pool interconnectors and renewable corridors that required specialized conductors and related accessories. Large transmission schemes also depended on substations, testing, and installation expertise. In the Africa wire and cable market, these factors favored suppliers with a record in technically demanding projects and certified quality systems.
Power Cable accounted for 64.72% of the Africa wire and cable market size in 2025, making it the leading cable type by revenue. Electrification, grid renewal, and renewable power connections sustained their broad demand base. This category supplied the primary systems used for transmission, distribution, and major industrial power needs. Signal and Control Cable met requirements in refineries, mining sites, factories, and other process operations. Coaxial and Data Cable remained relevant for legacy telecommunications systems and urban surveillance installations.
Fiber-Optic Cable is projected to grow at a 3.37% CAGR through 2031, the highest rate among cable types. Subsea systems required terrestrial fiber routes after landing, and new data facilities needed dense internal and external optical connections. Local production was also becoming more important, as Coleman Wires and Cables commissioned a fiber-optic plant in Ogun State during 2025. The plant was described as having an annual capacity of 9 million fibers and was intended to serve up to 50% of continental fiber demand. Fiber investment broadened the Africa wire and cable market beyond power infrastructure and brought network operators, data center developers, and telecommunications firms into the buyer base.
Complete Report Scope:
- By Voltage
- Extra- and High-Voltage (Greater Than 35 kV)
- Medium-Voltage (1-35 kV)
- Low-Voltage (Less Than 1 kV)
- By Cable Type
- Power Cable
- Fiber-Optic Cable
- Signal and Control Cable
- Coaxial and Data Cable
- By Conductor Material
- Copper
- Aluminum
- Optical Glass/Polymer
- By Installation
- Overhead
- Underground
- Submarine
- By End-User Vertical
- Construction - Residential
- Construction - Commercial
- Power Infrastructure (Utilities and Renewables)
- Telecommunications and Data Centers
- Oil and Gas and Petrochemicals
- Automotive and Mobility
- Industrial Manufacturing
- By Insulation
- Insulated
- Non-Insulated
- By Country
- Algeria
- Kenya
- Morocco
- South Africa
- Nigeria
- Ghana
- Egypt
- Tanzania
- Rest of Africa
List of Companies Covered in this Report:
- Prysmian S.p.A.
- Nexans S.A.
- Sumitomo Electric Industries, Ltd.
- LS Cable & System Ltd.
- NKT A/S
- Elsewedy Electric S.A.E.
- CBI-electric: african cables
- Aberdare Cables (Pty) Ltd
- Malesela Taihan Electric Cable (M-TEC)
- Coleman Wires and Cables
- East African Cables Plc
- Nigerian Wire and Cable Plc
- MicCom Cables & Wires Ltd
- Riyadh Cables Group Company
- Ducab Group
- Hengtong Optic-Electric Co., Ltd.
- ZTT Group
- Corning Incorporated
- CommScope Holding Company, Inc.
- Nexans Maroc
Additional Benefits:
- The market estimate (ME) sheet in Excel format
- 3 months of analyst support
TABLE OF CONTENTS
1 INTRODUCTION
- 1.1 Study Assumptions and Market Definition
- 1.2 Scope of the Study
2 RESEARCH METHODOLOGY
3 EXECUTIVE SUMMARY
4 MARKET LANDSCAPE
- 4.1 Market Overview
- 4.2 Market Drivers
- 4.2.1 Multilateral Financing for Cross-Border Power Pools and National Electrification
- 4.2.2 Renewable Energy and Grid-Connection Cable Build-Out
- 4.2.3 Fiber Backbone, Submarine Landing, and Data Center Expansion
- 4.2.4 Urbanization, Industrialization, and Construction Electrification
- 4.2.5 Cable Theft, Nontechnical Losses, and Anti-Theft Network Replacement
- 4.2.6 Local-Content Procurement and Import-Substitution Manufacturing
- 4.3 Market Restraints
- 4.3.1 Copper, Aluminum, and Polymer Price Volatility
- 4.3.2 Currency Depreciation and High Project Financing Costs
- 4.3.3 Fragmented Standards, Customs, and Cross-Border Logistics
- 4.3.4 Shortage of High-Voltage Jointing, Testing, and Installation Skills
- 4.4 Industry Supply Chain Analysis
- 4.5 Regulatory Landscape
- 4.6 Technological Outlook
- 4.7 Impact of Macroeconomic Factors on the Market
- 4.8 Investment Analysis
- 4.9 Porter's Five Forces Analysis
- 4.9.1 Bargaining Power of Suppliers
- 4.9.2 Bargaining Power of Buyers
- 4.9.3 Threat of New Entrants
- 4.9.4 Threat of Substitutes
- 4.9.5 Intensity of Competitive Rivalry
5 MARKET SIZE AND GROWTH FORECASTS (VALUE)
- 5.1 By Voltage
- 5.1.1 Extra- and High-Voltage (Greater Than 35 kV)
- 5.1.2 Medium-Voltage (1-35 kV)
- 5.1.3 Low-Voltage (Less Than 1 kV)
- 5.2 By Cable Type
- 5.2.1 Power Cable
- 5.2.2 Fiber-Optic Cable
- 5.2.3 Signal and Control Cable
- 5.2.4 Coaxial and Data Cable
- 5.3 By Conductor Material
- 5.3.1 Copper
- 5.3.2 Aluminum
- 5.3.3 Optical Glass/Polymer
- 5.4 By Installation
- 5.4.1 Overhead
- 5.4.2 Underground
- 5.4.3 Submarine
- 5.5 By End-User Vertical
- 5.5.1 Construction - Residential
- 5.5.2 Construction - Commercial
- 5.5.3 Power Infrastructure (Utilities and Renewables)
- 5.5.4 Telecommunications and Data Centers
- 5.5.5 Oil and Gas and Petrochemicals
- 5.5.6 Automotive and Mobility
- 5.5.7 Industrial Manufacturing
- 5.6 By Insulation
- 5.6.1 Insulated
- 5.6.2 Non-Insulated
- 5.7 By Country
- 5.7.1 Algeria
- 5.7.2 Kenya
- 5.7.3 Morocco
- 5.7.4 South Africa
- 5.7.5 Nigeria
- 5.7.6 Ghana
- 5.7.7 Egypt
- 5.7.8 Tanzania
- 5.7.9 Rest of Africa
6 COMPETITIVE LANDSCAPE
- 6.1 Market Concentration
- 6.2 Strategic Moves
- 6.3 Market Share Analysis
- 6.4 Vendor Positioning Analysis
- 6.5 Company Profiles (includes Global Level Overview, Market Level Overview, Core Segments, Financials as available, Strategic Information, Market Rank/Share, Products and Services, Recent Developments)
- 6.5.1 Prysmian S.p.A.
- 6.5.2 Nexans S.A.
- 6.5.3 Sumitomo Electric Industries, Ltd.
- 6.5.4 LS Cable & System Ltd.
- 6.5.5 NKT A/S
- 6.5.6 Elsewedy Electric S.A.E.
- 6.5.7 CBI-electric: african cables
- 6.5.8 Aberdare Cables (Pty) Ltd
- 6.5.9 Malesela Taihan Electric Cable (M-TEC)
- 6.5.10 Coleman Wires and Cables
- 6.5.11 East African Cables Plc
- 6.5.12 Nigerian Wire and Cable Plc
- 6.5.13 MicCom Cables & Wires Ltd
- 6.5.14 Riyadh Cables Group Company
- 6.5.15 Ducab Group
- 6.5.16 Hengtong Optic-Electric Co., Ltd.
- 6.5.17 ZTT Group
- 6.5.18 Corning Incorporated
- 6.5.19 CommScope Holding Company, Inc.
- 6.5.20 Nexans Maroc
7 MARKET OPPORTUNITIES AND FUTURE OUTLOOK
- 7.1 White-Space and Unmet-Need Assessment

 亞太地區電線電纜市場:市場佔有率分析、產業趨勢與統計、成長預測(2026-2031)北美電線電纜:市場佔有率分析、產業趨勢與統計及成長預測(2026-2031 年)亞太地區低菸無鹵(LSZH)電纜:市場佔有率分析、產業趨勢與統計及成長預測(2026-2031 年)歐洲低菸無鹵 (LSZH) 電纜:市場佔有率分析、產業趨勢和統計數據以及成長預測 (2026-2031)越南電線電纜市場:市場佔有率分析、產業趨勢與統計及成長預測(2026-2031)中東和非洲低菸無鹵 (LSZH) 電纜:市場佔有率分析、行業趨勢和統計數據以及成長預測 (2026-2031)中東電線電纜市場:市場佔有率分析、產業趨勢與統計、成長預測(2026-2031年)北美低菸無鹵(LSZH)電纜:市場佔有率分析、產業趨勢和統計數據以及成長預測(2026-2031 年)德國電線電纜市場:市場佔有率分析、產業趨勢與統計、成長預測(2026-2031)東南亞電線電纜市場:市場佔有率分析、產業趨勢與統計、成長預測(2026-2031)