


 |
市場調查報告書
商品編碼
2119655
北美電線電纜:市場佔有率分析、產業趨勢與統計及成長預測(2026-2031 年)North America Wire And Cable - Market Share Analysis, Industry Trends & Statistics, Growth Forecasts (2026 - 2031) |
||||||

※ 本網頁內容可能與最新版本有所差異。詳細情況請與我們聯繫。
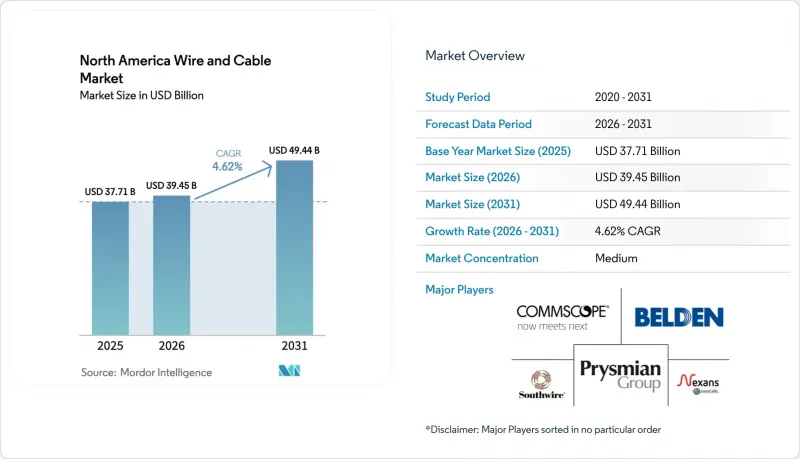
根據 Mordor Intelligence 預測,北美電線電纜市場規模將從 2025 年的 377.1 億美元成長到 2026 年的 394.5 億美元,到 2031 年將達到 494.4 億美元,2026 年至 2031 年的複合年成長率為 4.62%。
本報告按電纜類型(低壓電力電纜、中壓電力電纜等)、額定電壓(低於1千伏特、1-35千伏特等)、安裝方式(架空、地下等)、導體材料(銅、鋁等)、終端用戶行業(建築、工業製造等)和國家/地區進行細分。市場預測以美元計價。
北美電線電纜市場趨勢與洞察
基礎建設現代化投資
聯邦政府撥款650億美元用於電網升級,加速了老舊導線的更換,採用先進的鋁複合材料和耐熱設計。一項25億美元的韌性建設津貼金正促使電力公司傾向採用地下佈線和防火絕緣材料。國內採購條款確保了本地製造商的永續訂單前景,並使工廠能夠以更高的運轉率運作。地方政府公共產業和農村合作社也正在利用績效合約框架,將設計、施工和維護服務打包在一起,將專案前置作業時間縮短至兩年預算週期內。
引入智慧電網和電網加固
公共產業公司正在其所有輸電線路中試點部署光纖溫度感測線,透過獲取即時電流耐受數據來降低野火風險,從而延緩昂貴的導線更換。明尼蘇達州的一項部署驗證了這個概念驗證。同時,包括太平洋煤氣電力公司(PG&E)每年60億美元的支出在內的電網強化預算,推動了對能夠承受極端天氣條件的絕緣樹掛式導線和塗層導線系統的需求。網路安全監管要求進一步提高了混合電力和光纖電纜的規格,這些電纜不僅支援電力傳輸,還支援安全的資料通訊通道。
地下和海底安裝高成本
地下輸電線路的成本可能比架空線路高出4.5倍,但海底鋪設的工期取決於船舶的可用性和季節性天氣狀況。專業承包商車輛數量有限,導致每日租金上漲,工期延長,迫使電力公司在容錯性和資本預算之間權衡利弊。目前,線路設計軟體和協同鑽井方案是成本最佳化的關鍵。這些方案將電力、電信和天然氣管道整合到一次鑽井作業中,從而降低了每英尺的成本。
細分市場分析
2025年,低壓電力導線銷售額佔比達39.40%,主要得益於住宅和商業建築的強勁成長。同時,受電信營運商5G部署和雲端服務供應商人工智慧叢集建設的推動,光纖產品預計到2031年將以6.12%的複合年成長率成長。在北美電線電纜市場,光纖業務預計到2031年將成長32.8億美元。訊號和控制電纜也受益於工廠自動化維修,這些改造將感測器整合到整個生產線中。
採用可伸縮帶狀結構的複合纖維設計,可在緊湊的面積內儲存2000根光纜,進而降低電信業者的管線租賃成本。在資料中心,低菸無鹵護套正逐步獲得監管部門的批准,而抗彎曲的單模纖芯則改善了狹小托盤內的鬆弛管理。在電力產業,中壓屏蔽電纜仍是電網升級的主要組成部分,而高壓交聯聚乙烯(XLPE)和高壓直流(HVDC)擠出系統則應用於300公里長的離岸風力發電輸電線路。隨著公用事業公司整合資料網路,混合電力和光纖電纜正在增強北美電線電纜市場的協同效應。
2025年,1千伏以下的線路將佔出貨量的42.30%,主要用於住宅饋線和建築佈線。然而,36千伏至69千伏的線路將呈現最高的複合年成長率,達到6.03%,這反映了饋線主幹網的強化以及與可再生能源的融合。這些線路通常在郊區變電站中能夠提供最佳的成本和容量平衡,因此在規劃的資本預算中備受關注。
電力公司在69-220千伏線路升級改造中,指定使用先進的鋁複合材料和耐高溫、低垂度產品,以在不佔用更多土地的情況下將電流容量翻倍。這些規範提高了每英里導線的銷量,並增強了北美電線電纜市場的盈利。 IEEE C57標準的修訂(規定了更高的連續動作溫度)進一步證明了這些產品的應用價值。同時,商業地產建築規範的不斷修訂也增加了對智慧建築低壓電纜的需求,這些電纜支援PoE照明和人員佔用分析,從而擴大了低壓電纜領域的收入基礎。
其他好處:
- Excel格式的市場預測(ME)表
- 3個月的分析師支持
目錄
第1章:引言
- 研究假設和市場定義
- 調查範圍
第2章:調查方法
第3章執行摘要
第4章 市場狀況
- 市場概覽
- 市場促進因素
- 加大基礎建設現代化的投資
- 智慧電網和增強型電網容錯能力的採用正在加速推進。
- 大規模可再生能源專案對電纜的需求激增
- 面向邊緣資料中心和超大規模資料中心的光纖網路發展浪潮
- 兩黨共同提出的基礎建設法中的「購買美國貨」採購條款
- 用於離岸風力發電叢集的高壓直流地下輸電線路
- 市場限制因素
- 鋪設地下電纜和海底電纜成本高昂。
- 銅鋁價格波動
- 光纖/高壓設備安裝領域熟練勞工短缺
- 獲得新建走廊的許可和土地使用權的批准需要時間。
- 產業價值鏈分析
- 監理情勢
- 技術展望
- 波特五力分析
- 主要宏觀經濟趨勢對市場的影響
第5章 市場規模與成長預測
- 按電纜類型
- 低電壓電源線
- 中壓電力電纜
- 高壓/超高壓電纜
- 光纖電纜
- 訊號和控制電纜
- 同軸電纜和資料電纜
- 特殊電線(磁性電線、絞合電線等)
- 按額定電壓
- 小於1千伏
- 1~35 kV
- 36~69 kV
- 69~220 kV
- 透過安裝方法
- 虛構的
- 地下
- 海底
- 室內/建築物內
- 空中微導管
- 按導體材料
- 銅
- 鋁
- 銅包鋁
- 複合材料/高強度芯材
- 按最終用戶行業分類
- 建築(住宅和商業)
- 輸配電業務
- 通訊和資料中心
- 工業製造
- 汽車和交通運輸(電動車/鐵路)
- 可再生能源(太陽能、風能)
- 石油、天然氣和採礦業
- 軍事/國防
- 其他
- 國家
- 美國
- 加拿大
- 墨西哥
第6章 競爭情勢
- 市場集中度
- 策略趨勢
- 市佔率分析
- 公司簡介
- Prysmian Group USA, Inc.
- Nexans AmerCable Incorporated
- Southwire Company, LLC
- CommScope Holding Company, Inc.
- Belden Inc.
- Corning Incorporated
- TE Connectivity Corporation
- Amphenol Corporation
- LS Cable and System USA, Inc.
- Furukawa Electric Co., Ltd.(OFS Fitel, LLC)
- Leoni Cable Inc.
- Sumitomo Electric Wiring Systems, Inc.
- Encore Wire Corporation
- American Wire Group, LLC
- TPC Wire and Cable Corp.
- General Cable Technologies Corporation
- Superior Essex Inc.
- AFL Telecommunications LLC
- NKT North America Inc.
- KEI Industries North America, Inc.
- Hengtong Cable Americas Inc.
- Tratos USA Inc.
第7章 市場機會與未來展望
According to Mordor Intelligence, the North America wire and cable market size is expected to grow from USD 37.71 billion in 2025 to USD 39.45 billion in 2026 and is forecast to reach USD 49.44 billion by 2031 at 4.62% CAGR over 2026-2031.
This report is Segmented by Cable Type (Low-Voltage Energy Cable, Medium-Voltage Power Cable, and More), Voltage Rating (< 1 KV, 1-35 KV, and More), Installation Type (Overhead, Underground, and More), Conductor Material (Copper, Aluminium, and More), End-User Industry (Construction, Industrial Manufacturing, and More), and Country. The Market Forecasts are Provided in Terms of Value (USD).
North America Wire And Cable Market Trends and Insights
Infrastructure-modernization spending
A dedicated USD 65 billion federal allocation for grid upgrades is accelerating the replacement of aging conductors with advanced aluminum-composite and high-temperature designs, while USD 2.5 billion in resilience grants has shifted utility preferences toward underground routes and fire-resistant insulation. Domestic-content clauses guarantee local manufacturers sustained order visibility, enabling plants to run at higher asset-utilization rates. Municipal utilities and rural co-operatives are also tapping performance-contracting frameworks that bundle design, build, and maintenance services, compressing project lead times to within two-year budget cycles.
Smart-grid and grid-hardening roll-outs
Utilities piloting fiber-optic temperature-sensing strands across distribution lines obtain real-time ampacity data, deferring costly reconductoring and reducing wildfire risk; Minnesota's deployment illustrates the proof of concept. Parallel grid-hardening budgets, such as PG&E's USD 6 billion annual outlay, are steering demand toward insulated tree-wire and covered conductor systems able to withstand extreme weather. Regulatory cybersecurity mandates further elevate specifications for hybrid power-fiber cables that support secure data channels alongside energy transfer.
High underground and submarine installation cost
Underground distribution work can cost 4.5 times more than overhead construction, while submarine installation windows hinge on vessel availability and seasonal weather. Limited specialty-contractor fleets inflate day-rates and prolong project timelines, forcing utilities to balance resilience benefits against capital budgets. Cost-optimization now centers on route-engineering software and joint-trench programs that consolidate electrical, telecom, and gas conduits within a single excavation to dilute per-foot expenses.
Other drivers and restraints analyzed in the detailed report include:
- Utility-scale renewable cabling demand
- Edge-data-center and hyperscale fiber wave
- Copper and aluminum price volatility
For complete list of drivers and restraints, kindly check the Table Of Contents.
Segment Analysis
Low-voltage energy conductors sustained 39.40% revenue in 2025 on the back of resilient residential and commercial construction. Conversely, fiber-optic variants are registering a 6.12% CAGR to 2031, propelled by telco 5G roll-outs and cloud-provider AI clusters. The North America wire and cable market size for fiber segments is projected to add USD 3.28 billion by 2031. Signal-and-control lines also benefit from factory-automation retrofits that embed sensors across production lines.
Composite fiber designs with rollable ribbons enable 2,000-strand vaults in compact footprints, trimming duct-leasing costs for carriers. Low-smoke zero-halogen jackets are gaining code acceptance in data centers, while bend-insensitive single-mode cores improve slack management in tight trays. In power, medium-voltage shielded cables remain the workhorse for distribution upgrades, whereas high-voltage XLPE and HVDC extruded systems service 300 km offshore wind export runs. As utilities converge data and energy networks, hybrid power-fiber cables reinforce synergies within the North America wire and cable market.
The sub-1 kV bracket accounted for 42.30% shipments in 2025, anchored in residential feeders and building wiring. Yet, the 36-69 kV span exhibits the fastest 6.03% CAGR, mirroring feeder-backbone enhancements and renewable interconnections. This tier often delivers the best cost-capacity trade-off for suburban substations, explaining its outsized traction in planned capital budgets.
Utilities are specifying advanced aluminum-composite and high-temperature low-sag variants within 69-220 kV upgrades to double ampacity without wider rights-of-way. Such specifications lift conductor-per-mile revenues, reinforcing the North America wire and cable market's profitability. IEEE C57 revisions covering higher continuous-operating temperatures further legitimize adoption. Simultaneously, code cycles in commercial real estate push smart-building LV cabling to support PoE lighting and occupancy analytics, expanding the low-voltage revenue base.
Complete Report Scope:
- By Cable Type
- Low-Voltage Energy Cable
- Medium-Voltage Power Cable
- High / Extra-High-Voltage Cable
- Fiber-Optic Cable
- Signal and Control Cable
- Co-axial and Data Cable
- Specialty Wire (Magnet, Stranded, etc.)
- By Voltage Rating
- < 1 kV
- 1 - 35 kV
- 36 - 69 kV
- 69 - 220 kV
- By Installation Type
- Overhead
- Underground
- Submarine
- Indoor/Building
- Aerial Micro-duct
- By Conductor Material
- Copper
- Aluminium
- Copper-Clad Aluminium
- Composite/High-Strength Core
- By End-user Industry
- Construction (Residential and Commercial)
- Power Transmission and Distribution Utilities
- Telecommunications and Data Centres
- Industrial Manufacturing
- Automotive and Transportation (EV/Rail)
- Renewable Energy (Solar, Wind)
- Oil, Gas and Mining
- Military and Defence
- Other End-user Industries
- By Country
- United States
- Canada
- Mexico
List of Companies Covered in this Report:
- Prysmian Group USA, Inc.
- Nexans AmerCable Incorporated
- Southwire Company, LLC
- CommScope Holding Company, Inc.
- Belden Inc.
- Corning Incorporated
- TE Connectivity Corporation
- Amphenol Corporation
- LS Cable and System U.S.A., Inc.
- Furukawa Electric Co., Ltd. (OFS Fitel, LLC)
- Leoni Cable Inc.
- Sumitomo Electric Wiring Systems, Inc.
- Encore Wire Corporation
- American Wire Group, LLC
- TPC Wire and Cable Corp.
- General Cable Technologies Corporation
- Superior Essex Inc.
- AFL Telecommunications LLC
- NKT North America Inc.
- KEI Industries North America, Inc.
- Hengtong Cable Americas Inc.
- Tratos USA Inc.
Additional Benefits:
- The market estimate (ME) sheet in Excel format
- 3 months of analyst support
TABLE OF CONTENTS
1 INTRODUCTION
- 1.1 Study Assumptions and Market Definition
- 1.2 Scope of the Study
2 RESEARCH METHODOLOGY
3 EXECUTIVE SUMMARY
4 MARKET LANDSCAPE
- 4.1 Market Overview
- 4.2 Market Drivers
- 4.2.1 Rising investments in infrastructure modernisation
- 4.2.2 Accelerated smart-grid and grid-hardening roll-outs
- 4.2.3 Utility-scale renewable energy cabling demand surge
- 4.2.4 Edge-data-centre and hyperscale fibre build-out wave
- 4.2.5 "Buy-America" sourcing clauses in Bipartisan Infrastructure Law
- 4.2.6 HVDC underground links for offshore-wind clusters
- 4.3 Market Restraints
- 4.3.1 High installation costs for underground and submarine cables
- 4.3.2 Copper and aluminium price volatility
- 4.3.3 Skilled-labour bottlenecks for fibre/HV installations
- 4.3.4 Lengthy permitting and ROW approvals for new corridors
- 4.4 Industry Value Chain Analysis
- 4.5 Regulatory Landscape
- 4.6 Technological Outlook
- 4.7 Porter's Five Forces Analysis
- 4.7.1 Bargaining Power of Suppliers
- 4.7.2 Bargaining Power of Buyers
- 4.7.3 Threat of New Entrants
- 4.7.4 Threat of Substitutes
- 4.7.5 Intensity of Competitive Rivalry
- 4.8 Impact of Key Macroeconomic Trends on Market
5 MARKET SIZE AND GROWTH FORECASTS (VALUES)
- 5.1 By Cable Type
- 5.1.1 Low-Voltage Energy Cable
- 5.1.2 Medium-Voltage Power Cable
- 5.1.3 High / Extra-High-Voltage Cable
- 5.1.4 Fiber-Optic Cable
- 5.1.5 Signal and Control Cable
- 5.1.6 Co-axial and Data Cable
- 5.1.7 Specialty Wire (Magnet, Stranded, etc.)
- 5.2 By Voltage Rating
- 5.2.1 < 1 kV
- 5.2.2 1 - 35 kV
- 5.2.3 36 - 69 kV
- 5.2.4 69 - 220 kV
- 5.3 By Installation Type
- 5.3.1 Overhead
- 5.3.2 Underground
- 5.3.3 Submarine
- 5.3.4 Indoor/Building
- 5.3.5 Aerial Micro-duct
- 5.4 By Conductor Material
- 5.4.1 Copper
- 5.4.2 Aluminium
- 5.4.3 Copper-Clad Aluminium
- 5.4.4 Composite/High-Strength Core
- 5.5 By End-user Industry
- 5.5.1 Construction (Residential and Commercial)
- 5.5.2 Power Transmission and Distribution Utilities
- 5.5.3 Telecommunications and Data Centres
- 5.5.4 Industrial Manufacturing
- 5.5.5 Automotive and Transportation (EV/Rail)
- 5.5.6 Renewable Energy (Solar, Wind)
- 5.5.7 Oil, Gas and Mining
- 5.5.8 Military and Defence
- 5.5.9 Other End-user Industries
- 5.6 By Country
- 5.6.1 United States
- 5.6.2 Canada
- 5.6.3 Mexico
6 COMPETITIVE LANDSCAPE
- 6.1 Market Concentration
- 6.2 Strategic Moves
- 6.3 Market Share Analysis
- 6.4 Company Profiles (includes Global level Overview, Market level overview, Core Segments, Financials as available, Strategic Information, Market Rank/Share for key companies, Products and Services, and Recent Developments)
- 6.4.1 Prysmian Group USA, Inc.
- 6.4.2 Nexans AmerCable Incorporated
- 6.4.3 Southwire Company, LLC
- 6.4.4 CommScope Holding Company, Inc.
- 6.4.5 Belden Inc.
- 6.4.6 Corning Incorporated
- 6.4.7 TE Connectivity Corporation
- 6.4.8 Amphenol Corporation
- 6.4.9 LS Cable and System U.S.A., Inc.
- 6.4.10 Furukawa Electric Co., Ltd. (OFS Fitel, LLC)
- 6.4.11 Leoni Cable Inc.
- 6.4.12 Sumitomo Electric Wiring Systems, Inc.
- 6.4.13 Encore Wire Corporation
- 6.4.14 American Wire Group, LLC
- 6.4.15 TPC Wire and Cable Corp.
- 6.4.16 General Cable Technologies Corporation
- 6.4.17 Superior Essex Inc.
- 6.4.18 AFL Telecommunications LLC
- 6.4.19 NKT North America Inc.
- 6.4.20 KEI Industries North America, Inc.
- 6.4.21 Hengtong Cable Americas Inc.
- 6.4.22 Tratos USA Inc.
7 MARKET OPPORTUNITIES AND FUTURE OUTLOOK
- 7.1 White-space and Unmet-need Assessment

 亞太地區電線電纜市場:市場佔有率分析、產業趨勢與統計、成長預測(2026-2031)亞太地區低菸無鹵(LSZH)電纜:市場佔有率分析、產業趨勢與統計及成長預測(2026-2031 年)歐洲低菸無鹵 (LSZH) 電纜:市場佔有率分析、產業趨勢和統計數據以及成長預測 (2026-2031)越南電線電纜市場:市場佔有率分析、產業趨勢與統計及成長預測(2026-2031)中東和非洲低菸無鹵 (LSZH) 電纜:市場佔有率分析、行業趨勢和統計數據以及成長預測 (2026-2031)中東電線電纜市場:市場佔有率分析、產業趨勢與統計、成長預測(2026-2031年)非洲電線電纜市場:市場佔有率分析、產業趨勢與統計、成長預測(2026-2031 年)北美低菸無鹵(LSZH)電纜:市場佔有率分析、產業趨勢和統計數據以及成長預測(2026-2031 年)德國電線電纜市場:市場佔有率分析、產業趨勢與統計、成長預測(2026-2031)東南亞電線電纜市場:市場佔有率分析、產業趨勢與統計、成長預測(2026-2031)