


 |
市場調查報告書
商品編碼
2116598
北美汽車租賃:市場佔有率分析、產業趨勢與統計及成長預測(2026-2031 年)North America Vehicle Rental - Market Share Analysis, Industry Trends & Statistics, Growth Forecasts (2026 - 2031) |
||||||

※ 本網頁內容可能與最新版本有所差異。詳細情況請與我們聯繫。
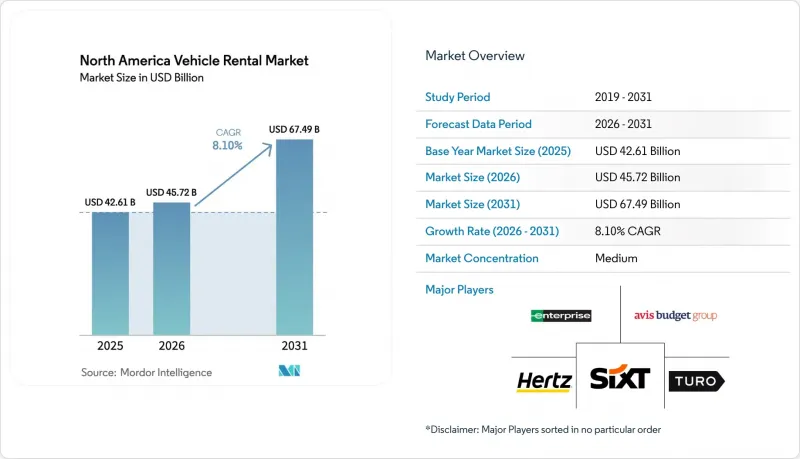
據 Mordor Intelligence 稱,2025 年北美汽車租賃市場價值 426.1 億美元,預計到 2031 年將達到 674.9 億美元,而 2026 年為 457.2 億美元,預測期(2026-2031 年)的複合年成長率為 8.10%。
本報告按車輛類型(豪華車等)、用途(休閒旅行等)、租賃期限(短期、長期)、預訂方式(線上、線下)、客戶類型(個人等)、租賃地點(機場內、機場外)、燃料類型(內燃機等)和國家/地區進行分類。市場預測以美元計價。
北美汽車租賃市場的趨勢與洞察
新冠疫情後入境休閒旅遊增加
2024年,通過美國運輸安全局(TSA)查核點的旅客人數達到9.04億,創下年度歷史新高。這一激增提振了人們對在機場租車的信心,休閒旅遊在北美租車市場維持了53.62%的佔有率。預計到2031年,該市場將以11.92%的複合年成長率成長。洛杉磯、邁阿密和奧蘭多等主要機場尤其受益於跨大西洋和拉丁美洲航線客流量的復甦,帶動了多日SUV預訂量的增加。 2024年夏季旅遊旺季期間,加拿大旅遊目的地住宿住宿量也實現了兩位數的成長。千禧世代與Z世代旅客「商務休閒」(商務與休閒結合)行程的延長,透過延長平均租賃期限,提高了租車公司的盈利。
商務旅客市場強勁復甦
到2024年第四季度,企業商務旅行量已恢復至2019年基準值的約90%。經常出差的商務旅客傾向於選擇高階轎車和會員專屬優惠,這使得營運商能夠實施動態定價並提高輔助收入。 Enterprise Holdings和Avis Budget Group報告稱,與上一季相比,2024年全年企業客戶的預訂量均有所成長。諸如CES 2025等大規模展會帶動了最後一刻預訂量的激增,這些預訂被人工智慧定價系統捕捉到,儘管車輛數量僅略有增加,但每輛可用車輛的收入卻有所提高。
汽車製造商(OEM)車輛供應受限以及購置成本高昂
2024年半導體短缺導致汽車交付放緩,迫使營運商協商延長車輛持有期和殘值保證。 2024年美國新車平均交易價格徘徊在4.8萬美元左右,資本需求增加。營運商透過用熱門SUV取代老舊轎車來降低單車折舊免稅額,但隨著汽車製造商向電氣化轉型,購置成本仍然是一項負擔。
細分市場分析
經濟型轎車在北美租車市場佔有重要地位,預計到2025年將佔45.18%的市佔率。這一主導地位主要得益於企業客戶和注重成本的休閒旅客的需求。然而,運動型多用途車(SUV)和跨界車正迅速崛起,成為成長最快的細分市場。在注重空間、舒適性和全天候可靠性的家庭和國際遊客的推動下,預計到2031年,該細分市場將以10.68%的複合年成長率成長。
儘管購置和保險成本高昂,業者仍在不斷調整車隊組成,增加運動型多用途車(SUV)的數量。由於運轉率高、平均每日租金高,因此盈利。高階和豪華車型雖然市場佔有率較小,但利潤率很高,尤其是在都市區和度假地區。此外,多功能車和小型貨車仍能滿足團體行程和商業運輸等特定需求。
休閒旅遊已成為一個重要的市場區隔領域,預計到2025年將佔53.62%的顯著市場。在入境旅遊強勁成長和長假旅遊趨勢日益成長的推動下,該細分領域預計將在2031年之前以11.92%的複合年成長率顯著成長。此外,商務休閒旅遊的興起(即商務與休閒結合的旅遊方式)進一步延長了租賃期限,並直接提高了單筆交易的收入。
同時,商務旅行仍然是穩定可靠的第二大需求支柱,支撐著工作日穩定的出行量,並提升了每次預訂的盈利能力。儘管企業差旅量低於疫情前的峰值,但企業仍能從穩定的利潤率中獲益,這得益於合約交易和基於忠誠度的重複預訂。
預計到2025年,短期租賃將佔據79.94%的市場佔有率,這對於偏好按日或按週預訂的休閒和商務旅客來說極具吸引力。這些租賃公司巧妙地運用動態定價,以掌握季節性高峰和重大活動期間的需求激增。短期租賃的優勢也體現在應對力臨時預訂需求,並提供從經濟型轎車到豪華車型的豐富選擇,使其成為滿足旅客多樣化需求的理想之選。
長期租賃和訂閱模式預計將以13.35%的複合年成長率穩定成長。這一成長主要得益於消費者態度的轉變,他們更傾向於柔軟性的租賃方式而非傳統的房屋所有權,以及零工經濟需求的不斷成長。此外,遠距辦公的日益普及也推動了對長期租賃解決方案的需求,因為個人和家庭都在尋求更靈活的生活方式。同時,營運商透過提供包含保險和維護服務的費率方案,提高了客戶留存率,並確保了收入的穩定持續,這些套餐也為消費者提供了便利和附加價值。
其他好處:
- Excel格式的市場預測(ME)表
- 3個月的分析師支持
目錄
第1章:引言
- 研究假設和市場定義
- 調查範圍
第2章:調查方法
第3章執行摘要
第4章 市場狀況
- 市場概覽
- 市場促進因素
- 新冠疫情後休閒入境旅遊增加
- 企業「出差人員」群強勁復甦
- 機場基礎設施的現代化正在促進機場內租車的使用。
- 根據美國《通膨控制法案》(IRA)和加拿大《零排放車輛》(ZEV)強制令,為以電動車為重點的車隊提供獎勵。
- 一個挖掘潛在供應來源的P2P汽車共享平台。
- 人工智慧驅動的動態定價正在提高每輛可用車輛的收入(RevPAC)。
- 市場限制因素
- 整車製造商供應受限以及採購成本高昂
- 保費上漲和賠償金通膨
- 都市區交通途徑向共乘和微出行轉變
- 機場收費和環境稅正在擠壓利潤空間。
- 價值供應鏈分析
- 監理情勢
- 技術展望
- 波特五力模型
第5章 市場規模與成長預測
- 按車輛類型
- 豪華轎車
- 經濟型轎車
- SUV 與跨界車
- 多用途汽車(MPV)
- 小型商用貨車
- 按應用程式類型
- 休閒旅遊
- 商務/商業旅行
- 本地使用(在城市範圍內)
- 長途/城際
- 租賃期
- 短期(少於30天)
- 長期/訂閱(30天或以上)
- 按預訂類型
- 線上
- 離線
- 依客戶類型
- 個人
- 企業車隊合約
- 租賃地點
- 機場內部
- 機場外
- 按燃料類型
- 內燃機(ICE)
- 混合
- 電池式電動車(BEV)
- 國家
- 美國
- 加拿大
- 其他北美國家
第6章 競爭情勢
- 市場集中度
- 策略性措施與資金籌措
- 市佔率分析
- 公司簡介
- Enterprise Holdings, Inc.
- Avis Budget Group, Inc.
- Hertz Global Holdings, Inc.
- Sixt SE
- Europcar Mobility Group
- Turo Inc.
- Getaround, Inc.
- Kyte Systems Inc.
- Flexcar, Inc.
- HyreCar Inc.
- Routes Car Rental
第7章 市場機會與未來展望
According to Mordor Intelligence, the north american vehicle rental market size was valued at USD 42.61 billion in 2025 and estimated to grow from USD 45.72 billion in 2026 to reach USD 67.49 billion by 2031, at a CAGR of 8.10% during the forecast period (2026-2031).
This report is Segmented by Vehicle Type (Luxury Cars, and More), Application Type (Leisure Travel, and More), Rental Duration (Short-Term and Long-Term), Booking Type (Online and Offline), Customer Type (Individual and More), Rental Location (On-Airport and Off-Airport), Fuel Type (Internal Combustion Engine and More), and Country. Market Forecasts are in Value (USD).
North America Vehicle Rental Market Trends and Insights
Rise in Inbound Leisure Travel Post-COVID-19
Passenger throughput at Transportation Security Administration checkpoints reached 904 million in 2024, the highest annual total on record. The surge restored confidence in airport rentals and maintained leisure's 53.62% share of the North America vehicle rental market, with a projected 11.92% CAGR through 2031. Gateway airports such as Los Angeles, Miami, and Orlando benefited disproportionately from recovering trans-Atlantic and Latin American traffic, translating to higher multi-day sport utility vehicle (SUV) bookings. Canadian destinations also logged double-digit growth in overnight visitors during the 2024 summer peak. Extended "bleisure" stays among millennial and Gen Z travelers lengthened average rental durations and supported yield improvements.
Strong Rebound of Corporate Road-Warrior Segment
Corporate travel volumes reached about 90% of 2019 benchmarks by Q4 2024. High-frequency road warriors chose premium sedans and loyalty perks, enabling operators to deploy dynamic pricing and earn higher ancillary revenue. Enterprise Holdings and Avis Budget Group reported sequential gains in corporate account bookings during 2024. Large conventions such as CES 2025 drove short-notice spikes that AI-based pricing captured, lifting revenue per available car even with modest fleet growth.
OEM Vehicle Supply Constraints and High Acquisition Costs
Semiconductor shortages curbed 2024 fleet deliveries, forcing operators to extend holding periods and negotiate residual-value guarantees. Average new-vehicle transaction prices in the United States hovered near USD 48,000 in 2024, increasing capital requirements. Operators narrowed depreciation per unit by replacing aging sedans with customer-preferred sport utility vehicles, yet acquisition costs remain a drag while original equipment manufacturers retool for electrification.
Other drivers and restraints analyzed in the detailed report include:
- Airport Infrastructure Modernization Boosting On-Airport Rentals
- EV-Focused Fleet Incentives Under United States Inflation Reduction Act (IRA) and the Canadian Zero-Emission Vehicle (ZEV) Mandates
- Rising Insurance Premiums and Liability-Claims Inflation
For complete list of drivers and restraints, kindly check the Table Of Contents.
Segment Analysis
Economy vehicles hold a significant position in North America's vehicle rental market, accounting for a 45.18% share in 2025. This dominance is primarily driven by corporate contracts and the demand from cost-sensitive leisure travelers. However, sport utility vehicles and crossovers are rapidly gaining traction as the fastest-growing segment. They are projected to grow at a 10.68% CAGR through 2031, fueled by the preferences of families and inbound tourists who prioritize space, comfort, and all-weather reliability.
Operators are increasingly adjusting their fleet composition to include more sport utility vehicles, despite the higher costs associated with acquisition and insurance. These vehicles offer better utilization rates and command higher average daily rates, making them a lucrative choice. Premium and luxury vehicles, although representing a smaller share of the market, deliver higher margins, particularly in urban and resort areas. Additionally, multi-purpose vehicles and light vans continue to address the specific needs of group travel and commercial mobility niches.
Leisure travel has established itself as the leading segment in the market, holding a significant 53.62% share in 2025. This segment is anticipated to grow at an impressive 11.92% CAGR through 2031, driven by robust inbound tourism and the increasing trend of extended holiday travel. Additionally, the rise of "bleisure" travel, which combines business and leisure, is further extending rental durations and directly enhancing revenue per transaction.
On the other hand, business travel has stabilised as a reliable secondary demand pillar, contributing steady weekday volumes and generating a higher yield per rental. Although corporate travel levels remain below pre-pandemic peaks, operators benefit from margin stability supported by negotiated accounts and loyalty-driven repeat usage.
In 2025, short-term rentals commanded a significant 79.94% share of the market, underscoring their appeal to both leisure and business travelers, who favor daily and weekly bookings. These rentals adeptly leverage dynamic pricing, capitalizing on seasonal peaks and surges driven by major events. The dominance of short-term rentals is further supported by their ability to cater to last-minute bookings and provide a wide range of options, from economy cars to premium vehicles, making them a preferred choice for diverse traveler needs.
Long-term rentals, alongside subscription models, are set to expand at a robust 13.35% CAGR. This growth is fueled by a consumer shift towards valuing flexibility over traditional ownership and a rising demand from the gig economy. Additionally, the increasing adoption of remote work has amplified the demand for long-term rental solutions, as individuals and families seek adaptable living arrangements. Furthermore, operators are enhancing customer retention and securing stable, recurring revenue through bundled pricing that encompasses insurance and maintenance services, which also adds convenience and value for consumers.
Complete Report Scope:
- By Vehicle Type
- Luxury Cars
- Economy Cars
- SUVs and Crossovers
- Multi-Purpose Vehicles (MPV)
- Light Commercial Vans
- By Application Type
- Leisure Travel
- Business/Commercial Travel
- Local Usage (In-city)
- Outstation/Inter-city
- By Rental Duration
- Short-Term (Under 30 days)
- Long-Term/Subscription (30 days or more)
- By Booking Type
- Online
- Offline
- By Customer Type
- Individual
- Corporate Fleet Accounts
- By Rental Location
- On-Airport
- Off-Airport
- By Fuel Type
- Internal Combustion Engine (ICE)
- Hybrid
- Battery Electric Vehicle (BEV)
- By Country
- United States
- Canada
- Rest of North America
List of Companies Covered in this Report:
- Enterprise Holdings, Inc.
- Avis Budget Group, Inc.
- Hertz Global Holdings, Inc.
- Sixt SE
- Europcar Mobility Group
- Turo Inc.
- Getaround, Inc.
- Kyte Systems Inc.
- Flexcar, Inc.
- HyreCar Inc.
- Routes Car Rental
Additional Benefits:
- The market estimate (ME) sheet in Excel format
- 3 months of analyst support
TABLE OF CONTENTS
1 Introduction
- 1.1 Study Assumptions and Market Definition
- 1.2 Scope of the Study
2 Research Methodology
3 Executive Summary
4 Market Landscape
- 4.1 Market Overview
- 4.2 Market Drivers
- 4.2.1 Rise in Inbound Leisure Travel Post-COVID-19
- 4.2.2 Strong Rebound of Corporate Road-Warrior Segment
- 4.2.3 Airport Infrastructure Modernisation Boosting On-Airport Rentals
- 4.2.4 EV-Focused Fleet Incentives Under United States Inflation Reduction Act (IRA) and the Canadian Zero-Emission Vehicle (ZEV) Mandates
- 4.2.5 Peer-to-Peer Car-Sharing Platforms Unlocking Latent Supply
- 4.2.6 AI-Driven Dynamic Pricing Lifting Revenue per Available Car (RevPAC)
- 4.3 Market Restraints
- 4.3.1 OEM Vehicle Supply Constraints and High Acquisition Costs
- 4.3.2 Rising Insurance Premiums and Liability-Claims Inflation
- 4.3.3 Urban Modal Shift Toward Ride-Hailing and Micro-Mobility
- 4.3.4 Airport Surcharges and Environmental Levies Squeezing Margins
- 4.4 Value/Supply-Chain Analysis
- 4.5 Regulatory Landscape
- 4.6 Technological Outlook
- 4.7 Porter's Five Forces
- 4.7.1 Threat of New Entrants
- 4.7.2 Bargaining Power of Buyers/Consumers
- 4.7.3 Bargaining Power of Suppliers
- 4.7.4 Threat of Substitute Products
- 4.7.5 Intensity of Competitive Rivalry
5 Market Size and Growth Forecasts (Value (USD))
- 5.1 By Vehicle Type
- 5.1.1 Luxury Cars
- 5.1.2 Economy Cars
- 5.1.3 SUVs and Crossovers
- 5.1.4 Multi-Purpose Vehicles (MPV)
- 5.1.5 Light Commercial Vans
- 5.2 By Application Type
- 5.2.1 Leisure Travel
- 5.2.2 Business/Commercial Travel
- 5.2.3 Local Usage (In-city)
- 5.2.4 Outstation/Inter-city
- 5.3 By Rental Duration
- 5.3.1 Short-Term (Under 30 days)
- 5.3.2 Long-Term/Subscription (30 days or more)
- 5.4 By Booking Type
- 5.4.1 Online
- 5.4.2 Offline
- 5.5 By Customer Type
- 5.5.1 Individual
- 5.5.2 Corporate Fleet Accounts
- 5.6 By Rental Location
- 5.6.1 On-Airport
- 5.6.2 Off-Airport
- 5.7 By Fuel Type
- 5.7.1 Internal Combustion Engine (ICE)
- 5.7.2 Hybrid
- 5.7.3 Battery Electric Vehicle (BEV)
- 5.8 By Country
- 5.8.1 United States
- 5.8.2 Canada
- 5.8.3 Rest of North America
6 Competitive Landscape
- 6.1 Market Concentration
- 6.2 Strategic Moves and Funding
- 6.3 Market Share Analysis
- 6.4 Company Profiles (Includes Global level Overview, Market level Overview, Core Segments, Financials as Available, Strategic Information, Market Rank/Share for Key Companies, Products and Services, SWOT Analysis, and Recent Developments)
- 6.4.1 Enterprise Holdings, Inc.
- 6.4.2 Avis Budget Group, Inc.
- 6.4.3 Hertz Global Holdings, Inc.
- 6.4.4 Sixt SE
- 6.4.5 Europcar Mobility Group
- 6.4.6 Turo Inc.
- 6.4.7 Getaround, Inc.
- 6.4.8 Kyte Systems Inc.
- 6.4.9 Flexcar, Inc.
- 6.4.10 HyreCar Inc.
- 6.4.11 Routes Car Rental
7 Market Opportunities and Future Outlook
- 7.1 White-space and Unmet-Need Assessment

 印度汽車租賃市場:市場佔有率分析、產業趨勢與統計及成長預測(2026-2031)汽車租賃:市場佔有率分析、產業趨勢與統計及成長預測(2026-2031)印尼汽車租賃市場:市場佔有率分析、產業趨勢與統計及成長預測(2026-2031)新加坡汽車租賃:市場佔有率分析、產業趨勢與統計及成長預測(2026-2031)法國汽車租賃市場:市場佔有率分析、產業趨勢與統計及成長預測(2026-2031)泰國汽車租賃市場:市場佔有率分析、產業趨勢與統計及成長預測(2026-2031)英國汽車租賃:市場佔有率分析、產業趨勢與統計及成長預測(2026-2031)馬來西亞汽車租賃市場:市場佔有率分析、產業趨勢與統計及成長預測(2026-2031)印度電動自行車租賃:市場佔有率分析、產業趨勢與統計及成長預測(2026-2031)東協汽車租賃市場:市場佔有率分析、產業趨勢與統計及成長預測(2026-2031)