


 |
市場調查報告書
商品編碼
2115841
印度電動自行車租賃:市場佔有率分析、產業趨勢與統計及成長預測(2026-2031)Indian E-Bike Rental - Market Share Analysis, Industry Trends & Statistics, Growth Forecasts (2026 - 2031) |
||||||

※ 本網頁內容可能與最新版本有所差異。詳細情況請與我們聯繫。
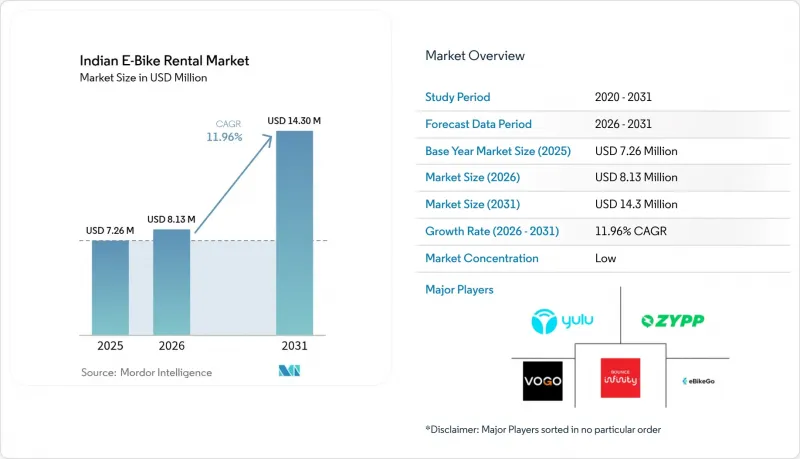
據 Mordor Intelligence 稱,印度電動自行車租賃市場預計到 2026 年價值 813 萬美元,高於 2025 年的 726 萬美元,預計到 2031 年將達到 1,430 萬美元。
預計 2026 年至 2031 年的複合年成長率為 11.96%。
本報告按應用領域(都市區和貨運/物流)、車輛類型(腳踏助力和油門助力)、最終用戶(B2C 等)、使用計劃(按小時、按天等)、電池類型(鋰離子電池、鉛酸電池及其他)和功率輸出(低於 250 瓦和 251–500 瓦)進行細分。市場預測以美元計價。
印度電動自行車租賃市場趨勢與洞察
政府激勵措施基於FAME-II和各州的電動車政策
慷慨的購車補貼、費用減免以及明確的電池更換標準,使得租賃在總擁有成本方面明顯更具優勢。電力部於2025年制定的換電站互通性指南,正在消除供應商鎖定,並簡化多品牌車輛的營運。德里的「電動車政策2.0」累計了專款,資金來源為綠色稅收和聚合商牌照費,目標是到2027年覆蓋五分之四的二輪車電動化。西孟加拉邦正透過提供豐厚的購車獎勵和完全免除車輛稅,加強其電動出行推廣工作。因此,業者現在可以將電動自行車的租賃價格設定得低於傳統摩托車。這些措施正在創造穩定的需求趨勢,並吸引車隊資金籌措合作夥伴。然而,以往補貼計畫的經驗表明,協調的基礎設施建設對於最大限度地滿足這一快速成長的需求至關重要。
創業投資和對微出行新創企業的策略資金籌措激增。
到了2025年,資本流入速度創下歷史新高,填補先前阻礙硬體規模擴張的歷史性資金缺口。 Yulu實現了EBITDA損益平衡點,同時確保了年度經常性收入,為投資者提供了一個難得的穩健單位經濟效益案例。新晉參與企業Greenerg Mobility吸引了大量投資,尤其是來自LG Balakrishnan & Bros的投資,並在哥印拜陀部署了基於訂閱的混合模式。充足的資金縮短了車輛投資回收期,涵蓋了用戶獲取成本,並加速了SaaS遠端資訊處理技術的部署。與大型物流公司的合作實現了資本的快速利用,並保障了毛利率。然而,各公司對資本消耗的接受度各不相同。隨著市場日趨成熟,那些沒有獨特競爭優勢的小規模企業仍然面臨著產業重組和為獲取人才而進行的收購(收購式收購)的風險。
公共充電和換電基礎設施密度有限
截至2024年6月,印度擁有大量公共充電站(平均每191輛電動車配備一個充電站),但其中五分之三集中在五個邦。這種集中分佈迫使營運商主要在大都會圈運營,從而延緩了其進入基礎設施不足的二線城市地區的步伐。截至2024年3月,全國範圍內僅有少量換電站投入運營,且其中許多換電站僅供特定汽車製造商使用,限制了與其他品牌的兼容性。印度公路運輸和公路部已向各邦發放了特許特許經營協議範本,但執行情況分散,導致土地徵用核准延遲。由於缺乏完善的充電網路,車隊營運商過度投資高容量電池組,從而降低了資本效率。由此導致的成本增加往往會降低消費者對電動車的提案,使其不如共享旅行和公共交通。
細分市場分析
到2025年,都市區出行將佔印度電動自行車租賃市場收入的83.12%,這再次印證了人口密集地區與短途出行範圍之間的協同效應。在大都會圈的服務區域,網路效應顯而易見,資產利用率已超過每天5-6次騎乘的損益平衡點。儘管2025年貨運和物流市場規模將遠小於電動自行車租賃市場,但預計到2031年,該市場將以12.09%的複合年成長率快速成長,這主要得益於電子商務小包裹量的成長以及各公司淨零排放藍圖圖的推進。除了從2025年6月起在德里為Zomato部署的租賃車隊外,EVIFY的1000輛Hero電動自行車也展示了基於訂單的路線經濟模式,這種模式非常適合可更換電池。
都市區的高滲透率反映了旨在懲罰內燃機車輛和實施低排放區(LEZ)法規的政策獎勵。充電樁的高密度分佈使營運商能夠利用遠端資訊處理技術全天調整車輛部署,最大限度地減少車輛閒置時間。同時,在貨運子部門,合約約束和可預測的輪班模式確保了穩定的需求,緩解了B2C租賃業務典型的周末低迷。隨著壅塞費被納入城市總體規劃,共享單車相對於計程車的成本優勢進一步擴大,鞏固了其在都市區的統治地位,即便包裹遞送車隊正逐步蠶食大型貨車的部分小包裹遞送業務。
在印度的電動自行車租賃市場,預計到2025年,油門輔助自行車將佔總消費額的60.74%。這主要得益於其平穩的加速性能和無需踩踏的便利性,尤其受到飽受宅配堵塞之苦的通勤者的青睞。雖然這類負載容量,但需要辦理駕照、註冊登記併購買第三方責任險,這增加了每輛車的合規成本。另一方面,腳踏輔助自行車正以12.12%的複合年成長率快速成長,由於其輸出功率低於250瓦的限制,無需駕照,普通用戶即可在旅遊區直接使用。
在大都會圈,業者通常將車隊的油門與踏板比例設定為70:30,但在限速的歷史街區,則採用相反的比例。馬達效率的提升使得助力車型能夠在都市區緩坡上行駛而不會過度消耗電池電量,從而縮小了性能差距。同時,像Oben Electric這樣的原始設備製造商(OEM)發布了簡化的合規性矩陣,清晰地說明了輸出頻寬閾值,旨在遏制過去導致車輛被扣押的疏忽違規行為。
其他好處:
- Excel格式的市場預測(ME)表
- 3個月的分析師支持
目錄
第1章:引言
- 研究假設和市場定義
- 調查範圍
第2章:調查方法
第3章執行摘要
第4章 市場狀況
- 市場概覽
- 市場促進因素
- 政府激勵措施是基於FAME-LI和各州的電動車政策。
- 創業投資和對微出行新創企業的策略資金籌措激增。
- 企業ESG目標正在加速最後一公里出行向電動車的轉型。
- 鋰離子電池價格的下降導致企業資本投資減少。
- 擴大與租賃車輛相關的電池更換點
- 都市區堵塞費和低排放區(LEZ)鼓勵通勤者使用電動自行車。
- 市場限制因素
- 公共充電和換電基礎設施的密度有限。
- 電池更換成本飆升,給企業的利潤率帶來了壓力。
- 關於電動自行車專用道和強制佩戴頭盔的規定存在模糊之處。
- 盜竊和故意破壞的風險增加,導致保費上漲。
- 價值供應鏈分析
- 監理情勢
- 技術展望
- 波特五力模型
第5章 市場規模與成長預測
- 按應用程式類型
- 城市
- 貨運/物流
- 車輛類型
- 腳踏輔助型
- 油門輔助類型
- 最終用戶
- 消費者(B2C)
- 最後一公里配送和宅配(B2B)
- 旅遊休閒
- 公司與組織之間的共用
- 透過訂閱模式
- 每小時
- 日常的
- 每月
- 長期租賃
- 依電池類型
- 鋰離子
- 鉛酸
- 其他
- 依輸出類型
- 250瓦或以下
- 251~500 W
第6章 競爭情勢
- 市場集中度
- 策略趨勢
- 市佔率分析
- 公司簡介
- Yulu Bikes Pvt Ltd
- Zypp Electric
- Bounce Infinity
- Vogo Rental
- eBikeGo Pvt Ltd
- Rentrip Services Pvt Ltd
- ONN Bikes
- Royal Brothers
- Drivezy
- Rapido EV
- EXA RIDE(EXA Mobility)
- Wheelbros
- Voltium
- Green Drive Mobility(Lithium Urban-Spin)
- Quick Ride
- Chartered Bike
- PedL by Zoomcar
- MYBYK e-fleet
- Mobicy EV
- VahanPay Rentals
第7章 市場機會與未來展望
According to Mordor Intelligence, the indian e-Bike rental market size in 2026 is estimated at USD 8.13 million, growing from 2025 value of USD 7.26 million with 2031 projections showing USD 14.3 million, growing at 11.96% CAGR over 2026-2031.
This report is Segmented by Application Type (Urban/City and Cargo & Logistics), Vehicle Type (Pedal-Assisted and Throttle-Assisted), End User (Consumers B2C and More), Subscription Model (Hourly, Daily, and More), Battery Type (Lithium-Ion, Lead-Acid, and Others), and Power Output (Less Than or Equal To 250 W and 251-500 W). The Market Forecasts are Provided in Terms of Value (USD).
Indian E-Bike Rental Market Trends and Insights
Government Incentives Under FAME-II & State EV Policies
Generous purchase subsidies, fee waivers, and clear battery-swap standards are tilting the total cost of ownership decisively toward rentals. The Ministry of Power's 2025 guidelines on swap-station interoperability cut vendor lock-in and simplify multi-brand fleet operations . Delhi's EV Policy 2.0 earmarks a dedicated fund, sourced from green taxes and aggregator license fees, to finance four-fifth of two-wheeler electrification by 2027. West Bengal is bolstering its electric mobility initiative by offering significant purchase incentives and complete road-tax waivers. As a result, operators can now set e-bike rental prices lower than those of traditional scooters. These initiatives are fostering consistent demand trends, drawing in fleet financing partners. Yet, lessons from previous subsidy programs underscore the importance of a coordinated infrastructure rollout to capitalize on this burgeoning demand.
Surge In VC Funding & Strategic Investments In Micromobility Start-Ups
Capital inflow reached record velocity in 2025, filling a historical funding gap that once throttled hardware scale-up. Yulu hit EBITDA breakeven while delivering annual recurring revenue, giving investors a rare proof point for positive unit economics . Greenerg Mobility, a new entrant, has garnered substantial investments, notably securing support from L.G. Balakrishnan & Bros to launch subscription-based hybrid models in Coimbatore. Ample liquidity shortens fleet payback cycles, subsidizes rider acquisition, and accelerates SaaS telematics rollouts. Partnerships with delivery giants convert capital into immediate utilization, protecting gross margins. Yet cash-burn tolerance varies; smaller operators without unique moats still face consolidation or acqui-hire prospects as the market matures.
Limited Public Charging & Swapping Infrastructure Density
India logged numerous public chargers by June 2024-roughly 1 unit for every 191 EVs-with three-fifths clustered inside five states. Such concentration compels operators to circle megacities, delaying entry into infrastructure-poor tier-2 catchments. Only a few swap stations operated nationally by March 2024, many OEM-exclusive, limiting cross-brand compatibility. The Ministry of Road Transport and Highways has issued model concession agreements for states, yet fragmented execution slows right-of-way approvals. Without dense grids, fleets over-invest in higher-capacity packs that impair capital efficiency. Resulting cost pass-through often erodes the consumer value proposition relative to ride-hailing or public transport.
Other drivers and restraints analyzed in the detailed report include:
- Corporate ESG Goals Accelerating Last-Mile E-Fleet Conversions
- Declining Lithium-Ion Battery Prices Lowering Operator Capex
- High Battery Replacement Costs Squeezing Operator Margins
For complete list of drivers and restraints, kindly check the Table Of Contents.
Segment Analysis
Urban/City trips account for a 83.12% of 2025 revenue for the Indian electric bike rental market, reaffirming the synergy between dense rider pools and short-trip range envelopes. Metropolitan catchments deliver network effects that push asset utilization above the 5-6 rides per day breakeven threshold. Although Cargo & Logistics has a far smaller 2025 base, it is accelerating at 12.09% CAGR to 2031 by piggybacking on e-commerce parcel volumes and corporates' net-zero roadmaps. Rental fleets deployed for Zomato in Delhi since June 2025, plus EVIFY's 1,000-unit Hero fleet, illustrate recipe-driven route economics that suit swappable batteries.
Urban prevalence also mirrors policy incentives and LEZ rules that penalize internal-combustion counterparts. Charge-point density allows operators to rebalance fleets throughout the day using telematics cues, minimizing deadheading. Conversely, cargo sub-verticals enjoy contractual locks and predictable shift patterns, supplying steady demand that dilutes the weekend slump typical in B2C rentals. As city master plans adopt congestion fees, rental bikes gain another cost uptick over taxis, cementing urban primacy even while parcel fleets seize incremental volume from heavyweight vans.
Throttle-assisted bikes accounts for a 60.74% of the 2025 spend within the Indian electric bike rental market share because friction-free acceleration and no-pedal convenience resonate with commuters juggling traffic bursts. They suit courier payloads yet require a license, registration, and third-party insurance, which inflates compliance costs per unit. Pedal-assisted alternatives, expanding at a 12.12% CAGR, slip under the 250 W ceiling and thus bypass licensing, letting casual users onboard instantly at tourist hotspots.
Operators stack fleets with a 70-30 throttle-pedal ratio in metros, but invert the mix in heritage districts where speed caps apply. Motor-efficiency gains now allow pedal-assist models to tackle minimal urban gradients without severe battery drain, shrinking performance gaps. Meanwhile, OEMs like Oben Electric publish simplified compliance matrices to demystify power-band thresholds, hoping to curb accidental regulatory breaches that once led to impounds.
Complete Report Scope:
- By Application Type
- Urban/City
- Cargo & Logistics
- By Vehicle Type
- Pedal-Assisted
- Throttle-Assisted
- By End User
- Consumers (B2C)
- Last-Mile Delivery & Couriers (B2B)
- Tourism & Leisure
- Corporate/Institutional Sharing
- By Subscription Model
- Hourly
- Daily
- Monthly
- Long-term Leasing
- By Battery Type
- Lithium-ion
- Lead-acid
- Others
- By Power Output
- Less than or equal to 250 W
- 251-500 W
List of Companies Covered in this Report:
- Yulu Bikes Pvt Ltd
- Zypp Electric
- Bounce Infinity
- Vogo Rental
- eBikeGo Pvt Ltd
- Rentrip Services Pvt Ltd
- ONN Bikes
- Royal Brothers
- Drivezy
- Rapido EV
- EXA RIDE (EXA Mobility)
- Wheelbros
- Voltium
- Green Drive Mobility (Lithium Urban-Spin)
- Quick Ride
- Chartered Bike
- PedL by Zoomcar
- MYBYK e-fleet
- Mobicy EV
- VahanPay Rentals
Additional Benefits:
- The market estimate (ME) sheet in Excel format
- 3 months of analyst support
TABLE OF CONTENTS
1 Introduction
- 1.1 Study Assumptions & Market Definition
- 1.2 Scope of the Study
2 Research Methodology
3 Executive Summary
4 Market Landscape
- 4.1 Market Overview
- 4.2 Market Drivers
- 4.2.1 Government Incentives Under Fame-LI & State EV Policies
- 4.2.2 Surge In VC Funding & Strategic Investments In Micromobility Start-Ups
- 4.2.3 Corporate ESG Goals Accelerating Last-Mile E-Fleet Conversions
- 4.2.4 Declining Lithium-Ion Battery Prices Lowering Operator Capex
- 4.2.5 Expansion Of Battery-Swapping Hubs Integrated With Rental Fleets
- 4.2.6 Urban Congestion Charges & LEZs Nudging Commuters To E-Bikes
- 4.3 Market Restraints
- 4.3.1 Limited Public Charging & Swapping Infrastructure Density
- 4.3.2 High Battery Replacement Costs Squeezing Operator Margins
- 4.3.3 Regulatory Ambiguity On E-Bike Lane & Helmet Compliance
- 4.3.4 Theft & Vandalism Risk Elevating Insurance Premiums
- 4.4 Value / Supply-Chain Analysis
- 4.5 Regulatory Landscape
- 4.6 Technological Outlook
- 4.7 Porter's Five Forces
- 4.7.1 Threat of New Entrants
- 4.7.2 Bargaining Power of Buyers/Consumers
- 4.7.3 Bargaining Power of Suppliers
- 4.7.4 Threat of Substitute Products
- 4.7.5 Intensity of Competitive Rivalry
5 Market Size & Growth Forecasts (Value (USD))
- 5.1 By Application Type
- 5.1.1 Urban/City
- 5.1.2 Cargo & Logistics
- 5.2 By Vehicle Type
- 5.2.1 Pedal-Assisted
- 5.2.2 Throttle-Assisted
- 5.3 By End User
- 5.3.1 Consumers (B2C)
- 5.3.2 Last-Mile Delivery & Couriers (B2B)
- 5.3.3 Tourism & Leisure
- 5.3.4 Corporate/Institutional Sharing
- 5.4 By Subscription Model
- 5.4.1 Hourly
- 5.4.2 Daily
- 5.4.3 Monthly
- 5.4.4 Long-term Leasing
- 5.5 By Battery Type
- 5.5.1 Lithium-ion
- 5.5.2 Lead-acid
- 5.5.3 Others
- 5.6 By Power Output
- 5.6.1 Less than or equal to 250 W
- 5.6.2 251-500 W
6 Competitive Landscape
- 6.1 Market Concentration
- 6.2 Strategic Moves
- 6.3 Market Share Analysis
- 6.4 Company Profiles (includes Global Level Overview, Market Level Overview, Core Segments, Financials as Available, Strategic Information, Market Rank/Share for Key Companies, Products and Services, SWOT Analysis, and Recent Developments)
- 6.4.1 Yulu Bikes Pvt Ltd
- 6.4.2 Zypp Electric
- 6.4.3 Bounce Infinity
- 6.4.4 Vogo Rental
- 6.4.5 eBikeGo Pvt Ltd
- 6.4.6 Rentrip Services Pvt Ltd
- 6.4.7 ONN Bikes
- 6.4.8 Royal Brothers
- 6.4.9 Drivezy
- 6.4.10 Rapido EV
- 6.4.11 EXA RIDE (EXA Mobility)
- 6.4.12 Wheelbros
- 6.4.13 Voltium
- 6.4.14 Green Drive Mobility (Lithium Urban-Spin)
- 6.4.15 Quick Ride
- 6.4.16 Chartered Bike
- 6.4.17 PedL by Zoomcar
- 6.4.18 MYBYK e-fleet
- 6.4.19 Mobicy EV
- 6.4.20 VahanPay Rentals
7 Market Opportunities & Future Outlook
- 7.1 White-space & Unmet-need Assessment

 印度汽車租賃市場:市場佔有率分析、產業趨勢與統計及成長預測(2026-2031)汽車租賃:市場佔有率分析、產業趨勢與統計及成長預測(2026-2031)北美汽車租賃:市場佔有率分析、產業趨勢與統計及成長預測(2026-2031 年)印尼汽車租賃市場:市場佔有率分析、產業趨勢與統計及成長預測(2026-2031)新加坡汽車租賃:市場佔有率分析、產業趨勢與統計及成長預測(2026-2031)法國汽車租賃市場:市場佔有率分析、產業趨勢與統計及成長預測(2026-2031)泰國汽車租賃市場:市場佔有率分析、產業趨勢與統計及成長預測(2026-2031)英國汽車租賃:市場佔有率分析、產業趨勢與統計及成長預測(2026-2031)馬來西亞汽車租賃市場:市場佔有率分析、產業趨勢與統計及成長預測(2026-2031)東協汽車租賃市場:市場佔有率分析、產業趨勢與統計及成長預測(2026-2031)