


 |
市場調查報告書
商品編碼
2098489
歐洲綠色IT軟體:市場佔有率分析、產業趨勢與統計及成長預測(2026-2031年)Europe Green IT Software - Market Share Analysis, Industry Trends & Statistics, Growth Forecasts (2026 - 2031) |
||||||

※ 本網頁內容可能與最新版本有所差異。詳細情況請與我們聯繫。
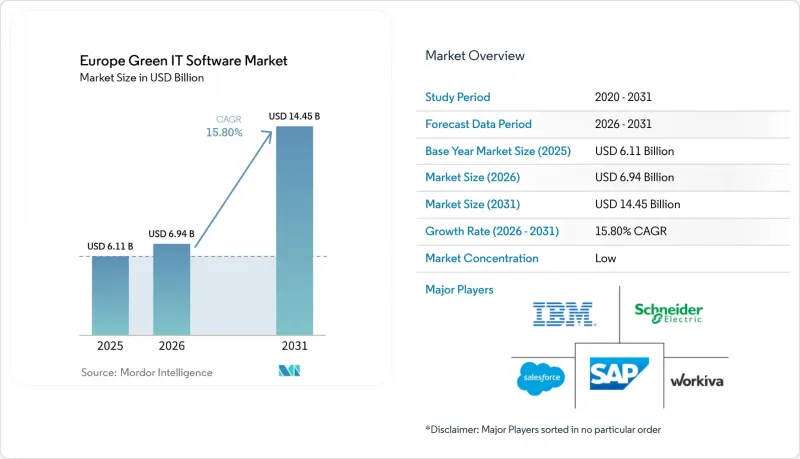
根據 Mordor Intelligence 預測,歐洲綠色 IT 軟體市場規模預計在 2025 年達到 61.1 億美元,2026 年達到 69.4 億美元,到 2031 年達到 144.5 億美元,2026 年至 2031 年的複合年成長率為 15.80%。
本報告按交付方式(軟體和服務)、部署方式(雲端、本地部署、混合部署)、組織規模(大型企業和中小企業)、最終用戶行業(IT和電信、銀行、金融服務和保險、製造業、能源和公共產業等)、解決方案類型(碳管理和計算軟體等)以及地區進行細分。市場預測以美元計價。
歐洲綠色IT軟體市場的趨勢與洞察
來自歐盟企業永續發展報告指令(CSRD)的合規壓力
企業永續發展報告指令 (CSRD) 仍然是歐洲綠色 IT 軟體市場最大的結構性促進因素。這是因為該指令將永續發展報告作為歐洲大型企業的正式且檢驗的義務。根據歐洲證券及市場管理局 (ESMA) 的數據,2025 年共審查了 367 份根據 CSRD 和非財務報告指令 (NFRD) 提交的永續發展報告,並對其中 109 家發行人採取了糾正措施。這表明監管機構在第一個報告週期內就採取了行動,而不是給予較長的寬限期。這種執法立場對軟體需求產生了重大影響,因為它促使買家尋求具有更強控制力、更完善的審計追蹤以及對企業層面揭露和底層資料來源更清晰管治的系統。雖然 2026 年的應用標準修訂減少了直接受該指令約束的公司數量,但卻將強制性支出轉移到了擁有跨國組織結構和廣泛供應商基礎的大型公司。這是因為這些公司通常需要更深入的實施和更廣泛的部署工作。此外,ESRS報告需要結構化的信息,而電子表格難以處理這些信息,因為子公司、披露項目以及整個保證流程的一致性至關重要。因此,即使閾值波動,對該平台的需求依然強勁。事實上,這個因素使得歐洲綠色IT軟體市場的合規門檻比典型的自由支配軟體預算週期更不易受到挫折的影響。
增加了符合審計要求的範圍 1、2 和 3 報告的報告工作流程。
對符合審計要求的排放工作流程的需求日益成長。這是因為大型企業需要能夠將原始營運數據轉化為可追溯、可揭露的溫室氣體報告的軟體,涵蓋範圍 1、範圍 2 和範圍 3。範圍 3 最具挑戰性,因為企業負責人通常需要來自大規模的供應商和合作夥伴網路的原始數據,而不是簡單的平均值或一次性估計值。 EcoVadis 和 Watershed 於 2026 年 3 月合作,將供應商層面的碳資訊整合到企業報告工作流程中,這標誌著供應商策略從孤立的碳計算工具轉向共用資料基礎設施。 2026 年 5 月,EcoVadis 和 Workiva 透過將碳資料網路 (Carbon Data Network) 的輸出整合到報告工作流程中,進一步擴展了此模式,使客戶能夠進行更詳細、符合稽核要求的範圍 3 計算。這些進展對歐洲綠色 IT 軟體市場意義重大,因為它們提高了買家對互通性、供應商協作和證據品質的期望,而不僅僅是透過儀表板進行報告。此外,這些努力也有助於加強服務層,因為擁有複雜業務結構的製造商、零售商和金融集團仍需要持續的支援來收集、檢驗供應商資料並將其對應到可操作的報告結構中。
報告標準因司法管轄區和框架而異
這種分散化是推廣應用的主要障礙,因為跨國買家仍然同時運行多個永續發展框架、資訊揭露要求和檢驗實踐。根據歐洲證券及市場管理局 (ESMA) 於 2026 年 4 月發布的合規清單,歐盟和歐洲經濟區 (EEA) 的 30 個國家監管機構中有 5 個宣布不符合實施指南,而德國和西班牙仍被列為計劃合規的國家。這意味著歐洲的監管標準尚未完全統一。這種不均衡的做法迫使跨國運作的公司,特別是那些內部集團跨越多個法人實體和報告管轄區的公司,必須維護平行的報告系統和管治檢查機制。英國獨特的永續發展資訊揭露標準路徑進一步加重了企業的負擔,這些企業必須在同一技術架構中協調歐盟和非歐盟的報告要求。這增加了產品開發供應商的壓力,因為他們必須隨著標準的演進不斷調整框架之間的映射、術語一致性和資訊揭露邏輯。此外,從 IT 角度來看,買家也變得更加謹慎,因為在一個報告環境中運作良好的平台在另一個環境中可能需要額外的配置、服務或手動管理。
細分市場分析
到2025年,軟體收入將佔總收入的77.52%,這表明在歐洲綠色IT軟體市場,平台訂閱模式仍將佔據主導經營模式。這反映出市場需要一個集中式系統,能夠管理跨多個營業單位和用例的報告工作流程、文件管理、資料處理歷程以及持續更新。軟體層也是供應商提高客戶留存率的關鍵所在,因為客戶依賴配置、整合、範本、儀表板和可審計的記錄,而一旦報告週期開始,這些功能就難以取代。從實際角度來看,市佔率最大的平台並非一次性揭露工具,而是能夠作為ESG報告、碳會計和永續性資料管理的營運「記錄系統」。這意味著,儘管應用範圍不斷擴大,涵蓋報告、規劃和營運監控等領域,但收入基礎仍穩固地依賴授權和訂閱模式。
預計2026年至2031年間,服務業的複合年成長率將達到18.24%,這意味著在歐洲綠色IT軟體市場中,支援層的成長速度超過了核心平台層。隨著買家從基礎報告結構轉向基於正式管治要求、實體映射、供應商入駐和控制測試的雙重重要性評估,對實施工作的需求也隨之增加。當客戶需要支援來準備保證文件、流程設計以及跨整個內部系統(這些系統並非為永續發展報告而建構)的資料收集時,服務的重要性也日益凸顯。因此,儘管綠色IT軟體市場是一個軟體主導產業,但整合商、託管資訊服務、顧問團隊和專業實施合作夥伴仍擁有龐大的發展空間。這種成長平衡表明,買家不再只是購買工具,而是需要能夠在實際的報告計劃和營運結構中執行這些工具的能力。
到2025年,雲端採用模式將佔歐洲綠色IT軟體市場收入的66.84%,並佔最大佔有率。這一佔有率反映了SaaS交付的速度和擴充性,尤其是在買家需要滿足週期性報告截止日期以及跨業務部門和實體進行協調的情況下。雲端平台也為持續更新、框架變更、供應商協作以及人工智慧驅動的工作流程改進提供了更合適的環境,供應商現在也更頻繁地將這些功能整合到他們的產品中。對於許多組織而言,這種模式縮短了初始部署時間,並減輕了在多個地點維護獨立本地環境的負擔。這些因素確保了雲端仍然是該地區大多數採用者在商業性和技術上的首選。
混合部署預計將在2026年至2031年間以19.18%的複合年成長率成長。儘管雲端仍然佔據絕對佔有率的主導地位,但它是成長最快的配置。這種成長是由那些尋求雲端的柔軟性以進行分析和工作流程編配,但仍然傾向於在本地或區域層面管理敏感的營運和報告資料的買家所推動的。因此,在政府、國防和金融服務等高度監管的環境中,本地系統仍然發揮著至關重要的作用,因為這些機構的內部政策可能仍然限制完全基於雲端處理ESG相關記錄。 ESG-X是基於以歐盟認證的德國資料中心基礎設施為中心的架構建構。這表明,資料居住和管治正在成為明確的採購標準,而不僅僅是IT方面的背景要求。這種轉變將使混合模式在歐洲綠色IT軟體產業中扮演越來越重要的角色,因為在未來的部署階段,供應商如何將規模、隱私管理和審計合規性整合到單一的營運模式中,往往決定部署的成敗。
其他好處:
- Excel格式的市場預測(ME)表
- 3個月的分析師支持
目錄
第1章:引言
- 研究假設和市場定義
- 調查範圍
第2章:調查方法
第3章執行摘要
第4章 市場狀況
- 市場概覽
- 市場促進因素
- 遵守歐盟企業永續發展報告指令的壓力
- 增加了符合審計要求的範圍 1、範圍 2 和範圍 3 的報告工作流程。
- 拓展資料中心和數位化工作場所中能源最佳化的應用場景。
- 利用人工智慧自動收集和匹配ESG數據
- 透過可衡量的軟體滿足碳減排的採購需求
- 網路安全和資料儲存需求正在推動企業級平台的發展。
- 市場限制因素
- 不同的司法管轄區和框架有不同的報告標準。
- 傳統ERP、雲端和資料堆疊環境中的高整合負擔
- 中型企業缺乏永續性分析能力
- 由於 ESG、碳排放和能源相關軟體類別重疊,導致客戶疲勞。
- 產業價值鏈分析
- 宏觀經濟因素對市場的影響
- 監理情勢
- 技術展望
- 波特五力分析
第5章 市場規模與成長預測
- 報價
- 軟體
- 服務
- 部署模式
- 雲
- 現場
- 混合
- 按組織規模
- 大公司
- SME
- 按最終用戶行業分類
- 資訊科技/通訊
- BFSI
- 製造業
- 能源公用事業
- 零售與電子商務
- 政府
- 衛生保健
- 建築和基礎設施
- 其他終端用戶產業
- 按解決方案類型
- 碳管理和運算軟體
- ESG報告和合規軟體
- 永續性資料管理平台
- 脫碳規劃軟體
- 能源和資源最佳化軟體
- 按地區
- 英國
- 德國
- 法國
- 義大利
- 西班牙
- 俄羅斯
- 北歐的
- 其他歐洲國家
第6章 競爭情勢
- 市場集中度
- 策略趨勢
- 市佔率分析
- 公司簡介
- SAP SE
- IBM Corporation
- Schneider Electric SE
- Salesforce, Inc.
- Workiva Inc.
- Persefoni AI Inc.
- Watershed Technology, Inc.
- Sweep SAS
- Plan A Earth GmbH
- Emitwise Ltd
- Cority Software Inc.
- Diligent Corporation
- Enablon, a Wolters Kluwer business
- EcoVadis SAS
- Benchmark Digital Partners LLC
- Novata, Inc.
- Measurabl, Inc.
- Greenly SAS
- Normative AB
- Intelex Technologies ULC
- Sphera Solutions, Inc.
- VelocityEHS Holdings, Inc.
- Novisto Inc.
- Sinai Technologies, Inc.
第7章 市場機會與未來展望
According to Mordor Intelligence, the Europe green IT software market size is projected to be USD 6.11 billion in 2025, USD 6.94 billion in 2026, and reach USD 14.45 billion by 2031, growing at a CAGR of 15.80% from 2026 to 2031.
This report is Segmented by Offering (Software, and Services), Deployment Mode (Cloud, On-Premises, and Hybrid), Organization Size (Large Enterprises, and SMEs), End-User Industry (IT and Telecom, BFSI, Manufacturing, Energy and Utilities, and More ), Solution Type (Carbon Management and Accounting Software, and More), and Geography. The Market Forecasts are Provided in Terms of Value (USD).
Europe Green IT Software Market Trends and Insights
EU Corporate Sustainability Reporting Directive Compliance Pressure
The CSRD remains the single largest structural catalyst for the Europe green IT software market because it turns sustainability reporting into a formal and reviewable enterprise obligation for large organizations across the region. ESMA reported 367 examinations of sustainability statements under CSRD and NFRD content review in 2025, and those reviews led to enforcement actions against 109 issuers, which showed that regulators were already acting during the first reporting cycle rather than allowing a long grace period.That enforcement posture matters for software demand because it pushes buyers toward systems with stronger controls, better audit trails, and clearer governance over entity-level disclosures and underlying source data. The 2026 threshold revision reduced the number of companies directly in scope, but it shifted mandatory spending toward larger enterprises whose multi-country structures and wider supplier bases usually require deeper deployments and broader implementation work. ESRS reporting also requires a level of structured information that is difficult to manage through spreadsheets once companies need consistency across subsidiaries, disclosure topics, and assurance processes, which keeps platform demand firm even when thresholds move. In practice, this driver gives the Europe green IT software market a compliance floor that is harder to reverse than a normal discretionary software budget cycle.
Rise In Audit-Ready Scope 1, 2, and 3 Reporting Workflows
Demand for audit-ready emissions workflows is rising because large companies need software that can move from raw operational inputs to disclosure-ready greenhouse gas reporting across Scope 1, Scope 2, and Scope 3 in a traceable format. Scope 3 has become the most difficult layer because enterprise buyers often need primary data from very large supplier and partner networks rather than simple averages or one-time estimates. EcoVadis and Watershed partnered in March 2026 to connect supplier-grade carbon information with enterprise reporting workflows, which showed how vendor strategy is moving toward shared data infrastructure rather than isolated carbon accounting tools. EcoVadis and Workiva extended that model in May 2026 by linking Carbon Data Network outputs into reporting workflows so customers could move toward more granular and audit-ready Scope 3 calculations.These moves matter for the Europe green IT software market because they raise buyer expectations around interoperability, supplier engagement, and evidence quality rather than simple dashboard reporting. They also support the services layer because complex manufacturers, retailers, and financial groups still need ongoing help to collect, validate, and map supplier data into usable reporting structures.
Fragmented Reporting Standards Across Jurisdictions and Frameworks
Fragmentation remains a real brake on adoption because multinational buyers still operate across multiple sustainability frameworks, disclosure expectations, and verification practices simultaneously. ESMA's April 2026 compliance table showed that 5 of 30 EU and EEA national competent authorities declared non-compliance with the enforcement guidelines, while Germany and Spain were still listed as intending to comply, which means the supervisory baseline is not fully uniform across Europe. That uneven posture forces cross-border companies to maintain parallel reporting configurations and governance checks, especially when internal groups span several legal entities and reporting jurisdictions. The UK's separate path around sustainability disclosure standards adds another layer for companies that must align EU reporting with non-EU requirements inside the same technology stack. This increases product development pressure for vendors because cross-framework mapping, terminology alignment, and disclosure logic must keep changing as standards evolve. IT also makes buyers more cautious because a platform that works well in one reporting environment may still require extra configuration, services, or manual controls in another.
Other drivers and restraints analyzed in the detailed report include:
- Expansion of Energy Optimization Use Cases in Data Centers and Digital Workplaces
- AI-Enabled Automation of ESG Data Collection and Reconciliation
- High Integration Burden with Legacy ERP, Cloud, and Data Stack Environments
For complete list of drivers and restraints, kindly check the Table Of Contents.
Segment Analysis
Software held 77.52% of revenue in 2025, which shows that recurring platform subscriptions remained the main commercial model in the Europe green IT software market. That position reflects the need for centralized systems that can manage reporting workflows, document controls, data lineage, and ongoing updates across several entities and use cases. The software layer is also where vendors build stickiness because customers depend on configuration, integrations, templates, dashboards, and audit-ready records that become harder to replace once reporting cycles are underway. In practical terms, the largest share stayed with platforms that could serve as the operational system of record for ESG reporting, carbon accounting, and sustainability data management rather than as one-time disclosure tools. This kept the revenue base anchored in licensing and subscriptions even as the scope of use widened across reporting, planning, and operational monitoring.
Services are projected to expand at an 18.24% CAGR between 2026 and 2031, which means the support layer is growing faster than the core platform layer inside the Europe green IT software market. Implementation work rises when buyers move from a basic reporting setup into double-materiality assessments, entity mapping, supplier onboarding, and control testing under formal governance requirements. Services also become more important when customers need support for assurance readiness, process design, and data collection across internal systems that were never built for sustainability reporting. This is why a software-led category still creates substantial room for integrators, managed data services, advisory teams, and specialist implementation partners. The balance of growth suggests that buyers are no longer only purchasing tools, but are also purchasing execution capacity that helps them make those tools usable inside real reporting calendars and operating structures.
Cloud deployment held 66.84% of revenue in 2025, which gave it the largest position in the Europe green IT software market size across deployment models. That share reflects the speed and scalability of SaaS delivery, especially when buyers must meet repeated reporting deadlines and coordinate users across business units and legal entities. Cloud platforms are also better placed for continuous updates, framework changes, supplier collaboration features, and AI-based workflow improvements that vendors now push into their products more frequently. For many organizations, this model shortened initial deployment time and reduced the burden of maintaining separate local installations across multiple sites. These factors kept Cloud as the default commercial and technical choice for much of the regional installed base.
Hybrid deployment is projected to grow at a 19.18% CAGR between 2026 and 2031, which makes it the fastest-moving setup even though cloud remained larger in absolute share. Growth is being supported by buyers who want cloud flexibility for analytics and workflow orchestration, but still prefer local or regional control over sensitive operational and reporting data. On-premises systems, therefore, remain relevant in regulated settings such as government, defense, and financial services, where internal policies can still restrict fully cloud-based handling of ESG-related records. ESG-X has positioned its architecture around EU-based and certified German data center infrastructure, which shows how data residency and governance are turning into visible buying criteria rather than background IT preferences. This shift gives hybrid models a stronger role in the Europe green IT software industry because the next phase of deployments will often depend on how well vendors can combine scale, privacy controls, and audit defensibility in one operating model.
Complete Report Scope:
- By Offering
- Software
- Services
- By Deployment Mode
- Cloud
- On-Premises
- Hybrid
- By Organization Size
- Large Enterprises
- SMEs
- By End-User Industry
- IT and Telecom
- BFSI
- Manufacturing
- Energy and Utilities
- Retail and E-Commerce
- Government
- Healthcare
- Construction and Infrastructure
- Other End-User Industries
- By Solution Type
- Carbon Management and Accounting Software
- ESG Reporting and Compliance Software
- Sustainability Data Management Platforms
- Decarbonization Planning Software
- Energy and Resource Optimization Software
- By Geography
- United Kingdom
- Germany
- France
- Italy
- Spain
- Russia
- Nordics
- Rest of Europe
List of Companies Covered in this Report:
- SAP SE
- IBM Corporation
- Schneider Electric SE
- Salesforce, Inc.
- Workiva Inc.
- Persefoni AI Inc.
- Watershed Technology, Inc.
- Sweep SAS
- Plan A Earth GmbH
- Emitwise Ltd
- Cority Software Inc.
- Diligent Corporation
- Enablon, a Wolters Kluwer business
- EcoVadis SAS
- Benchmark Digital Partners LLC
- Novata, Inc.
- Measurabl, Inc.
- Greenly SAS
- Normative AB
- Intelex Technologies ULC
- Sphera Solutions, Inc.
- VelocityEHS Holdings, Inc.
- Novisto Inc.
- Sinai Technologies, Inc.
Additional Benefits:
- The market estimate (ME) sheet in Excel format
- 3 months of analyst support
TABLE OF CONTENTS
1 INTRODUCTION
- 1.1 Study Assumptions and Market Definition
- 1.2 Scope of the Study
2 RESEARCH METHODOLOGY
3 EXECUTIVE SUMMARY
4 MARKET LANDSCAPE
- 4.1 Market Overview
- 4.2 Market Drivers
- 4.2.1 EU Corporate Sustainability Reporting Directive Compliance Pressure
- 4.2.2 Rise in Audit-Ready Scope 1, Scope 2, and Scope 3 Reporting Workflows
- 4.2.3 Expansion of Energy Optimization Use Cases in Data Centers and Digital Workplaces
- 4.2.4 AI-Enabled Automation of ESG Data Collection and Reconciliation
- 4.2.5 Procurement Demand for Measurable Software Carbon Savings
- 4.2.6 Cybersecurity and Data Residency Needs Favoring Enterprise-Grade Platforms
- 4.3 Market Restraints
- 4.3.1 Fragmented Reporting Standards Across Jurisdictions and Frameworks
- 4.3.2 High Integration Burden With Legacy ERP, Cloud, and Data Stack Environments
- 4.3.3 Limited Internal Sustainability Analytics Skills in Mid-Market Firms
- 4.3.4 Buyer Fatigue From Overlapping ESG, Carbon, and Energy Software Categories
- 4.4 Industry Value Chain Analysis
- 4.5 Impact of Macroeconomic Factors on the Market
- 4.6 Regulatory Landscape
- 4.7 Technological Outlook
- 4.8 Porter's Five Forces Analysis
- 4.8.1 Threat of New Entrants
- 4.8.2 Bargaining Power of Suppliers
- 4.8.3 Bargaining Power of Buyers
- 4.8.4 Threat of Substitutes
- 4.8.5 Intensity of Competitive Rivalry
5 MARKET SIZE AND GROWTH FORECASTS (VALUE)
- 5.1 By Offering
- 5.1.1 Software
- 5.1.2 Services
- 5.2 By Deployment Mode
- 5.2.1 Cloud
- 5.2.2 On-Premises
- 5.2.3 Hybrid
- 5.3 By Organization Size
- 5.3.1 Large Enterprises
- 5.3.2 SMEs
- 5.4 By End-User Industry
- 5.4.1 IT and Telecom
- 5.4.2 BFSI
- 5.4.3 Manufacturing
- 5.4.4 Energy and Utilities
- 5.4.5 Retail and E-Commerce
- 5.4.6 Government
- 5.4.7 Healthcare
- 5.4.8 Construction and Infrastructure
- 5.4.9 Other End-User Industries
- 5.5 By Solution Type
- 5.5.1 Carbon Management and Accounting Software
- 5.5.2 ESG Reporting and Compliance Software
- 5.5.3 Sustainability Data Management Platforms
- 5.5.4 Decarbonization Planning Software
- 5.5.5 Energy and Resource Optimization Software
- 5.6 By Geography
- 5.6.1 United Kingdom
- 5.6.2 Germany
- 5.6.3 France
- 5.6.4 Italy
- 5.6.5 Spain
- 5.6.6 Russia
- 5.6.7 Nordics
- 5.6.8 Rest of Europe
6 COMPETITIVE LANDSCAPE
- 6.1 Market Concentration
- 6.2 Strategic Moves
- 6.3 Market Share Analysis
- 6.4 Company Profiles (includes Global Level Overview, Market Level Overview, Core Segments, Financials as available, Strategic Information, Market Rank/Share, Products and Services, Recent Developments)
- 6.4.1 SAP SE
- 6.4.2 IBM Corporation
- 6.4.3 Schneider Electric SE
- 6.4.4 Salesforce, Inc.
- 6.4.5 Workiva Inc.
- 6.4.6 Persefoni AI Inc.
- 6.4.7 Watershed Technology, Inc.
- 6.4.8 Sweep SAS
- 6.4.9 Plan A Earth GmbH
- 6.4.10 Emitwise Ltd
- 6.4.11 Cority Software Inc.
- 6.4.12 Diligent Corporation
- 6.4.13 Enablon, a Wolters Kluwer business
- 6.4.14 EcoVadis SAS
- 6.4.15 Benchmark Digital Partners LLC
- 6.4.16 Novata, Inc.
- 6.4.17 Measurabl, Inc.
- 6.4.18 Greenly SAS
- 6.4.19 Normative AB
- 6.4.20 Intelex Technologies ULC
- 6.4.21 Sphera Solutions, Inc.
- 6.4.22 VelocityEHS Holdings, Inc.
- 6.4.23 Novisto Inc.
- 6.4.24 Sinai Technologies, Inc.
7 MARKET OPPORTUNITIES AND FUTURE OUTLOOK
- 7.1 White-Space and Unmet-Need Assessment

 北美綠色IT軟體:市場佔有率分析、產業趨勢與統計及成長預測(2026-2031年)印度綠色IT軟體:市場佔有率分析、產業趨勢與統計及成長預測(2026-2031年)新加坡綠色IT軟體:市場佔有率分析、產業趨勢與統計及成長預測(2026-2031年)英國綠色IT軟體:市場佔有率分析、產業趨勢與統計及成長預測(2026-2031年)中國綠色IT軟體:市場佔有率分析、產業趨勢與統計及成長預測(2026-2031年)日本綠色IT軟體:市佔率分析、產業趨勢與統計及成長預測(2026-2031年)美國綠色IT軟體:市場佔有率分析、產業趨勢與統計及成長預測(2026-2031年)亞太地區綠色IT軟體:市佔率分析、產業趨勢與統計及成長預測(2026-2031年)印尼綠色IT軟體:市場佔有率分析、產業趨勢與統計及成長預測(2026-2031年)越南綠色IT軟體:市場佔有率分析、產業趨勢與統計及成長預測(2026-2031年)