


 |
市場調查報告書
商品編碼
2073274
中國綠色IT軟體:市場佔有率分析、產業趨勢與統計及成長預測(2026-2031年)China Green IT Software - Market Share Analysis, Industry Trends & Statistics, Growth Forecasts (2026 - 2031) |
||||||

※ 本網頁內容可能與最新版本有所差異。詳細情況請與我們聯繫。
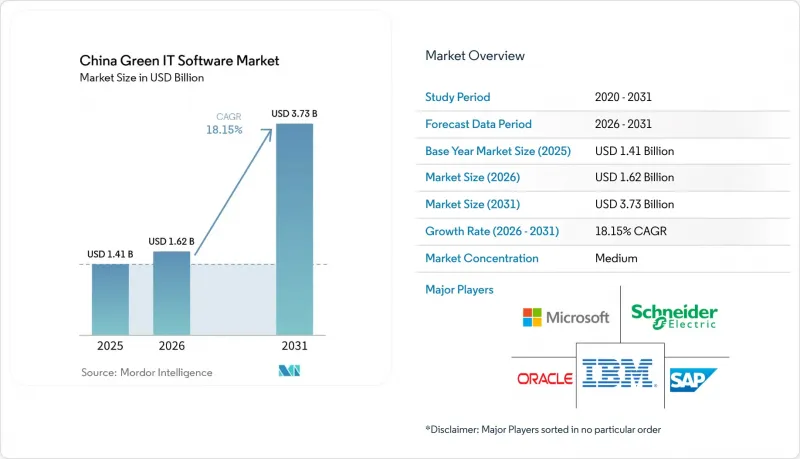
根據Mordor Intelligence預測,中國綠色IT軟體市場規模預計在2025年達到14.1億美元,2026年達到16.2億美元,到2031年達到37.3億美元,2026年至2031年的複合年成長率為18.15%。
本報告按交付方式(軟體和服務)、解決方案類型(例如,碳計量和報告軟體)、部署方式(例如,雲端部署)、組織規模(大型企業和中小企業)以及最終用戶產業(例如,資訊科技和電信業)進行分類。市場預測以美元計價。
中國綠色IT軟體市場趨勢與洞察
「雙重碳」政策的推動動能與合規數位化
中國綠色IT軟體市場正受益於一系列政策措施的直接支持,這些措施不僅設定了長期的排放目標,也明確規定了工業企業應如何建構能源和碳數據系統。 2025年3月發布的《數位能源和碳管理中心指南》為工業企業和產業園區制定了更清晰的架構標準,提高了軟體供應商在採購過程中必須滿足的最低技術標準。 2025年1月發布的《產品碳足跡計算指南》鼓勵製造商在其整個供應鏈中推廣標準化的產品級碳管理,進一步刺激了市場需求。這使得軟體的應用場景不再局限於設施報告,而是擴展到了更廣泛的領域。這個政策趨勢意義重大,因為軟體採購正從一次性的合規項目轉向持續的平台投資,尤其是在工廠、產業園區和企業集團需要通用資料結構的情況下。在中國綠色IT軟體市場,這種轉變有利於那些能夠根據企業工作流程調整系統設計,同時又能使其與國家報告邏輯相符的供應商。此外,一旦初始報告層得以實施,公司通常還需要產品資料、審計支援和供應商協作等附加模組,為長期基本客群的擴展創造空間。
企業對自動化碳計量的需求日益成長。
中國綠色IT軟體市場也受惠於碳排放追蹤方式從基於電子表格轉向自動化、可審計的報告工作流程。企業現在需要更強大的資料可追溯性、更清晰的核准流程,以及與營運記錄和揭露交付物更直接的整合,這有利於嵌入財務、ERP和雲端環境的平台。根據金蝶2025年的財務報告,其雲端訂閱收入年增20.9%至35.56億元人民幣(約4.88億美元),金蝶AI平台在包括ESG場景在內的各種應用場景中部署了近20個AI代理。這項成果具有重要的商業性意義,因為自動化ESG和碳排放報告功能正逐漸成為企業軟體支出的主流,而不再只是小眾的永續發展工具。在中國綠色IT軟體市場,這為那些能夠在企業已用於財務和營運管理的系統中實現資料收集和檢驗自動化的供應商帶來了優勢。此外,隨著碳排放工作流程與核心記錄保存和核准流程的整合,企業不願再回到手動報告或未整合的專用工具,導致過渡成本隨著時間的推移而增加。
分散式排放資料與脆弱系統之間的互通性
數據碎片化仍然是中國綠色IT軟體市場最明顯的營運限制因素之一。這是因為許多企業仍在多個互不相連的系統中管理生產、採購、設施和物流等記錄。中國工程院戰略研究院2024年發布的一項研究指出,整個產業部門缺乏可靠且統一的排放因子資料庫。這使得創建可比較且可審計的碳排放清單變得困難。這個問題不僅僅是軟體整合問題,因為不同來源系統對邊界、單位和活動類別的定義往往與監管報告要求不一致。因此,即使企業擁有軟體預算和報告義務,也可能難以創建無需人工校正即可被外部負責人核對的記錄。中國綠色IT軟體市場也面臨使用者引進週期緩慢和服務負載持續高企的問題。這是因為供應商需要花費大量時間進行資料映射,客戶才能充分認知到平台的價值。此外,一旦整合層問題解決,現有供應商就能維持其競爭優勢。這是因為一旦建立了獨特的資料結構和工作流程,切換到競爭對手的產品就變得很困難。
細分市場分析
軟體繼續主導中國綠色IT軟體市場,預計到2025年將佔67.41%的市場。這主要得益於企業對整合工具的需求,例如在ERP和雲端環境中整合碳計量和ESG資訊揭露系統。企業越來越依賴軟體來實現集中記錄、自動化計算和可重複使用的報告結構,從而減少人工干預,並提升管治和業務連續性。隨著籌資策略的演變,買家更加重視整合深度、擴充性和工作流程可追溯性,並傾向於選擇能夠提供全面企業解決方案而非獨立儀錶板的供應商。 SAP將於2026年5月發布其永續發展人工智慧代理,顯示市場關注點正在轉向自動化品質和營運相容性,也印證了儘管採購標準日益嚴格,軟體仍將繼續發揮核心作用。
預計到2031年,服務市場將以19.63%的複合年成長率成長,反映出服務在應對部署複雜性方面的策略重要性。企業,尤其是那些跨多個地點和報告框架運營的企業,需要資料準備、工作流程設計和合規管理方面的支持,以最大限度地發揮其平台的價值。這一趨勢有利於那些將強大的產品組合與高效的部署服務相結合的供應商,因為託管檢驗、諮詢支援和流程重組能夠改善客戶關係並提高合約續約率。因此,市場正從純粹的授權模式轉向軟體和服務協同運作以驅動價值和營運整合的混合模式。
碳會計仍是中國綠色IT軟體市場的基石,預計到2025年將佔據32.41%的市場。它為排放追蹤、揭露和營運分析奠定了基礎,使企業能夠在進行更廣泛的永續發展措施之前建立可靠的記錄。對持續資料收集、頻繁審查和標準化報告日益成長的需求,促使供應商將碳核算整合到其財務和營運軟體中,以簡化工作流程。雖然能源管理工具和永續發展績效解決方案也日益受到關注,但企業通常將其作為碳核算的補充層部署,這體現了一種模組化的成長模式。這種分層部署策略清楚地表明,儘管其他解決方案類別不斷擴展,碳核算仍然至關重要。
永續發展資料管理平台正迅速崛起,成為成長最快的細分市場,預計到2031年將以21.26%的複合年成長率成長。這些平台旨在滿足日益成長的需求,即整合排放、能源、水資源和社會數據,建立一個可供整個組織使用的統一框架。基礎的碳管理工具往往不足以應對全面報告和監測所需的複雜數據關係。透過將分散的記錄轉化為結構化的報告平台,資料管理平台對於尋求集中管治營運資料的企業變得至關重要。這一趨勢凸顯了這些平台在中國綠色IT軟體市場中,對於支持更廣泛的永續發展目標所扮演的關鍵角色。
其他好處:
- Excel格式的市場預測(ME)表
- 3個月的分析師支持
目錄
第1章:引言
- 研究假設和市場定義
- 調查範圍
第2章:調查方法
第3章執行摘要
第4章 市場狀況
- 市場概覽
- 市場促進因素
- “碳排放減少和碳中和政策的勢頭,以及合規性的數位化”
- 企業對自動化碳計量的需求日益成長
- 資料中心和工業IT領域的AI驅動能源最佳化
- 擴大對出口導向企業的ESG資訊揭露要求
- 面向多站點營運的雲端原生永續發展平台的發展
- 綠色IT與企業資源規劃(ERP)和業務系統的整合
- 市場限制因素
- 排放資料碎片化和系統互通性差
- 中小企業缺乏內部永續性和數據管治
- 在傳統的本地環境中部署的障礙相對較高。
- 缺乏標準化的檢驗和符合審計要求的資料工作流程
- 產業價值鏈分析
- 監理情勢
- 技術展望
- 波特五力分析
- 宏觀經濟因素對市場的影響
第5章 市場規模與成長預測
- 報價
- 軟體
- 服務
- 按解決方案類型
- 碳排放計算和報告軟體
- 能源管理和最佳化軟體
- ESG資料管理軟體
- 永續發展績效管理軟體
- 綠色資料中心管理軟體
- 部署模式
- 基於雲端的
- 現場
- 混合
- 按組織規模
- 大公司
- 小型企業
- 按最終用戶行業分類
- 資訊科技/通訊
- 製造業
- 銀行、金融服務和保險(BFSI)
- 政府/公共部門
- 能源公用事業
- 醫療保健和生命科學
- 零售與電子商務
- 建築和基礎設施
- 其他終端用戶產業
第6章 競爭情勢
- 市場集中度
- 策略趨勢
- 市佔率分析
- 公司簡介
- IBM Corporation
- Microsoft Corporation
- SAP SE
- Oracle Corporation
- Schneider Electric SE
- Siemens AG
- ABB Ltd.
- Honeywell International Inc.
- Huawei Technologies Co., Ltd.
- Alibaba Group Holding Limited
- Tencent Holdings Limited
- Baidu, Inc.
- Kingdee International Software Group Company Limited
- Yonyou Network Technology Co., Ltd.
- Inspur Group Co., Ltd.
- H3C Technologies Co., Ltd.
- Dell Technologies Inc.
- Hewlett Packard Enterprise Company
- Salesforce, Inc.
- ServiceNow, Inc.
第7章 市場機會與未來展望
According to Mordor Intelligence, the china green IT software market size is projected to be USD 1.41 billion in 2025, USD 1.62 billion in 2026, and reach USD 3.73 billion by 2031, growing at a CAGR of 18.15% from 2026 to 2031.
This report is Segmented by Offering (Software, and Services), Solution Type (Carbon Accounting and Reporting Software, and More), Deployment (Cloud-Based, and More), Organization Size (Large Enterprises, and Small and Medium Enterprises), End-User Industry (Information Technology and Telecommunications, and More). The Market Forecasts are Provided in Terms of Value (USD).
China Green IT Software Market Trends and Insights
Dual-Carbon Policy Momentum and Compliance Digitization
The China green IT software market is gaining direct support from policy measures that now specify how industrial firms should build energy and carbon data systems, rather than only stating long-term emissions goals. The March 2025 guidelines for digital energy-carbon management centers set a clearer architecture baseline for industrial enterprises and parks, which raises the minimum technical standard that software vendors must meet in procurement processes. The January 2025 product carbon footprint accounting guidelines added another layer of demand by pushing manufacturers toward standardized product-level carbon management across supply chains, which broadens the use case beyond facility reporting alone. This policy pattern matters because it shifts software buying from one-time compliance projects toward recurring platform investment, especially where factories, parks, and enterprise groups need common data structures. In the China green IT software market, this change supports vendors that can align system design with national reporting logic while still fitting enterprise workflows. It also creates room for long-term account expansion, because once the first reporting layer is installed, enterprises usually need additional modules for product data, audit support, and supplier engagement.
Rising Enterprise Demand for Automated Carbon Accounting
The China green IT software market is also benefiting from the move away from spreadsheet-based carbon tracking toward automated and auditable reporting workflows. Enterprises now need stronger data traceability, cleaner approval chains, and more direct links between operational records and disclosure outputs, which favors platforms embedded in finance, ERP, and cloud environments. Kingdee's FY2025 results showed that its cloud subscription revenue rose 20.9% year on year to RMB 3,556 million, or USD 488 million, while its Kingdee AI platform deployed nearly 20 AI agents across use cases that included ESG scenarios. That result is commercially important because it shows that automated ESG and carbon reporting functions are moving into mainstream enterprise software spending rather than remaining niche sustainability tools. In the China green IT software market, this gives an advantage to vendors that can automate data collection and validation inside systems enterprises already use for financial and operating control. It also raises switching costs over time, since once carbon workflows are linked to core records and approvals, enterprises are less willing to return to manual reporting or disconnected specialist tools.
Fragmented Emissions Data and Weak System Interoperability
Fragmented data remains one of the clearest operating limits on the China green IT software market, because many enterprises still manage production, procurement, facility, and logistics records across disconnected systems. A 2024 study published by the Strategic Study of the Chinese Academy of Engineering highlighted the lack of a credible and unified emissions factor database across industrial sectors, which makes it harder to produce comparable and auditable carbon inventories. This problem is larger than a basic software integration issue, because different source systems often define boundaries, units, and activity categories in ways that do not match regulatory reporting needs. Enterprises may therefore have the software budget and the reporting obligation, yet still struggle to generate records that external reviewers can reconcile without manual correction. In the China green IT software market, which slows implementation cycles and keeps service intensity high, because vendors often need to spend significant time on data mapping before customers see full platform value. It also protects incumbents once they solve the integration layer, since replacement becomes harder after custom data structures and workflows are in place.
Other drivers and restraints analyzed in the detailed report include:
- AI Enabled Energy Optimization Across Data Centers and Industrial IT
- Expanding ESG Disclosure Requirements Across Export-Oriented Firms
- Limited In-House Sustainability Data Governance in Small and Medium Enterprises
For complete list of drivers and restraints, kindly check the Table Of Contents.
Segment Analysis
Software continues to dominate China green IT software market, holding a 67.41% share in 2025, driven by enterprise demand for integrated tools like carbon accounting and ESG disclosure systems within ERP and cloud environments. Businesses increasingly rely on software for centralized records, automated calculations, and reusable reporting structures, reducing manual interventions and enhancing governance and continuity. As procurement strategies evolve, buyers prioritize integration depth, scalability, and workflow traceability, favoring vendors offering comprehensive enterprise solutions over standalone dashboards. SAP's May 2026 launch of sustainability AI agents highlights the market's shift toward automation quality and operational compatibility, reinforcing software's central role despite more stringent buying criteria.
Services are projected to grow at an 19.63% CAGR through 2031, reflecting their strategic importance in addressing the complexities of implementation. Enterprises require support in data preparation, workflow design, and compliance management to maximize platform value, especially when operating across multiple sites or reporting frameworks. This trend benefits vendors combining strong product offerings with effective implementation services, as managed validation, advisory support, and process redesigns enhance customer relationships and renewal rates. Consequently, the market is transitioning from a pure license model to a blended structure where software and services collectively drive value and operational integration.
Carbon accounting remains the backbone of China green IT software market, holding a 32.41% share in 2025. It serves as the foundational layer for emissions tracking, disclosure, and operational analysis, enabling enterprises to establish reliable records before advancing to broader sustainability initiatives. The growing need for consistent data collection, frequent reviews, and standardized reporting has driven vendors to integrate carbon accounting into finance and operations software, enhancing workflow efficiency. While energy management tools and sustainability performance solutions are gaining traction, enterprises often adopt these as complementary layers to carbon accounting, reflecting a modular growth approach. This layered adoption strategy underscores why carbon accounting remains central, even as other solution categories expand.
Sustainability data management platforms are emerging as the fastest-growing segment, with a projected CAGR of 21.26% through 2031. These platforms address the increasing demand for consolidating emissions, energy, water, and social data into a unified framework for enterprise-wide use. Basic carbon tools often fall short in managing complex data relationships required for comprehensive reporting and oversight. By transforming scattered records into a structured reporting backbone, data management platforms are becoming indispensable for enterprises seeking centralized governance of operational data. This trend highlights their critical role in supporting broader sustainability goals within China's green IT software market.
Complete Report Scope:
- By Offering
- Software
- Services
- By Solution Type
- Carbon Accounting and Reporting Software
- Energy Management and Optimization Software
- ESG Data Management Software
- Sustainability Performance Management Software
- Green Data Center Management Software
- By Deployment Mode
- Cloud-Based
- On Premises
- Hybrid
- By Organization Size
- Large Enterprises
- Small and Medium Enterprises
- By End-User Industry
- IT and Telecommunications
- Manufacturing
- Banking, Financial Services, and Insurance (BFSI)
- Government and Public Sector
- Energy and Utilities
- Healthcare and Life Sciences
- Retail and E-Commerce
- Construction and Infrastructure
- Other End-User Industries
List of Companies Covered in this Report:
- IBM Corporation
- Microsoft Corporation
- SAP SE
- Oracle Corporation
- Schneider Electric SE
- Siemens AG
- ABB Ltd.
- Honeywell International Inc.
- Huawei Technologies Co., Ltd.
- Alibaba Group Holding Limited
- Tencent Holdings Limited
- Baidu, Inc.
- Kingdee International Software Group Company Limited
- Yonyou Network Technology Co., Ltd.
- Inspur Group Co., Ltd.
- H3C Technologies Co., Ltd.
- Dell Technologies Inc.
- Hewlett Packard Enterprise Company
- Salesforce, Inc.
- ServiceNow, Inc.
Additional Benefits:
- The market estimate (ME) sheet in Excel format
- 3 months of analyst support
TABLE OF CONTENTS
1 INTRODUCTION
- 1.1 Study Assumptions and Market Definition
- 1.2 Scope of the Study
2 RESEARCH METHODOLOGY
3 EXECUTIVE SUMMARY
4 MARKET LANDSCAPE
- 4.1 Market Overview
- 4.2 Market Drivers
- 4.2.1 Dual-Carbon Policy Momentum and Compliance Digitization
- 4.2.2 Rising Enterprise Demand for Automated Carbon Accounting
- 4.2.3 AI Enabled Energy Optimization Across Data Centers and Industrial IT
- 4.2.4 Expanding ESG Disclosure Requirements Across Export Oriented Firms
- 4.2.5 Growth of Cloud Native Sustainability Platforms for Multi Site Operations
- 4.2.6 Integration of Green IT with Enterprise Resource Planning and Operations Systems
- 4.3 Market Restraints
- 4.3.1 Fragmented Emissions Data and Weak System Interoperability
- 4.3.2 Limited In House Sustainability Data Governance in Small and Medium Enterprises
- 4.3.3 High Implementation Friction for Legacy on Premises Environments
- 4.3.4 Shortage of Standardized Verification and Audit Ready Data Workflows
- 4.4 Industry Value-Chain Analysis
- 4.5 Regulatory Landscape
- 4.6 Technological Outlook
- 4.7 Porter's Five Forces Analysis
- 4.7.1 Bargaining Power of Buyers
- 4.7.2 Bargaining Power of Suppliers
- 4.7.3 Threat of New Entrants
- 4.7.4 Threat of Substitutes
- 4.7.5 Intensity of Competitive Rivalry
- 4.8 Impact of Macroeconomic Factors on the Market
5 MARKET SIZE AND GROWTH FORECASTS (VALUE)
- 5.1 By Offering
- 5.1.1 Software
- 5.1.2 Services
- 5.2 By Solution Type
- 5.2.1 Carbon Accounting and Reporting Software
- 5.2.2 Energy Management and Optimization Software
- 5.2.3 ESG Data Management Software
- 5.2.4 Sustainability Performance Management Software
- 5.2.5 Green Data Center Management Software
- 5.3 By Deployment Mode
- 5.3.1 Cloud-Based
- 5.3.2 On Premises
- 5.3.3 Hybrid
- 5.4 By Organization Size
- 5.4.1 Large Enterprises
- 5.4.2 Small and Medium Enterprises
- 5.5 By End-User Industry
- 5.5.1 IT and Telecommunications
- 5.5.2 Manufacturing
- 5.5.3 Banking, Financial Services, and Insurance (BFSI)
- 5.5.4 Government and Public Sector
- 5.5.5 Energy and Utilities
- 5.5.6 Healthcare and Life Sciences
- 5.5.7 Retail and E-Commerce
- 5.5.8 Construction and Infrastructure
- 5.5.9 Other End-User Industries
6 COMPETITIVE LANDSCAPE
- 6.1 Market Concentration
- 6.2 Strategic Moves
- 6.3 Market Share Analysis
- 6.4 Company Profiles (includes Global Level Overview, Market Level Overview, Core Segments, Financials as available, Strategic Information, Market Rank/Share, Products and Services, Recent Developments)
- 6.4.1 IBM Corporation
- 6.4.2 Microsoft Corporation
- 6.4.3 SAP SE
- 6.4.4 Oracle Corporation
- 6.4.5 Schneider Electric SE
- 6.4.6 Siemens AG
- 6.4.7 ABB Ltd.
- 6.4.8 Honeywell International Inc.
- 6.4.9 Huawei Technologies Co., Ltd.
- 6.4.10 Alibaba Group Holding Limited
- 6.4.11 Tencent Holdings Limited
- 6.4.12 Baidu, Inc.
- 6.4.13 Kingdee International Software Group Company Limited
- 6.4.14 Yonyou Network Technology Co., Ltd.
- 6.4.15 Inspur Group Co., Ltd.
- 6.4.16 H3C Technologies Co., Ltd.
- 6.4.17 Dell Technologies Inc.
- 6.4.18 Hewlett Packard Enterprise Company
- 6.4.19 Salesforce, Inc.
- 6.4.20 ServiceNow, Inc.
7 MARKET OPPORTUNITIES AND FUTURE OUTLOOK
- 7.1 White-Space and Unmet-Need Assessment
- 7.2 Adoption Barriers by Buyer Segment
- 7.3 Product Innovation Roadmap

 北美綠色IT軟體:市場佔有率分析、產業趨勢與統計及成長預測(2026-2031年)印度綠色IT軟體:市場佔有率分析、產業趨勢與統計及成長預測(2026-2031年)新加坡綠色IT軟體:市場佔有率分析、產業趨勢與統計及成長預測(2026-2031年)歐洲綠色IT軟體:市場佔有率分析、產業趨勢與統計及成長預測(2026-2031年)英國綠色IT軟體:市場佔有率分析、產業趨勢與統計及成長預測(2026-2031年)日本綠色IT軟體:市佔率分析、產業趨勢與統計及成長預測(2026-2031年)美國綠色IT軟體:市場佔有率分析、產業趨勢與統計及成長預測(2026-2031年)亞太地區綠色IT軟體:市佔率分析、產業趨勢與統計及成長預測(2026-2031年)印尼綠色IT軟體:市場佔有率分析、產業趨勢與統計及成長預測(2026-2031年)越南綠色IT軟體:市場佔有率分析、產業趨勢與統計及成長預測(2026-2031年)