


 |
市場調查報告書
商品編碼
2073615
亞太地區化肥市場:市佔率分析、產業趨勢與統計及成長預測(2026-2031年)Asia-Pacific Fertilizers - Market Share Analysis, Industry Trends & Statistics, Growth Forecasts (2026 - 2031) |
||||||

※ 本網頁內容可能與最新版本有所差異。詳細情況請與我們聯繫。
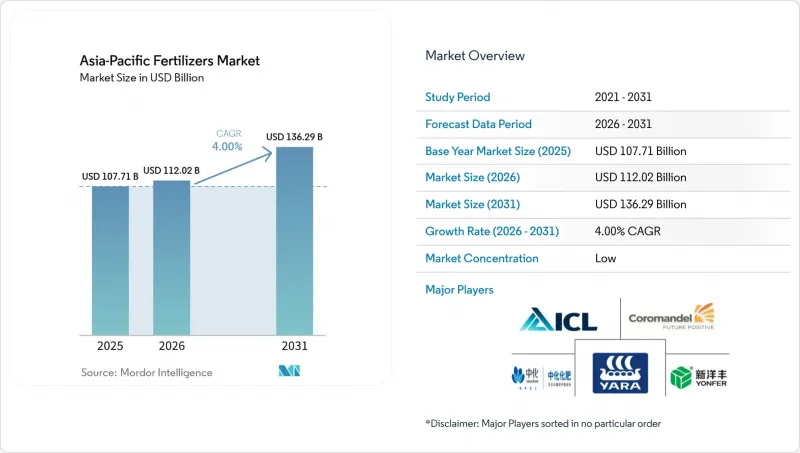
根據 Mordor Intelligence 預測,亞太地區化肥市場規模將從 2025 年的 1,077.1 億美元成長到 2026 年的 1,120.2 億美元,到 2031 年將達到 1,362.9 億美元,預測期(2026-2031 年)的複合年成長率為 4.0%。
本報告按類型(複合肥和單方肥)、形態(常規型和特種型)、施用方法(灌溉施肥、葉面噴布、土壤施用)、作物類型(田間作物、園藝作物、草坪和觀賞作物)以及地區(澳大利亞、孟加拉國、中國、印度、印度尼西亞、日本、巴基斯坦等)進行細分。市場預測以價值(美元)和數量(公噸)表示。
亞太地區化肥市場趨勢及洞察。
印度和中國補貼制度的重組正在推動需求轉向平衡施肥。
印度的「營養補貼」計畫以及中國類似的改革正在縮小尿素和複合肥之間的成本差距,促使生產商轉向生產平衡的氮磷鉀複合肥和特種微量元素肥料。這些政策趨同正在推動市場對高濃度肥料的需求成長,這類肥料既能提高土壤肥力,又能抑制氮肥的過度使用。擁有多元化產品系列的成熟生產商獲得了更強的定價權,而通用尿素供應商則面臨利潤率下降的困境。此外,由於企業必須根據不斷變化的地方政府補貼政策調整其配方註冊和分銷系統,供應鏈的複雜性也在增加。這種轉變正在強化亞太地區高階肥料市場。
政府資助的「土壤健康卡」計畫正在推動微量營養素的採用。
印度向超過2.2億人發放的「土壤健康卡」揭示了主要糧食產區普遍存在的鋅、硼和鐵缺乏問題,從而推動了針對性微量元素肥料的推廣應用。數據驅動的處方箋鼓勵種植者採用定製配方,這些配方雖然價格較高,但能顯著提高產量。生產商提供針對特定作物和地區的微量元素肥料包,並投資組成農業諮詢團隊,將分析結果轉化為精準的使用指南。孟加拉和巴基斯坦的類似舉措正在鞏固南亞作為亞太化肥市場長期成長引擎的地位。
氨和磷酸鹽等原料價格的波動給生產商的利潤率帶來了壓力。
Yara預計2025年第一季天然氣成本將增加8,500萬美元,第二季將增加2.25億美元,凸顯了其對能源價格波動的脆弱性,而能源價格波動正在擠壓其毛利率。依賴進口氨和磷礦石的亞洲小規模生產商面臨將成本轉嫁給消費者的巨大風險,並可能在價格高漲時降低開工率。價格的長期波動可能會使生產商的預算週期複雜化,並延緩高價值化肥在亞太化肥市場的推出。
細分市場分析
至2025年,單一成分肥料將佔亞太地區肥料市場佔有率的59.0%。這主要歸功於主要作物生產系統中氮、磷、鉀肥分次施用的廣泛應用。氮肥,尤其是含氮量高達46%的尿素,因其成本效益高且在中國和印度廣泛使用,持續推動市場需求。磷肥和鉀肥對於提高作物產量仍然至關重要,但人們對土壤養分缺乏問題的日益關注,正促使鋅等微量元素的使用量不斷增加。
複合肥料預計將成為成長最快的細分市場,2026年至2031年間的複合年成長率預計將達到5.4%。這一成長主要得益於市場對均衡營養配方肥料需求的不斷成長,這類肥料能夠提高養分利用效率並簡化施肥流程。政府舉措,例如印度將於2026年實施的48億美元營養補貼計畫以及中國為確保肥料供應而採取的措施,正在進一步推動複合肥在全部區域的普及應用。此外,精密農業技術的推廣應用預計也將推動整個預測期內複合肥料的需求成長。
至2025年,傳統肥料將佔銷售額的72.0%,但隨著生產商和監管機構日益重視養分利用效率,預計到2031年,特種肥料的年複合成長率將達到7.1%。水溶性肥料引領成長,主要得益於園藝區廣泛採用肥料灌溉。緩釋肥料的市佔率也不斷擴大,勞動力短缺和養分流失加劇了人們對一次性施肥的需求,同時,人們對聚合物衍生微塑膠的關注度也不斷提高。
ICL與AMP Holdings簽署的價值1.7億美元的銷售協議,凸顯了市場對其高性能水溶性肥料產品的信心,該產品專為高階果蔬設計。在亞太地區,液態肥料在高性能肥料市場領域正獲得進一步發展動力,這主要得益於溫室和人工林機械化趨勢的推動。
其他好處:
- Excel格式的市場預測(ME)表
- 3個月的分析師支持
目錄
第1章:引言
- 研究假設和市場定義
- 調查範圍
- 調查方法
第2章:本報告的內容
第3章:執行摘要和主要發現
第4章:主要產業趨勢
- 主要農作物種植面積
- 大田作物
- 園藝作物
- 平均施肥量
- 微量營養素
- 田間作物
- 園藝作物
- 主要營養素
- 田間作物
- 園藝作物
- 次要營養元素
- 田間作物
- 園藝作物
- 微量營養素
- 配備灌溉設施的農田
- 法律規範
- 價值鍊和通路分析
- 市場促進因素
- 印度和中國對補貼的合理化調整正在推動需求轉向平衡施肥方向。
- 政府資助的土壤健康卡計劃正在推廣微量元素的引入。
- 東南亞特種肥料生產能力迅速擴張
- 越南和泰國園藝作物出口增加,帶動了對水溶性產品的需求。
- 試點先導計畫:將排碳權貨幣化以鼓勵使用低排放量肥料
- 對沿海水產養殖營養物質徑流的限制正在推動對硫磺塗層產品的需求。
- 市場限制因素
- 氨和磷酸鹽原料價格的波動給生產商的利潤率帶來了壓力。
- 中國嚴格的出口配額正在阻礙區域供應的穩定。
- 南亞地區假化肥包裝袋的氾濫正在損害品牌聲譽。
- 加強聚合物塗層緩釋片中微塑膠的監測
第5章 市場規模與成長預測
- 類型
- 複雜類型
- 直的
- 微量營養素
- 硼
- 銅
- 鐵
- 錳
- 鉬
- 鋅
- 其他
- 氮基
- 硝酸銨
- 無水氨
- 尿素
- 其他
- 磷酸鹽基
- DAP
- MAP
- SSP
- TSP
- 其他
- 鉀基
- MoP
- SoP
- 其他
- 次要大量營養元素
- 鈣
- 鎂
- 硫
- 微量營養素
- 形式
- 傳統的
- 專業領域
- CRF
- 液體肥料
- SRF
- 水溶性
- 使用方法
- 施肥和灌溉
- 葉面噴布
- 土壤
- 作物類型
- 田間作物
- 園藝作物
- 草坪和觀賞植物
- 國家
- 澳洲
- 孟加拉
- 中國
- 印度
- 印尼
- 日本
- 巴基斯坦
- 菲律賓
- 泰國
- 越南
- 其他亞太國家
第6章 競爭情勢
- 關鍵策略趨勢
- 市佔率分析
- 企業狀況
- 公司簡介。
- Coromandel International Ltd.
- Grupa Azoty SA(Compo Expert)
- Haifa Group
- Hebei Sanyuanjiuqi Fertilizer Co., Ltd.
- ICL Group Ltd
- Sinofert Holdings Limited
- Sociedad Quimica y Minera de Chile SA
- Xinyangfeng Agricultural Technology Co., Ltd.
- Yara International ASA
- Zhongchuang xingyuan chemical technology co.ltd
- Koch Agronomic Services, LLC
- Nutrien Ltd.
- Shandong Hualu-Hengsheng Chemical Co., Ltd.
- Florikan ESA LLC
- Kingenta Ecological Engineering Group Co., Ltd.
第7章 化肥產業執行長面臨的關鍵策略挑戰
According to Mordor Intelligence, the asia-Pacific fertilizers market size is projected to grow from USD 107.71 billion in 2025 to USD 112.02 billion in 2026 and is forecast to reach USD 136.29 billion by 2031, registering a CAGR of 4.0% during the forecast period (2026-2031).
This report is Segmented by Type (Complex and Straight), by Form (Conventional and Specialty), by Application Mode (Fertigation, Foliar, and Soil), by Crop Type (Field Crops, Horticultural Crops, and Turf and Ornamental), and by Geography (Australia, Bangladesh, China, India, Indonesia, Japan, Pakistan, and More). The Market Forecasts are Provided in Terms of Value (USD) and Volume (Metric Tons).
Asia-Pacific Fertilizers Market Trends and Insights
Subsidy rationalization in India and China is shifting demand toward balanced fertilization
India's Nutrient-Based Subsidy framework and China's parallel reforms narrow the cost gap between urea and complex fertilizers, steering growers toward balanced NPK blends and specialty micronutrients. The converging policies underpin stronger demand for high-analysis products that improve soil fertility while moderating nitrogen overuse. Established producers with diversified portfolios gain pricing power, whereas commodity urea suppliers confront shrinking margins. Supply-chain complexity increases as companies must align formulation registration and distribution systems with evolving sub-national subsidy codes. The shift strengthens the premium tier of the Asia-Pacific fertilizers market.
Government-funded soil health card initiatives are improving micronutrient adoption
More than 220 million soil health cards distributed in India reveal zinc, boron, and iron deficiencies across key cereal belts, galvanizing targeted micronutrient fertilizer uptake. Data-driven prescriptions encourage growers to adopt custom blends that command price premiums yet deliver measurable yield gains. Manufacturers respond with crop- and region-specific micronutrient packs while investing in agronomy advisory teams that translate analytical results into precise usage guidelines. Similar initiatives in Bangladesh and Pakistan position South Asia as a long-run growth engine for the Asia-Pacific fertilizers market.
Volatile ammonia and phosphate feedstock prices are squeezing producer margins
Yara projects natural gas cost increases of USD 85 million for Q1 2025 and USD 225 million for Q2 2025, underscoring susceptibility to energy price swings that compress gross margins. Smaller Asian producers reliant on imported ammonia or phosphate rock face pronounced cost pass-through risks, occasionally curtailing operating rates during spike episodes. Extended price turbulence complicates growers' budgeting cycles and may delay the adoption of premium fertilizers within the Asia-Pacific fertilizers market.
Other drivers and restraints analyzed in the detailed report include:
- Surge in specialty fertilizer capacity expansions across Southeast Asia
- Rising horticulture exports from Vietnam and Thailand propelling water-soluble demand
- Stringent Chinese export quotas limiting regional supply security
For complete list of drivers and restraints, kindly check the Table Of Contents.
Segment Analysis
Straight fertilizers accounted for 59.0% of the Asia-Pacific fertilizers market share in 2025, driven by the prevalent use of separate nitrogen, phosphorus, and potassium applications in major crop production systems. Nitrogenous fertilizers, particularly urea with its 46% nitrogen content, continue to lead demand due to their cost-effectiveness and widespread use in China and India. Phosphatic and potassic fertilizers remain critical for enhancing crop productivity, while increasing awareness of soil nutrient deficiencies is encouraging the adoption of micronutrients such as zinc.
Complex fertilizers are anticipated to be the fastest-growing segment, with a projected CAGR of 5.4% from 2026 to 2031. This growth is attributed to rising demand for balanced nutrient formulations that enhance nutrient-use efficiency and simplify fertilizer application processes. Government initiatives, such as India's USD 4.8 billion nutrient-based subsidy scheme for 2026 and measures to ensure fertilizer availability in China, are further promoting adoption across the region. Additionally, the expansion of precision farming practices is projected to drive demand for complex fertilizers throughout the forecast period.
Conventional fertilizers accounted for 72.0% of revenue in 2025, while specialty fertilizers are projected to expand at a CAGR of 7.1% through 20231 as growers and regulators increasingly prioritize nutrient-use efficiency. Water-soluble products top the growth leaderboard, encouraged by widespread fertigation rollouts in horticulture zones. Controlled-release fertilizers gain share as labor scarcity and leaching losses push demand for single-shot applications, though scrutiny of polymer microplastics is intensifying.
ICL's USD 170 million distribution pact with AMP Holdings underscores commercial confidence in specialty water-soluble offerings for premium fruit and vegetable crops. Liquid fertilizers ride the mechanization trend, especially in greenhouse and plantation settings, adding further momentum to the specialty segment within the Asia-Pacific fertilizers market.
Complete Report Scope:
- Type
- Complex
- Straight
- Micronutrients
- Boron
- Copper
- Iron
- Manganese
- Molybdenum
- Zinc
- Others
- Nitrogenous
- Ammonium Nitrate
- Anhydrous Ammonia
- Urea
- Others
- Phosphatic
- DAP
- MAP
- SSP
- TSP
- Others
- Potassic
- MoP
- SoP
- Others
- Secondary Macronutrients
- Calcium
- Magnesium
- Sulfur
- Micronutrients
- Form
- Conventional
- Speciality
- CRF
- Liquid Fertilizer
- SRF
- Water Soluble
- Application Mode
- Fertigation
- Foliar
- Soil
- Crop Type
- Field Crops
- Horticultural Crops
- Turf & Ornamental
- Country
- Australia
- Bangladesh
- China
- India
- Indonesia
- Japan
- Pakistan
- Philippines
- Thailand
- Vietnam
- Rest of Asia-Pacific
List of Companies Covered in this Report:
- Coromandel International Ltd.
- Grupa Azoty S.A. (Compo Expert)
- Haifa Group
- Hebei Sanyuanjiuqi Fertilizer Co., Ltd.
- ICL Group Ltd
- Sinofert Holdings Limited
- Sociedad Quimica y Minera de Chile SA
- Xinyangfeng Agricultural Technology Co., Ltd.
- Yara International ASA
- Zhongchuang xingyuan chemical technology co.ltd
- Koch Agronomic Services, LLC
- Nutrien Ltd.
- Shandong Hualu-Hengsheng Chemical Co., Ltd.
- Florikan ESA LLC
- Kingenta Ecological Engineering Group Co., Ltd.
Additional Benefits:
- The market estimate (ME) sheet in Excel format
- 3 months of analyst support
TABLE OF CONTENTS
1 INTRODUCTION
- 1.1 Study Assumptions & Market Definition
- 1.2 Scope of the Study
- 1.3 Research Methodology
2 REPORT OFFERS
3 EXECUTIVE SUMMARY & KEY FINDINGS
4 KEY INDUSTRY TRENDS
- 4.1 Acreage Of Major Crop Types
- 4.1.1 Field Crops
- 4.1.2 Horticultural Crops
- 4.2 Average Nutrient Application Rates
- 4.2.1 Micronutrients
- 4.2.1.1 Field Crops
- 4.2.1.2 Horticultural Crops
- 4.2.2 Primary Nutrients
- 4.2.2.1 Field Crops
- 4.2.2.2 Horticultural Crops
- 4.2.3 Secondary Macronutrients
- 4.2.3.1 Field Crops
- 4.2.3.2 Horticultural Crops
- 4.2.1 Micronutrients
- 4.3 Agricultural Land Equipped For Irrigation
- 4.4 Regulatory Framework
- 4.5 Value Chain & Distribution Channel Analysis
- 4.6 Market Drivers
- 4.6.1 Subsidy rationalization in India and China shifting demand toward balanced fertilization
- 4.6.2 Government-funded soil health card initiatives improving micronutrient adoption
- 4.6.3 Surge in specialty fertilizer capacity expansions across Southeast Asia
- 4.6.4 Rising horticulture exports from Vietnam and Thailand propelling water-soluble demand
- 4.6.5 Carbon-credit monetization pilot projects rewarding low-emission fertilizers
- 4.6.6 Coastal aquaculture nutrient-leakage restrictions driving sulfur-coated products
- 4.7 Market Restraints
- 4.7.1 Volatile ammonia and phosphate feedstock prices squeezing producer margins
- 4.7.2 Stringent Chinese export quotas limiting regional supply security
- 4.7.3 Proliferation of counterfeit fertilizer bags in South Asia eroding brand trust
- 4.7.4 Growing micro-plastic scrutiny on polymer-coated CRFs
5 MARKET SIZE AND GROWTH FORECASTS (VALUE AND VOLUME)
- 5.1 Type
- 5.1.1 Complex
- 5.1.2 Straight
- 5.1.2.1 Micronutrients
- 5.1.2.1.1 Boron
- 5.1.2.1.2 Copper
- 5.1.2.1.3 Iron
- 5.1.2.1.4 Manganese
- 5.1.2.1.5 Molybdenum
- 5.1.2.1.6 Zinc
- 5.1.2.1.7 Others
- 5.1.2.2 Nitrogenous
- 5.1.2.2.1 Ammonium Nitrate
- 5.1.2.2.2 Anhydrous Ammonia
- 5.1.2.2.3 Urea
- 5.1.2.2.4 Others
- 5.1.2.3 Phosphatic
- 5.1.2.3.1 DAP
- 5.1.2.3.2 MAP
- 5.1.2.3.3 SSP
- 5.1.2.3.4 TSP
- 5.1.2.3.5 Others
- 5.1.2.4 Potassic
- 5.1.2.4.1 MoP
- 5.1.2.4.2 SoP
- 5.1.2.4.3 Others
- 5.1.2.5 Secondary Macronutrients
- 5.1.2.5.1 Calcium
- 5.1.2.5.2 Magnesium
- 5.1.2.5.3 Sulfur
- 5.1.2.1 Micronutrients
- 5.2 Form
- 5.2.1 Conventional
- 5.2.2 Speciality
- 5.2.2.1 CRF
- 5.2.2.2 Liquid Fertilizer
- 5.2.2.3 SRF
- 5.2.2.4 Water Soluble
- 5.3 Application Mode
- 5.3.1 Fertigation
- 5.3.2 Foliar
- 5.3.3 Soil
- 5.4 Crop Type
- 5.4.1 Field Crops
- 5.4.2 Horticultural Crops
- 5.4.3 Turf & Ornamental
- 5.5 Country
- 5.5.1 Australia
- 5.5.2 Bangladesh
- 5.5.3 China
- 5.5.4 India
- 5.5.5 Indonesia
- 5.5.6 Japan
- 5.5.7 Pakistan
- 5.5.8 Philippines
- 5.5.9 Thailand
- 5.5.10 Vietnam
- 5.5.11 Rest of Asia-Pacific
6 COMPETITIVE LANDSCAPE
- 6.1 Key Strategic Moves
- 6.2 Market Share Analysis
- 6.3 Company Landscape
- 6.4 Company Profiles (Includes Global Level Overview, Market Level Overview, Core Business Segments, Financials, Key Information, Market Rank, Market Share, Products and Services, and Analysis of Recent Developments).
- 6.4.1 Coromandel International Ltd.
- 6.4.2 Grupa Azoty S.A. (Compo Expert)
- 6.4.3 Haifa Group
- 6.4.4 Hebei Sanyuanjiuqi Fertilizer Co., Ltd.
- 6.4.5 ICL Group Ltd
- 6.4.6 Sinofert Holdings Limited
- 6.4.7 Sociedad Quimica y Minera de Chile SA
- 6.4.8 Xinyangfeng Agricultural Technology Co., Ltd.
- 6.4.9 Yara International ASA
- 6.4.10 Zhongchuang xingyuan chemical technology co.ltd
- 6.4.11 Koch Agronomic Services, LLC
- 6.4.12 Nutrien Ltd.
- 6.4.13 Shandong Hualu-Hengsheng Chemical Co., Ltd.
- 6.4.14 Florikan ESA LLC
- 6.4.15 Kingenta Ecological Engineering Group Co., Ltd.
7 KEY STRATEGIC QUESTIONS FOR FERTILIZER CEOs

 印度緩釋肥料:市場佔有率分析、行業趨勢和統計數據以及成長預測(2026-2031 年)亞太地區緩釋肥料:市場佔有率分析、產業趨勢與統計及成長預測(2026-2031)飼料肥料:市場佔有率分析、行業趨勢和統計數據、成長預測(2026-2031年)中國化肥市場:市佔率分析、產業趨勢與統計、成長預測(2026-2031年)中東和非洲化肥市場:市場佔有率分析、行業趨勢和統計數據以及成長預測(2026-2031 年)德國化肥市場:市場佔有率分析、產業趨勢與統計、成長預測(2026-2031)化肥:市佔率分析、產業趨勢與統計、成長預測(2026-2031)南美洲化肥市場:市佔率分析、產業趨勢與統計及成長預測(2026-2031 年)
 2034年化肥市場預測-按產品類型、形態、作物種類、施用方法、技術、通路和地區分類的全球分析綠色肥料:市場佔有率分析、產業趨勢與統計、成長預測(2026-2031)