


 |
市場調查報告書
商品編碼
2063900
綠色肥料:市場佔有率分析、產業趨勢與統計、成長預測(2026-2031)Green Fertilizer - Market Share Analysis, Industry Trends & Statistics, Growth Forecasts (2026 - 2031) |
||||||
※ 本網頁內容可能與最新版本有所差異。詳細情況請與我們聯繫。
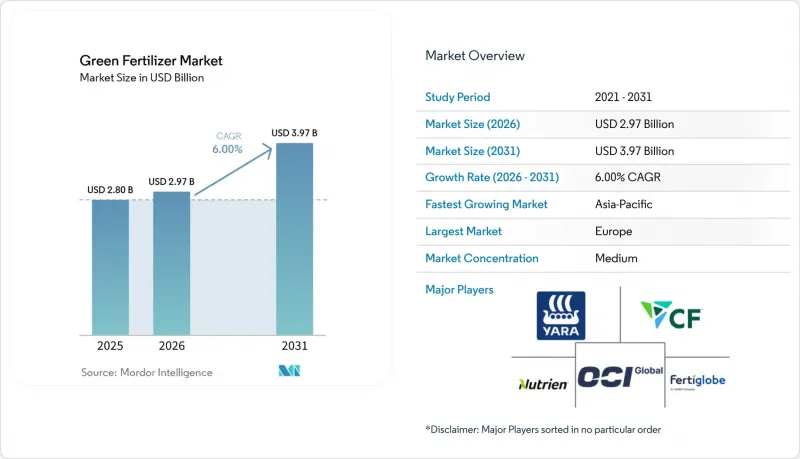
根據 Mordor Intelligence 預測,綠色肥料市場規模將從 2025 年的 28 億美元成長到 2026 年的 29.7 億美元,到 2031 年將達到 39.7 億美元,2026 年至 2031 年期間的複合年成長率預計為 6.0%。
本報告按肥料類型(綠色氨、綠色尿素等)、生產技術(電解氫、生質能氣化等)、形態(固體和液態)、作物類型(穀物、水果和蔬菜等)以及地區(北美、南美、歐洲、亞太、中東和非洲)進行細分。市場預測以美元計價。
全球綠色肥料市場趨勢與洞察
強制使用碳中和肥料
強制使用碳中和肥料,正透過具有法律約束力的法規結構,促進低排放量氮肥的推廣應用。根據歐盟委員會的說法,《減排努力條例》(ESR)要求歐盟成員國在2030年前將未納入排放交易體系(ETS)的產業(包括農業)的溫室氣體排放減少40%。這項條例迫使肥料生產商對其生產過程進行脫碳,並過渡到使用綠色氨和可再生能源衍生的原料,以符合監管期限並避免碳排放相關的處罰。
再生能源的成本平價
可再生能源成本的下降對提高綠色肥料的經濟可行性起著至關重要的作用,因為它能降低氫氣生產成本。根據國際能源總署(IEA)發布的《2024年全球氫能展望》,低排放氫氣與石化燃料生產之間的成本差距預計將從2024年的每公斤1.5至8美元縮小到2030年的每公斤1至3美元。成本差距的縮小主要歸功於低成本再生能源的普及和電解槽的廣泛應用。成本差距的縮小將增強綠色氨和肥料的競爭力,尤其是在中東、澳洲和智利等太陽能和風力發電資源豐富且價格低廉的地區。
電解設備資本密集度高,超過1吉瓦
高資本密集度仍然是大規模綠色肥料項目發展的主要障礙,主要原因是專案延期和資金籌措困難。根據國際能源總署(IEA)發布的《2024年全球氫能展望》,到2030年,全球電解槽計畫儲備(預計約520吉瓦)中,只有約4%能夠進入最終投資決策階段或正在建設中。這凸顯了該產業面臨的巨大投資和實施挑戰。已公佈產能到運作中項目的轉換率有限,凸顯了吉瓦級電解槽設施所需的巨額資金和財務風險,從而阻礙了綠色氫氣生產及其在綠色肥料製造等下游應用領域的擴張。
細分市場分析
到2025年,綠色氨將佔據綠色肥料市場最大佔有率,達到46.0%。這得益於其與現有氨基肥料基礎設施的兼容性,以及其在農業和新興燃料市場的雙重應用。成熟的生產方法,例如將可再生氫引入哈佛-博世工藝,也為其擴充性提供了支持。同時,由於監管部門對廢棄物衍生養分的支持及其對永續土壤管理的貢獻,生物基鉀肥市場也正在蓬勃發展。這些因素共同鞏固了氨的市場主導地位,而鉀肥則正在成為一個小眾但快速成長的細分市場。
受循環養分回收系統日益普及以及高價值作物對永續替代品需求的推動,生物基鉀肥市場預計將在2026年至2031年間以9.0%的複合年成長率高速成長。此外,鼓勵使用回收和生物基投入品的政策獎勵也進一步促進了這一成長。相較之下,氨肥憑藉其成熟的物流網路和在農業領域的廣泛應用,受益於規模經濟。這造成了市場結構兩極化:氨肥憑藉銷售優勢佔據主導地位,而生物基鉀肥則在高階和環境監管嚴格的應用領域不斷擴張。
預計到2025年,電解氫(源自可再生能源)將佔據綠色肥料市場高達54.0%的佔有率。這得益於強力的政策支持以及利用可再生能源的氫氣產生系統的擴充性。其優勢在於高度可擴展性,並且與能源和農業產業的脫碳目標相契合。此外,利用廢棄物製氫的製程也備受關注,因為它們可以利用城市和工業廢棄物,實現在地化生產,並支持循環經濟計劃。
預計從2026年到2031年,廢棄物製氫將以10.0%的複合年成長率高速成長,這主要得益於人們對資源效率和廢棄物管理解決方案日益成長的興趣。儘管電解憑藉其清晰的法規結構和穩定的投資仍佔據主導地位,但在原料豐富的地區,廢棄物製氫也在不斷發展。這一趨勢凸顯了區域差異:可再生能源豐富的地區更傾向於採用電解,而廢棄物高的地區則更多地採用其他氫氣生產技術。
區域分析
到2025年,歐洲將佔據全球綠色肥料市場32.0%的最大佔有率。這主要得益於健全的法規結構和低排放量農業材料的早期應用。碳定價機制和永續性法規正在加速向可再生能源肥料生產的轉型。德國和荷蘭等國正透過將可再生能源與氫氣和氨生產系統結合,加強區域供應鏈。儘管各國之間存在電網限制和政策差異,但持續的監管壓力將繼續鞏固歐洲在永續肥料應用方面的主導地位。
亞太地區預計將呈現最高的成長率,2026年至2031年複合年成長率將達到7.8%,主要得益於快速的工業化進程以及主導大力推動清潔能源整合的舉措。中國、印度和澳洲等國正在擴大可再生氫氣產能,以支持化肥生產。該地區擁有豐富的太陽能和風能資源,具備成本優勢,而政策主導的投資正在加速基礎建設。儘管面臨水資源短缺和電網限制等挑戰,但其龐大的規模和豐富的資源使其成為經濟成長的主要驅動力。
在北美,強而有力的政策獎勵和跨境貿易的推動,正推動低碳肥料價值鏈的發展。根據《聯邦稅法》第45V條,清潔氫氣生產可享有每公斤氫氣最高3美元的稅額扣抵,為期10年,這提高了計畫的經濟可行性,並促進了墨西哥灣沿岸沿岸和中西部地區設施的維修。加拿大正在推行藍氨出口戰略,墨西哥也考慮從美國西南部進口藍氨。同時,中東地區正在開發利用可再生能源的大規模氨生產項目,使其成為歐洲和亞洲重要的出口樞紐。
其他好處:
- Excel格式的市場預測(ME)表
- 3個月的分析師支持
目錄
第1章:引言
- 研究假設和市場定義
- 調查範圍
第2章:調查方法
第3章執行摘要
第4章 市場狀況
- 市場概覽
- 市場促進因素
- 強制使用碳中和肥料
- 可再生能源的成本平價
- 企業淨零排放農業計劃
- 氨燃料燃料庫對船用燃料需求的外溢效應
- 碳邊境調節機制
- 美國綠色氫能稅額扣抵
- 市場限制因素
- 電解槽密集度高,超過1吉瓦
- 電網擁塞限制了主要樞紐的可再生能源購電協議。
- 乾旱地區認證綠色水資源短缺
- 新配方農業檢驗數據的收集工作落後。
- 監理情勢
- 技術展望
- 波特五力模型
第5章 市場規模及成長預測(價值,2026-2031 年)
- 按肥料類型
- 綠色氨氣
- 綠色尿素
- 綠色磷酸鹽
- 生物基鉀
- 其他
- 憑藉原創技術
- 電解氫(可再生能源)
- 生質能氣化
- 廢棄物製氫
- 其他新興技術
- 按形式
- 固體的
- 液體
- 按作物類型
- 穀類和穀類食品
- 水果和蔬菜
- 油籽/豆類
- 其他
- 按地區
- 北美洲
- 美國
- 加拿大
- 墨西哥
- 其他北美國家
- 南美洲
- 巴西
- 阿根廷
- 其他南美國家
- 歐洲
- 德國
- 法國
- 英國
- 義大利
- 西班牙
- 俄羅斯
- 其他歐洲國家
- 亞太地區
- 中國
- 日本
- 印度
- 韓國
- 澳洲和紐西蘭
- 其他亞太國家
- 中東
- 沙烏地阿拉伯
- 阿拉伯聯合大公國
- 土耳其
- 其他中東國家
- 非洲
- 南非
- 埃及
- 其他非洲國家
- 北美洲
第6章 競爭情勢
- 市場集中度
- 策略趨勢
- 市佔率分析
- 公司簡介
- Yara International ASA
- CF Industries Holdings Inc.
- OCI NV
- Fertiglobe PLC
- Nutrien Ltd.
- ACME Group
- Air Products and Chemicals Inc.
- Engie SA
- Iberdrola SA
- thyssenkrupp AG
- Siemens Energy AG
- Nel ASA
- AmmPower Corp.
- Avina Clean Hydrogen Inc.
- Casale SA
第7章 市場機會與未來展望
According to Mordor Intelligence, the green fertilizer market size is projected to grow from USD 2.80 billion in 2025 to USD 2.97 billion in 2026 and is anticipated to reach USD 3.97 billion by 2031, registering a CAGR of 6.0% during the period 2026-2031.
This report is Segmented by Fertilizer Type (Green Ammonia, Green Urea, and More), by Source Technology (Electrolytic Hydrogen, Biomass Gasification, and More), by Form (Solid and Liquid), by Crop Type (Cereals and Grains, Fruits and Vegetables, and More), and by Geography (North America, South America, Europe, Asia-Pacific, Middle East, and Africa). The Market Forecasts are Provided in Terms of Value (USD).
Global Green Fertilizer Market Trends and Insights
Carbon-Neutral Fertilizer Mandates
Carbon-neutral fertilizer mandates are driving the adoption of low-emission nitrogen inputs through binding regulatory frameworks. According to the European Commission, the Effort Sharing Regulation (ESR) requires EU member states to achieve a 40% reduction in greenhouse gas emissions by 2030 in non-Emissions Trading System (ETS) sectors, including agriculture. This regulation is compelling fertilizer producers to decarbonize production processes and transition to green ammonia and renewable-based inputs to meet regulatory deadlines and avoid carbon-related penalties.
Renewable-Power Cost Parity
Reductions in renewable power costs play a crucial role in improving the economics of green fertilizers by decreasing hydrogen production expenses. According to the International Energy Agency's Global Hydrogen Review 2024, the cost gap between low-emissions hydrogen and fossil-based hydrogen is projected to shrink from USD 1.5-8/kg in 2024 to USD 1-3/kg by 2030 . This reduction is primarily attributed to the availability of low-cost renewable electricity and the scaling up of electrolyzer deployment. The narrowing cost gap enhances the competitiveness of green ammonia and fertilizers, particularly in regions with abundant and affordable solar and wind energy resources, such as the Middle East, Australia, and Chile.
High Capital Intensity of Electrolyzers Above 1 GW
High capital intensity remains a significant barrier to the development of large-scale green fertilizer projects, primarily due to delays in project realization and financing difficulties. According to the International Energy Agency's Global Hydrogen Review 2024, only approximately 4% of the global electrolyzer project pipeline estimated at around 520 GW by 2030 has reached the final investment decision stage or is under construction. This underscores the considerable investment and execution challenges faced by the industry. The limited transition from announced capacity to operational projects highlights the substantial capital demands and financial risks associated with gigawatt-scale electrolyzer facilities, thereby hindering the expansion of green hydrogen production and its downstream application in green fertilizer manufacturing.
Other drivers and restraints analyzed in the detailed report include:
- Corporate Net-Zero Farming Programs
- Ammonia Bunkering Demand Pull-Through for Maritime Fuel
- Grid Congestion Limiting Renewable Power Purchase Agreements in Key Hubs
For complete list of drivers and restraints, kindly check the Table Of Contents.
Segment Analysis
Green ammonia held the largest 46.0% of the green fertilizer market share in 2025, supported by compatibility with existing ammonia-based fertilizer infrastructure and its dual application across agriculture and emerging fuel markets. Its scalability is supported by established production methods, such as retrofitting the Haber-Bosch process with renewable hydrogen. At the same time, bio-based potash is gaining momentum due to regulatory support for waste-derived nutrients and its contribution to sustainable soil management. These factors collectively reinforce ammonia's market dominance while positioning potash as a niche but rapidly growing segment.
Bio-based potash market size is projected to grow at the fastest 9.0% CAGR from 2026 to 2031, driven by increasing adoption of circular nutrient recovery systems and demand for sustainable alternatives in high-value crops. Growth is further supported by policy incentives promoting the use of recycled and bio-based inputs. In contrast, ammonia benefits from scale advantages due to established logistics and widespread agronomic acceptance. This creates a dual-track market structure, with ammonia dominating in volume while bio-based potash expands in premium and environmentally regulated applications.
Electrolytic hydrogen (renewable energy) accounted for the largest 54.0% of the green fertilizer market share in 2025, supported by strong policy backing and increasing deployment of renewable-powered hydrogen production systems. Its prominence is attributed to its scalability and alignment with decarbonization goals across the energy and agriculture industries. Additionally, waste-derived hydrogen pathways are gaining traction due to their ability to utilize municipal and industrial waste streams, enabling localized production and supporting circular economy initiatives.
Waste-to-hydrogen is projected to grow at the fastest 10.0% CAGR from 2026 to 2031, driven by increasing interest in resource efficiency and waste management solutions. While electrolysis remains dominant due to well-defined regulatory frameworks and steady investment, waste-based hydrogen production is expanding in regions with abundant feedstock availability. This trend highlights a geographic distinction, with renewable-rich areas favoring electrolysis and waste-dense regions adopting alternative hydrogen production technologies.
Geography Analysis
Europe accounted for the largest 32.0% of the green fertilizer market share in 2025, driven by robust regulatory frameworks and the early adoption of low-emission agricultural inputs. Carbon pricing mechanisms and sustainability mandates are facilitating the shift toward renewable-based fertilizer production. Countries like Germany and the Netherlands are integrating renewable energy with hydrogen and ammonia production systems, thereby strengthening regional supply chains. Although grid constraints and policy differences exist across countries, consistent regulatory pressure continues to support the region's leadership in sustainable fertilizer adoption.
The Asia-Pacific region is projected to grow at the fastest CAGR of 7.8% from 2026 to 2031, driven by rapid industrialization and strong government initiatives promoting clean energy integration. Countries such as China, India, and Australia are expanding renewable hydrogen capacity to support fertilizer production. The region benefits from abundant solar and wind resources, which provide cost advantages, while policy-driven investments are accelerating infrastructure development. Despite challenges such as water availability and grid limitations, the region remains a key growth driver due to its scale and resource availability.
North America is advancing low-carbon fertilizer value chains through robust policy incentives and cross-border trade dynamics. The clean hydrogen production tax credit under Section 45V provides up to USD 3.00 per kilogram of hydrogen for a 10-year period, enhancing project economics and facilitating retrofits across the Gulf Coast and Midwest . Canada is progressing with blue-ammonia export strategies, while Mexico is assessing imports from the United States Southwest. Simultaneously, the Middle East is developing large-scale renewable-powered ammonia projects, positioning itself as a significant export hub for Europe and Asia.
- Yara International ASA
- CF Industries Holdings Inc.
- OCI N.V.
- Fertiglobe PLC
- Nutrien Ltd.
- ACME Group
- Air Products and Chemicals Inc.
- Engie SA
- Iberdrola S.A.
- thyssenkrupp AG
- Siemens Energy AG
- Nel ASA
- AmmPower Corp.
- Avina Clean Hydrogen Inc.
- Casale SA
Additional Benefits:
- The market estimate (ME) sheet in Excel format
- 3 months of analyst support
TABLE OF CONTENTS
1 Introduction
- 1.1 Study Assumptions and Market Definition
- 1.2 Scope of the Study
2 Research Methodology
3 Executive Summary
4 Market Landscape
- 4.1 Market Overview
- 4.2 Market Drivers
- 4.2.1 Carbon-neutral fertilizer mandates
- 4.2.2 Renewable-power cost parity
- 4.2.3 Corporate net-zero farming programs
- 4.2.4 Ammonia bunkering demand pull-through for maritime fuel
- 4.2.5 Carbon border adjustment mechanisms
- 4.2.6 Green-hydrogen tax credits in the United States
- 4.3 Market Restraints
- 4.3.1 High capital intensity of electrolyzers above 1 GW
- 4.3.2 Grid congestion limiting renewable Power Purchase Agreements in key hubs
- 4.3.3 Scarcity of certified green water resources in arid zones
- 4.3.4 Slow agronomic validation data for novel formulations
- 4.4 Regulatory Landscape
- 4.5 Technological Outlook
- 4.6 Porter's Five Forces
- 4.6.1 Bargaining Power of Suppliers
- 4.6.2 Bargaining Power of Buyers
- 4.6.3 Threat of New Entrants
- 4.6.4 Threat of Substitutes
- 4.6.5 Competitive Rivalry
5 Market Size and Growth Forecasts (Value, 2026-2031)
- 5.1 By Fertilizer Type
- 5.1.1 Green Ammonia
- 5.1.2 Green Urea
- 5.1.3 Green Phosphate
- 5.1.4 Bio-based Potash
- 5.1.5 Others
- 5.2 By Source Technology
- 5.2.1 Electrolytic Hydrogen (Renewable Energy)
- 5.2.2 Biomass Gasification
- 5.2.3 Waste-to-Hydrogen
- 5.2.4 Other Emerging Technologies
- 5.3 By Form
- 5.3.1 Solid
- 5.3.2 Liquid
- 5.4 By Crop Type
- 5.4.1 Cereals and Grains
- 5.4.2 Fruits and Vegetables
- 5.4.3 Oilseeds and Pulses
- 5.4.4 Others
- 5.5 By Region
- 5.5.1 North America
- 5.5.1.1 United States
- 5.5.1.2 Canada
- 5.5.1.3 Mexico
- 5.5.1.4 Rest of North America
- 5.5.2 South America
- 5.5.2.1 Brazil
- 5.5.2.2 Argentina
- 5.5.2.3 Rest of South America
- 5.5.3 Europe
- 5.5.3.1 Germany
- 5.5.3.2 France
- 5.5.3.3 United Kingdom
- 5.5.3.4 Italy
- 5.5.3.5 Spain
- 5.5.3.6 Russia
- 5.5.3.7 Rest of Europe
- 5.5.4 Asia-Pacific
- 5.5.4.1 China
- 5.5.4.2 Japan
- 5.5.4.3 India
- 5.5.4.4 South Korea
- 5.5.4.5 Australia and New Zealand
- 5.5.4.6 Rest of Asia-Pacific
- 5.5.5 Middle East
- 5.5.5.1 Saudi Arabia
- 5.5.5.2 United Arab Emirates
- 5.5.5.3 Turkey
- 5.5.5.4 Rest of Middle East
- 5.5.6 Africa
- 5.5.6.1 South Africa
- 5.5.6.2 Egypt
- 5.5.6.3 Rest of Africa
- 5.5.1 North America
6 Competitive Landscape
- 6.1 Market Concentration
- 6.2 Strategic Moves
- 6.3 Market Share Analysis
- 6.4 Company Profiles (Includes Global-Level Overview, Market-Level Overview, Core Segments, Financials as Available, Strategic Information, Market Rank/Share for Key Companies, Products and Services, and Recent Developments)
- 6.4.1 Yara International ASA
- 6.4.2 CF Industries Holdings Inc.
- 6.4.3 OCI N.V.
- 6.4.4 Fertiglobe PLC
- 6.4.5 Nutrien Ltd.
- 6.4.6 ACME Group
- 6.4.7 Air Products and Chemicals Inc.
- 6.4.8 Engie SA
- 6.4.9 Iberdrola S.A.
- 6.4.10 thyssenkrupp AG
- 6.4.11 Siemens Energy AG
- 6.4.12 Nel ASA
- 6.4.13 AmmPower Corp.
- 6.4.14 Avina Clean Hydrogen Inc.
- 6.4.15 Casale SA
7 Market Opportunities and Future Outlook
 2034年化肥市場預測-按產品類型、形態、作物種類、施用方法、技術、通路和地區分類的全球分析緩釋肥料市場預測至2034年:按類型、應用方法、最終用戶和地區分類的全球分析生物炭肥料市場預測至2034年—全球原料、作物類型、生產技術、應用、最終用戶和區域分析
 緩釋肥料市場:2026-2032年全球市場預測(以包膜類型、作物類型、釋放週期、養分類型、施用方法、最終用途和銷售管道)
 綠色肥料市場機會、成長要素、產業趨勢分析及2026-2035年預測。
 緩釋肥料市場報告:按類型、形態、應用和地區分類(2026-2034年)
 2026年全球生物炭肥料市場報告幾丁質肥料市場:2026-2032年全球市場預測(按應用、類型、原料、配方和分銷管道分類)肥料包膜市場:2026-2032年全球市場預測(以包膜化學、釋放機制、包膜養分類型、外形規格、製造流程、最終用途及通路分類)化肥市場:2026-2032年全球市場預測(依產品類型、作物類型、包裝、施用方法、最終用戶和分銷管道分類)