

 |
市場調查報告書
商品編碼
2073600
印度緩釋肥料:市場佔有率分析、行業趨勢和統計數據以及成長預測(2026-2031 年)India Controlled Release Fertilizer - Market Share Analysis, Industry Trends & Statistics, Growth Forecasts (2026 - 2031) |
||||||

※ 本網頁內容可能與最新版本有所差異。詳細情況請與我們聯繫。
根據 Mordor Intelligence 預測,印度緩釋肥料市場規模將從 2025 年的 2.609 億美元成長到 2026 年的 2.843 億美元,到 2031 年將達到 4.466 億美元,2026 年至 2031 年的複合年成長率為 9.45%。
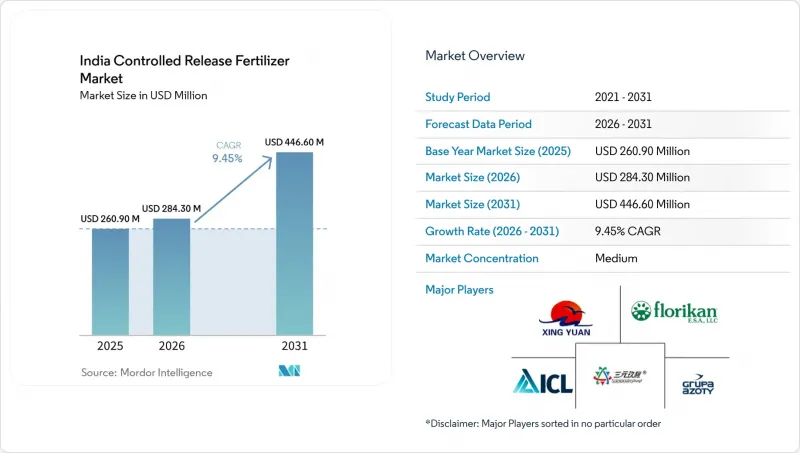
本報告按塗料類型(聚合物塗料、聚合物硫塗料及其他)和作物類型(田間作物、園藝作物和草坪/觀賞作物)進行細分。市場預測以價值(美元)和數量(公噸)表示。
印度緩釋肥料市場趨勢與洞察
政府對包膜性肥料和特殊肥料的補貼
直接補貼計畫使包膜尿素價格維持在可負擔的範圍內,其最高零售價(MRP)依法設定在較低水平,例如每45公斤袋裝2.67美元(不含稅費和包膜成本)。自2015年以來,全國所有尿素均已包膜,使農民熟悉了緩釋的概念,並為專用產品建立了物流基礎設施。除了這項聯邦舉措外,旁遮普邦和哈里亞納邦還推出了額外的邦級獎勵,鼓勵使用可生物分解的包膜,以遏制硝酸鹽滲入該地區過度抽取地下水的含水層。 2025-2026年經濟調查建議從統一補貼轉向現金轉移支付,預計在2028年實現市場競爭的平衡。北方邦和中央邦的公司正在將土壤檢測和包膜緩釋尿素捆綁銷售,將法定包膜成本轉化為客戶獲取工具。這些技術在投入和成本方面帶來的明顯好處,正在透過口碑,加速小麥和水稻產區的推廣,而此前這些地區對這些技術的採用存在強烈的抵制情緒。
高產量和養分利用效率(NUE)目標
國家永續農業使命設定了2030年養分利用效率(NUE)目標,該目標已納入各邦行動計劃,並受到日益嚴重的地下水硝酸鹽含量上升問題的關注。這項合作正在敦促地方政府推廣使用緩釋肥料,與標準顆粒尿素相比,緩釋肥料的養分回收率更高。印度農業研究理事會於2025年進行的一項田間試驗表明,用三次分肥施用聚合物包膜尿素替代聚合物包膜尿素,可使巴斯馬蒂米產量提高12-15%。由於該目標已明確列入補貼評估標準,各地區政府正積極尋求技術合作夥伴,進行村級試驗,並為包膜產品提供寶貴的田間示範數據。預計未來五年,政府的這項支持將進一步加速在大面積作物(目前仍佔農業投入的很大一部分)中推廣使用包膜性肥料。如果農民能夠根據實際的效率提升獲得獎勵,而不是按袋購買,那麼包膜肥料的推廣速度將會更快。
高初始成本與補貼後尿素的比較
緩釋肥料每公斤售價為45至75印度盧比(0.54至0.90美元),而普通尿素每公斤售價僅6印度盧比(0.07美元)。因此,包膜肥料的每英畝養分成本是普通尿素的7至12倍。對於耕地面積不足一公頃的小規模農戶而言,在低價值糧食種植中,如此高的價格難以負擔。這些農民通常依賴季節性貸款,即使包膜性肥料具有良好的長期經濟效益,他們也傾向於避免高昂的前期投入。合作銀行也持謹慎態度,因為專用農資的轉售價值較低,降低了其作為小額貸款抵押品的有效性。此外,售價每500毫升240印度盧比(2.88美元)的奈米尿素也能顯著提高氮肥利用率(NUE),這進一步抑制了市場對包膜性肥料的需求。小包裝和按需收費模式降低了前期成本,但要廣泛應用,需要建立大規模的分銷系統。因此,包膜性肥料的推廣應用呈現金字塔式結構,位於頂端的商業農戶率先採用,為後續的成功推廣奠定了基礎。然而,要實現基層農戶的廣泛應用,則需要增加補貼或採用創新的計量收費供應機制。
細分市場分析
到2025年,聚合物包衣產品將佔據印度緩效肥料市場69.6%的佔有率。在馬哈拉斯特拉邦、古吉拉突邦和卡納塔克邦等滴灌地區,此類產品的銷售最為強勁,因為這些地區可預測的養分釋放曲線與施肥和灌溉計劃相吻合。然而,隨著有關微塑膠殘留物法規的訂定,對可在180天內分解的澱粉和聚羥基烷酯酯(PHA)基包衣的研究正在加速推進。早期試驗計畫表明,儘管成本仍然較高,但其農藥性能與傳統的聚烯包衣相當。
預計2026年至2031年間,聚合物硫塗層產品將以8.2%的複合年成長率成長,成為成長最快的塗層類型。這一成長主要得益於旁遮普邦和哈里亞納邦缺硫土壤需求的不斷成長,這些產品既能補充硫元素,又能控制氮的釋放。樹脂和蠟塗層產品在特定市場仍佔有一席之地,尤其是在草坪和觀賞植物領域,這些產品能夠持續9-12個月釋放養分並減少人力成本。隨著成本差異的縮小和可接受殘留水平標準的日益明確,印度緩釋肥料市場預計將轉向可生物分解材料。擁有取得專利的生物塗層技術和可再生原料供應鏈的公司有望成為這個新興市場的先驅,從而獲得競爭優勢。
其他好處:
- Excel格式的市場預測(ME)表
- 3個月的分析師支持
目錄
第1章:引言
- 研究假設和市場定義
- 調查範圍
- 調查方法
第2章:本報告的內容
第3章:執行摘要和主要發現
第4章:主要產業趨勢
- 主要農作物種植面積
- 田間作物
- 園藝作物
- 平均施肥量
- 主要營養素
- 田間作物
- 園藝作物
- 主要營養素
- 法律規範
- 價值鍊和通路分析
- 市場促進因素
- 政府對包膜性肥料和特殊肥料的補貼
- 高產量和氮利用效率(NUE)目標
- 擴大精密農業和施肥灌溉
- 企業永續發展採購要求
- 在新的微塑膠法規架構下推廣可生物分解塗層
- 引入緩釋肥料的園藝出口叢集
- 市場限制因素
- 高昂的初始成本與補貼尿素相比
- 農民意識薄弱,經銷網路不發達
- 熱量引起的釋放速率波動
- 禁止使用不可生物分解的聚合物殘留物的可能性
第5章 市場規模與成長預測
- 按塗層類型
- 聚合物塗層
- 聚合物硫塗層
- 其他
- 按作物類型
- 大田作物
- 園藝作物
- 草坪和觀賞植物
第6章 競爭情勢
- 市場集中度
- 關鍵策略趨勢
- 市佔率分析
- 公司簡介
- ICL Group Ltd
- Compo Expert GmbH(Grupa Azoty SA)
- Florikan ESA LLC(New Mountain Capital LLC)
- Coromandel International Limited(Murugappa Group)
- Nutrien Ltd
- Yara International ASA
- Haifa Negev Technologies Ltd(Haifa Group)
- Koch Agronomic Services LLC(Koch Industries Inc.)
- Deepak Fertilisers and Petrochemicals Corporation Limited
- Sociedad Quimica y Minera de Chile SA
- Kingenta Ecological Engineering Co., Ltd.
- Chambal Fertilisers and Chemicals Limited(Adventz Group)
- Gujarat State Fertilizers & Chemicals Limited
- Hebei Sanyuanjiuqi Fertilizer Co., Ltd(Hebei Sanyuan Agricultural Group)
- Zhongchuang Xingyuan Chemical Technology Co., Ltd
第7章 化肥產業執行長面臨的關鍵策略挑戰
According to Mordor Intelligence, the india controlled release fertilizer market size is projected to increase from USD 260.90 million in 2025 to USD 284.30 million in 2026 and reach USD 446.60 million by 2031, growing at a CAGR of 9.45% over 2026-2031.
This report is Segmented by Coating Type (Polymer Coated, Polymer-Sulfur Coated, and Others) and by Crop Type (Field Crops, Horticultural Crops, and Turf and Ornamental). The Market Forecasts are Provided in Terms of Value (USD) and Volume (Metric Tons).
India Controlled Release Fertilizer Market Trends and Insights
Government Subsidies for Neem-Coated and Specialty Fertilizers
Direct Benefit Transfer keeps neem-coated urea affordable by the Maximum Retail Price (MRP) is legally set at a low level. For instance, USD 2.67 per 45 kg bag, excluding taxes and neem-coating charges. Since 2015, every domestic urea bag is neem-coated, familiarizing farmers with extended release concepts and creating a logistics backbone for specialty SKUs. The federal move is amplified by state add-on incentives in Punjab and Haryana that reward the use of biodegradable coatings to curb nitrate seepage into the region's heavily tapped aquifers. Economic Survey 2025-26 recommends converting blanket support to cash transfers, which could equalize the playing field by 2028. Firms in Uttar Pradesh and Madhya Pradesh bundle soil testing with neem-coated controlled release packs, converting a statutory coating cost into a customer acquisition lever. These visible labor and cost benefits are speeding word-of-mouth diffusion in wheat and rice belts where adoption resistance was historically high.
High Yield and Nutrient Use Efficiency (NUE) Targets
The National Mission for Sustainable Agriculture pegs a nutrient use efficiency target for 2030, a goal embedded in state action plans and backed by rising groundwater nitrate alarms. This linkage pressures local departments to promote controlled release fertilizers that boost nutrient recovery compared with standard prilled urea. Field trials by the Indian Council of Agricultural Research in 2025 showed 12-15% yield gains in basmati rice when polymer-coated urea replaced three split applications. Because the target is written into subsidy scorecards, district officials actively seek technology partners to conduct village-level trials, providing coated products with valuable on-farm validation. Over the next five years, this administrative nudge is anticipated to draw coated fertilizers more deeply into broad-acre crops, which still dominate input volumes. Adoption will accelerate once farmers are compensated for measured efficiency gains rather than per-bag purchases.
High Upfront Cost Versus Subsidized Urea
Controlled-release fertilizers are priced at INR 45-75 per kg (USD 0.54-0.90), compared to conventional urea, which costs INR 6 per kg (USD 0.07). This results in a nutrient cost per acre that is seven to twelve times higher for coated fertilizers. Smallholders cultivating less than one hectare find it difficult to justify this premium for low-value cereals. These farmers often depend on seasonal credit and avoid higher upfront costs, even if the long-term economics of coated products are favorable. Cooperative banks remain cautious, as the resale value of specialty inputs is lower, reducing their viability as collateral for microloans. Additionally, nano urea, priced at INR 240 (USD 2.88) for a 500ml bottle, offers comparable nitrogen use efficiency (NUE) improvements, further limiting the demand for coated fertilizers. While sachet packs and pay-per-use models reduce initial costs, they require intensive distribution efforts. Consequently, the adoption of coated fertilizers follows a pyramid structure, with top-tier commercial growers adopting them first and serving as proof points, while broader adoption at the base depends on either increased subsidies or innovative pay-as-you-use delivery mechanisms.
Other drivers and restraints analyzed in the detailed report include:
- Precision Agriculture and Fertigation Expansion
- Biodegradable-Coating Push Under Emerging Micro-Plastic Norms
- Low Farmer Awareness and Channel Reach
For complete list of drivers and restraints, kindly check the Table Of Contents.
Segment Analysis
Polymer-coated products accounted for 69.6% of the India controlled-release fertilizer market share in 2025. Sales are strongest in the drip-irrigated belts of Maharashtra, Gujarat, and Karnataka, where predictable nutrient-release curves align with fertigation schedules. Draft regulations on microplastic residues, however, are accelerating research into starch- and polyhydroxyalkanoate (PHA)-based coatings that decompose within 180 days. Early pilot programs indicate comparable agronomic performance, although these solutions still carry a cost premium over conventional polyolefin coatings.
Polymer sulfur-coated products are projected to be the fastest-growing coating type, expanding at a CAGR of 8.2% during 2026-2031. This growth is driven by increasing demand in sulfur-deficient soils across Punjab and Haryana, where these products provide both sulfur supplementation and controlled nitrogen release. Resin- and wax-coated products continue to serve niche markets, particularly in the turf and ornamental segments, which prioritize 9-12-month nutrient release and reduced labor requirements. The India controlled-release fertilizer market is anticipated to shift toward biodegradable materials as cost disparities narrow and standards governing acceptable residue levels become clearer. Companies with patented bio-coating technologies and renewable feedstock supply chains are likely to gain a competitive advantage as early adopters in this evolving market.
Complete Report Scope:
- By Coating Type
- Polymer Coated
- Polymer-Sulfur Coated
- Others
- By Crop Type
- Field Crops
- Horticultural Crops
- Turf and Ornamental
List of Companies Covered in this Report:
- ICL Group Ltd
- Compo Expert GmbH (Grupa Azoty S.A.)
- Florikan ESA LLC (New Mountain Capital LLC)
- Coromandel International Limited (Murugappa Group)
- Nutrien Ltd
- Yara International ASA
- Haifa Negev Technologies Ltd (Haifa Group)
- Koch Agronomic Services LLC (Koch Industries Inc.)
- Deepak Fertilisers and Petrochemicals Corporation Limited
- Sociedad Quimica y Minera de Chile S.A.
- Kingenta Ecological Engineering Co., Ltd.
- Chambal Fertilisers and Chemicals Limited (Adventz Group)
- Gujarat State Fertilizers & Chemicals Limited
- Hebei Sanyuanjiuqi Fertilizer Co., Ltd (Hebei Sanyuan Agricultural Group)
- Zhongchuang Xingyuan Chemical Technology Co., Ltd
Additional Benefits:
- The market estimate (ME) sheet in Excel format
- 3 months of analyst support
TABLE OF CONTENTS
1 INTRODUCTION
- 1.1 Study Assumptions and Market Definition
- 1.2 Scope of the Study
- 1.3 Research Methodology
2 REPORT OFFERS
3 EXECUTIVE SUMMARY AND KEY FINDINGS
4 KEY INDUSTRY TRENDS
- 4.1 Acreage of Major Crop Types
- 4.1.1 Field Crops
- 4.1.2 Horticultural Crops
- 4.2 Average Nutrient Application Rates
- 4.2.1 Primary Nutrients
- 4.2.1.1 Field Crops
- 4.2.1.2 Horticultural Crops
- 4.2.1 Primary Nutrients
- 4.3 Regulatory Framework
- 4.4 Value Chain and Distribution Channel Analysis
- 4.5 Market Drivers
- 4.5.1 Government subsidies for neem-coated and specialty fertilizers
- 4.5.2 High yield and nitrogen use efficiency (NUE) targets
- 4.5.3 Precision agriculture and fertigation expansion
- 4.5.4 Corporate sustainability sourcing mandates
- 4.5.5 Biodegradable-coating push under emerging micro-plastic norms
- 4.5.6 Horticulture export clusters adopting controlled release fertilizers
- 4.6 Market Restraints
- 4.6.1 High upfront cost versus subsidized urea
- 4.6.2 Low farmer awareness and channel reach
- 4.6.3 Heat-driven release-rate variability
- 4.6.4 Potential ban on non-degradable polymer residues
5 MARKET SIZE AND GROWTH FORECASTS (VALUE AND VOLUME)
- 5.1 By Coating Type
- 5.1.1 Polymer Coated
- 5.1.2 Polymer-Sulfur Coated
- 5.1.3 Others
- 5.2 By Crop Type
- 5.2.1 Field Crops
- 5.2.2 Horticultural Crops
- 5.2.3 Turf and Ornamental
6 COMPETITIVE LANDSCAPE
- 6.1 Market Concentration
- 6.2 Key Strategic Moves
- 6.3 Market Share Analysis
- 6.4 Company Profiles (Includes Global Level Overview, Market Level Overview, Core Segments, Financials as Available, Strategic Information, Market Rank/Share for Key Companies, Products and Services, and Recent Developments)
- 6.4.1 ICL Group Ltd
- 6.4.2 Compo Expert GmbH (Grupa Azoty S.A.)
- 6.4.3 Florikan ESA LLC (New Mountain Capital LLC)
- 6.4.4 Coromandel International Limited (Murugappa Group)
- 6.4.5 Nutrien Ltd
- 6.4.6 Yara International ASA
- 6.4.7 Haifa Negev Technologies Ltd (Haifa Group)
- 6.4.8 Koch Agronomic Services LLC (Koch Industries Inc.)
- 6.4.9 Deepak Fertilisers and Petrochemicals Corporation Limited
- 6.4.10 Sociedad Quimica y Minera de Chile S.A.
- 6.4.11 Kingenta Ecological Engineering Co., Ltd.
- 6.4.12 Chambal Fertilisers and Chemicals Limited (Adventz Group)
- 6.4.13 Gujarat State Fertilizers & Chemicals Limited
- 6.4.14 Hebei Sanyuanjiuqi Fertilizer Co., Ltd (Hebei Sanyuan Agricultural Group)
- 6.4.15 Zhongchuang Xingyuan Chemical Technology Co., Ltd
7 KEY STRATEGIC QUESTIONS FOR FERTILIZER CEOS

 亞太地區緩釋肥料:市場佔有率分析、產業趨勢與統計及成長預測(2026-2031)飼料肥料:市場佔有率分析、行業趨勢和統計數據、成長預測(2026-2031年)中國化肥市場:市佔率分析、產業趨勢與統計、成長預測(2026-2031年)中東和非洲化肥市場:市場佔有率分析、行業趨勢和統計數據以及成長預測(2026-2031 年)德國化肥市場:市場佔有率分析、產業趨勢與統計、成長預測(2026-2031)亞太地區化肥市場:市佔率分析、產業趨勢與統計及成長預測(2026-2031年)化肥:市佔率分析、產業趨勢與統計、成長預測(2026-2031)南美洲化肥市場:市佔率分析、產業趨勢與統計及成長預測(2026-2031 年)
 2034年化肥市場預測-按產品類型、形態、作物種類、施用方法、技術、通路和地區分類的全球分析綠色肥料:市場佔有率分析、產業趨勢與統計、成長預測(2026-2031)