

 |
市場調查報告書
商品編碼
2065617
亞太地區整合GPU:市場佔有率分析、產業趨勢與統計及成長預測(2026-2031年)Asia-Pacific Integrated GPU - Market Share Analysis, Industry Trends & Statistics, Growth Forecasts (2026 - 2031) |
||||||
※ 本網頁內容可能與最新版本有所差異。詳細情況請與我們聯繫。
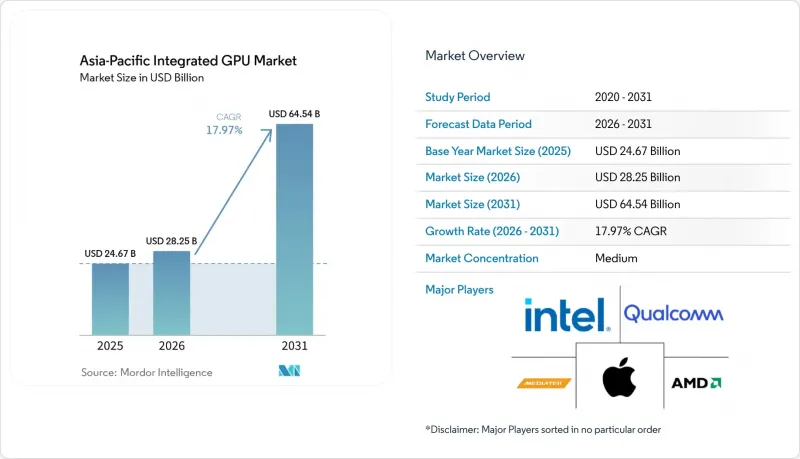
根據 Mordor Intelligence 預測,亞太地區整合 GPU 市場規模預計將從 2025 年的 246.7 億美元成長到 2026 年的 282.5 億美元,然後在 2031 年達到 645.4 億美元,2026 年至 2031 年的複合成長率為 17.97%。
本報告按設備類別(桌上型電腦和筆記型電腦處理器、行動SoC(智慧型手機和平板電腦)、嵌入式和工業SoC等)、性能等級(入門級(50美元以下)、主流級(50-150美元)、性能級(150-300美元)和高效能級(300美元以上))以及地區進行細分。市場預測以價值(美元)表示。
亞太地區整合GPU市場的趨勢與洞察。
Windows 11 系統和商用筆記型電腦中 AI PC 的更換週期
Windows 10停止支援是亞太地區商用PC整合顯示卡市場最明顯的短期影響因素。由於企業負責人需要將作業系統升級到支援人工智慧的新型硬體規格,筆記型電腦的更換速度遠超以往。據惠普公司稱,人工智慧PC的出貨構成比從35%成長至44%,而亞太地區的Windows 11更新週期也使商業需求增加了2-3%。這表明,在全面升級浪潮結束之前,負責人就已經開始向更高規格的系統遷移。英特爾隨後在2026年1月發布了Core Ultra Series 3,進一步推動了這項轉變。 Core Ultra Series 3在整個平台上提供180 TOPS的人工智慧運算能力。這使得整合顯示卡不再只是一個基本的顯示元件,而是能夠支援實際人工智慧工作負載的元件。因此,亞太地區的整合式顯示卡市場受益於商用筆記型電腦最低配置要求的提高,尤其是在日本、中國、韓國、印度和澳洲。
5G智慧型手機的優質化以及對裝置端AI圖形處理的需求。
在亞太地區整合GPU市場,智慧型手機圖形處理不再僅限於渲染和媒體播放。據聯發科稱,天璣9500整合了Arm G1-Ultra GPU,與上一代產品相比,峰值效能提升33%,能源效率提升42%,同時也支援120fps的射線追蹤遊戲。聯發科還介紹了一種“基於代理的AI框架”,該框架將生成式AI任務分配到GPU著色器資源和專用神經加速器上,從而將本地AI功能擴展到旗艦級以外的機型。這意味著圖形性能現在可以同時支援遊戲、AI響應速度和能源效率,從而改變了行動電話製造商對其高階和中中階設備的定位。因此,亞太地區的整合GPU市場正受惠於中國、印度、韓國和東南亞等地區5G主導的優質化,在這些地區,更強大的設備內建AI功能正成為消費者升級設備的賣點。
高階SoC先進製程節點的代工瓶頸
在亞太地區,尖端製程節點的供應仍是整合GPU市場面臨的一大限制因素。這是因為高階智慧型手機、PC和人工智慧運算程式都需要相同的尖端晶圓。因此,高階SoC供應商面臨更嚴峻的分配環境,尤其是在大型客戶搶佔先機、小規模新興企業依賴更短規劃週期的情況下。這推高了晶圓和封裝成本,最終轉嫁到裝置價格上,並降低了供應商擴展設計以適應更高效能等級的柔軟性。此外,由於在高階市場,代工廠的供貨幾乎與架構品質同等重要,競爭產品的更新換代速度也隨之放緩。儘管在當前情況下,亞太地區的整合GPU市場可能仍會繼續成長,但預計在當前的規劃週期內,高階產品的供應將持續緊張,超過基本需求。
細分市場分析
2025年,行動SoC在亞太地區整合GPU市場佔有率中佔49.32%,智慧型手機和平板電腦仍是該地區的核心收入來源。這一主導地位反映了亞太地區在智慧型手機製造和消費領域的結構性地位,中國和韓國的OEM生態系統持續推動對整合圖形、人工智慧和連接功能的SoC的需求。桌上型電腦和筆記型電腦處理器是第二大設備類別,這主要得益於商用筆記型電腦的更換以及商用和教育設備領域持續的以筆記型電腦為中心的購買趨勢。因此,儘管隨著人工智慧功能成為更重要的購買因素,個人電腦的戰略重要性日益凸顯,但亞太地區的整合GPU市場仍主要由大規模生產的家用電子電器所支撐。
亞太地區伺服器和資料中心處理器整合顯示卡市場預計將在2026年至2031年間以18.11%的複合年成長率成長,成為成長最快的設備類別。這一成長與邊緣推理節點日益成長的需求密切相關。營運商正在尋求比專用獨立加速器更低的成本、更便捷的部署和更高的能源效率。英特爾表示,與NVIDIA Jetson Orin AGX 64GB相比,Core Ultra Series 3在機器人工作負載的大規模語言模型上性能提升高達1.9倍,在視覺、語言和動作模型上的吞吐量提升高達4.5倍,這凸顯了伺服器級整合顯卡為何在PC領域之外也備受關注。隨著中國、日本和韓國的雲端用戶和企業用戶不斷擴展在地化AI處理,亞太地區的整合式顯示卡市場正從以客戶端設備為主的市場轉型為更廣泛的運算平台市場。
其他好處:
- Excel格式的市場預測(ME)表
- 3個月的分析師支持
目錄
第1章:引言
- 研究假設和市場定義
- 調查範圍
第2章:調查方法
第3章執行摘要
第4章 市場狀況
第5章 市場概覽
- 市場促進因素
- Windows 11 和商用筆記型電腦中 AI PC 的更換週期
- 5G智慧型手機優質化以及對裝置內建AI圖形處理的需求。
- 射線追蹤與行動遊戲向主機品質的過渡
- 統一記憶體架構擴展了 iGPU 對內容創作者的工作負載。
- 在印度和東南亞採購教育設備
- 本地組裝和半導體優先待遇提高了SoC的經濟效益。
- 市場限制因素
- 高階SoC先進節點代工廠的瓶頸
- 在價格敏感型細分市場中,人工智慧個人電腦應用案例的商業化進程存在延遲。
- 先進的封裝生產能力優先考慮 AI 加速器而非整合 GPU。
- 中國的出口限制與本地化摩擦
- 產業價值鏈分析
- 監理情勢
- 技術展望
- 波特五力分析
- 宏觀經濟因素對市場的影響
第6章 市場規模與成長預測
- 透過裝置
- 桌上型電腦和筆記型電腦處理器
- 行動SoC(智慧型手機和平板電腦)
- 嵌入式和工業級SoC
- 伺服器和資料中心處理器,整合顯示卡
- 按績效水準
- 入門級(50 美元以下)
- 主流(50-150美元)
- 性能範圍(150-300美元)
- 高性能(超過 300 美元)
- 按地區
- 中國
- 日本
- 印度
- 韓國
- 台灣
- 其他亞太國家
第7章 競爭情勢
- 市場集中度
- 策略趨勢
- 市佔率分析
- 公司簡介
- Intel Corporation
- Advanced Micro Devices, Inc.
- Qualcomm Incorporated
- Apple Inc.
- MediaTek Inc.
- Samsung Electronics Co., Ltd.
- HiSilicon(Shanghai)Technologies Co., LTD.
- UNISOC(Shanghai)Technologies Co., Ltd.
- Xiaomi Corporation
- Arm Holdings plc
- Imagination Technologies Group plc
- NXP Semiconductors NV
- Renesas Electronics Corporation
- Texas Instruments Incorporated
- Rockchip Electronics Co., Ltd.
- Amlogic Co., Ltd.
- Socionext Inc.
- STMicroelectronics NV
- Broadcom Inc.
- Allwinner Technology Co., Ltd.
第8章 市場機會與未來展望
- 評估閒置頻段和未滿足的需求
According to Mordor Intelligence, the asia-Pacific integrated GPU market size is expected to grow from USD 24.67 billion in 2025 to USD 28.25 billion in 2026 and is forecast to reach USD 64.54 billion by 2031 at 17.97% CAGR over 2026-2031.
This report is Segmented by Device Category (Desktop and Laptop Processors, Mobile SoCs (Smartphones and Tablets), Embedded and Industrial SoCs, and More), Performance Tier (Entry-Level (Less Than USD 50), Mainstream (USD 50 - USD 150), Performance (USD 150 - USD 300), and High-Performance (Greater Than USD 300)), and Geography. The Market Forecasts are Provided in Terms of Value (USD).
Asia-Pacific Integrated GPU Market Trends and Insights
Windows 11 and AI PC Refresh Cycle in Commercial Notebooks
The Windows 10 support deadline became the clearest near-term trigger for the Asia-Pacific integrated GPU market in commercial PCs. Notebook replacement moved faster than in prior upgrade cycles because enterprise buyers had to align operating system migration with new AI-ready hardware specifications. HP said AI PC shipment mix increased from 35% to 44%, and the Windows 11 refresh cycle in APJ contributed a 2-3% commercial demand pull-forward, which shows that buyers were already moving toward higher-spec systems before the full migration wave had ended. Intel then reinforced that shift when it launched Core Ultra Series 3 in January 2026 with 180 TOPS of total platform AI compute, which turned the integrated graphics block into a practical AI workload enabler rather than a basic display component. As a result, the Asia-Pacific integrated GPU market is benefiting from a higher specification floor in commercial notebooks, especially in Japan, China, South Korea, India, and Australia.
5G Smartphone Premiumization and On-Device AI Graphics Demand
Smartphone graphics in the Asia-Pacific integrated GPU market are no longer being designed only for rendering and media playback. MediaTek said the Dimensity 9500 integrated the Arm G1-Ultra GPU with 33% higher peak performance and 42% better power efficiency than the prior generation, while also supporting 120fps ray-traced gaming.MediaTek also described an agentic AI framework that distributes generative AI tasks across GPU shader resources and dedicated neural acceleration, which expands local AI capability beyond the flagship tier. This changes how handset makers position premium and upper mid-range devices, because graphics performance now supports gaming, AI responsiveness, and power efficiency at the same time. The Asia-Pacific integrated GPU market therefore gains from 5G-led premiumization in China, India, South Korea, and Southeast Asia, where stronger on-device AI capability is becoming a selling point in mainstream consumer upgrades.
Advanced-Node Foundry Bottlenecks for Premium SoCs
Advanced-node supply remains a real constraint for the Asia-Pacific integrated GPU market because the same leading-edge wafers are needed by top smartphone, PC, and AI compute programs. Premium SoC vendors therefore face a more rigid allocation environment, especially when the largest customers lock in early access and smaller challengers depend on shorter planning windows. This raises wafer and packaging costs, which then feeds into device pricing and narrows the flexibility of vendors trying to scale new performance-tier designs. It also slows competitive rotation, because foundry access starts to matter almost as much as architecture quality in premium segments. The Asia-Pacific integrated GPU market can still grow under these conditions, but supply discipline is likely to keep the premium tier tighter than underlying demand through the current planning cycle.
Other drivers and restraints analyzed in the detailed report include:
- Ray Tracing and Console-Class Mobile Gaming Migration
- Unified Memory Architectures Expand Creator-Class iGPU Workloads
- Slow Monetization of AI PC Use Cases in Price-Sensitive Segments
For complete list of drivers and restraints, kindly check the Table Of Contents.
Segment Analysis
Mobile SoCs held 49.32% of Asia-Pacific integrated GPU market share in 2025, which kept the region's revenue base centered on smartphones and tablets. This leadership reflects the region's structural role in both smartphone manufacturing and consumption, with Chinese and Korean OEM ecosystems driving persistent demand for SoCs that integrate graphics, AI, and connectivity in the same package. Desktop and laptop processors formed the second-largest device category, supported by the commercial notebook refresh cycle and continued notebook-heavy buying patterns in work and education devices. The Asia-Pacific integrated GPU market therefore remained anchored in high-volume consumer electronics, even as PCs regained strategic importance because AI-readiness became a more visible purchase factor.
The Asia-Pacific integrated GPU market size for server and data center processors with integrated graphics is projected to expand at an 18.11% CAGR from 2026 to 2031, making this the fastest-growing device category. That growth is linked to rising interest in edge inference nodes, where operators want lower cost, easier deployment, and better power efficiency than purpose-built discrete accelerators can always provide. Intel said Core Ultra Series 3 delivered up to 1.9x higher large language model performance than NVIDIA Jetson Orin AGX 64GB and up to 4.5x higher vision language action model throughput in robotic workloads, which highlights why integrated server-class graphics are gaining attention beyond the PC space. As cloud and enterprise users across China, Japan, and South Korea expand localized AI processing, this category is reshaping the Asia-Pacific integrated GPU market from a primarily client-device story into a broader compute platform story.
List of Companies Covered in this Report:
- Intel Corporation
- Advanced Micro Devices, Inc.
- Qualcomm Incorporated
- Apple Inc.
- MediaTek Inc.
- Samsung Electronics Co., Ltd.
- HiSilicon (Shanghai) Technologies Co., LTD.
- UNISOC (Shanghai) Technologies Co., Ltd.
- Xiaomi Corporation
- Arm Holdings plc
- Imagination Technologies Group plc
- NXP Semiconductors N.V.
- Renesas Electronics Corporation
- Texas Instruments Incorporated
- Rockchip Electronics Co., Ltd.
- Amlogic Co., Ltd.
- Socionext Inc.
- STMicroelectronics N.V.
- Broadcom Inc.
- Allwinner Technology Co., Ltd.
Additional Benefits:
- The market estimate (ME) sheet in Excel format
- 3 months of analyst support
TABLE OF CONTENTS
1 INTRODUCTION
- 1.1 Study Assumptions and Market Definition
- 1.2 Scope of the Study
2 RESEARCH METHODOLOGY
3 EXECUTIVE SUMMARY
4 MARKET LANDSCAPE
5 Market Overview
- 5.1 Market Drivers
- 5.1.1 Windows 11 and AI PC Refresh Cycle in Commercial Notebooks
- 5.1.2 5G Smartphone Premiumization and On-Device AI Graphics Demand
- 5.1.3 Ray Tracing and Console-Class Mobile Gaming Migration
- 5.1.4 Unified Memory Architectures Expand Creator-Class iGPU Workloads
- 5.1.5 Education Device Procurement in India and Southeast Asia
- 5.1.6 Local Assembly and Semiconductor Incentives Improve SoC Economics
- 5.2 Market Restraints
- 5.2.1 Advanced-Node Foundry Bottlenecks for Premium SoCs
- 5.2.2 Slow Monetization of AI PC Use Cases in Price-Sensitive Segments
- 5.2.3 Advanced Packaging Capacity Prioritizes AI Accelerators Over iGPUs
- 5.2.4 China Export Controls and Localization Friction
- 5.3 Industry Value Chain Analysis
- 5.4 Regulatory Landscape
- 5.5 Technological Outlook
- 5.6 Porter's Five Forces Analysis
- 5.6.1 Threat of New Entrants
- 5.6.2 Bargaining Power of Suppliers
- 5.6.3 Bargaining Power of Buyers
- 5.6.4 Threat of Substitutes
- 5.6.5 Intensity of Competitive Rivalry
- 5.7 Impact of Macroeconomic Factors on the Market
6 MARKET SIZE AND GROWTH FORECASTS (VALUE)
- 6.1 By Device Category
- 6.1.1 Desktop and Laptop Processors
- 6.1.2 Mobile SoCs (Smartphones and Tablets)
- 6.1.3 Embedded and Industrial SoCs
- 6.1.4 Server and Data Center Processors with Integrated Graphics
- 6.2 By Performance Tier
- 6.2.1 Entry-Level (Less than USD 50)
- 6.2.2 Mainstream (USD 50 - USD 150)
- 6.2.3 Performance (USD 150 - USD 300)
- 6.2.4 High-Performance (Greater than USD 300)
- 6.3 By Geography
- 6.3.1 China
- 6.3.2 Japan
- 6.3.3 India
- 6.3.4 South Korea
- 6.3.5 Taiwan
- 6.3.6 Rest of Asia-Pacific
7 COMPETITIVE LANDSCAPE
- 7.1 Market Concentration
- 7.2 Strategic Moves
- 7.3 Market Share Analysis
- 7.4 Company Profiles (includes Global Level Overview, Market Level Overview, Core Segments, Financials as available, Strategic Information, Market Rank/Share, Products and Services, Recent Developments)
- 7.4.1 Intel Corporation
- 7.4.2 Advanced Micro Devices, Inc.
- 7.4.3 Qualcomm Incorporated
- 7.4.4 Apple Inc.
- 7.4.5 MediaTek Inc.
- 7.4.6 Samsung Electronics Co., Ltd.
- 7.4.7 HiSilicon (Shanghai) Technologies Co., LTD.
- 7.4.8 UNISOC (Shanghai) Technologies Co., Ltd.
- 7.4.9 Xiaomi Corporation
- 7.4.10 Arm Holdings plc
- 7.4.11 Imagination Technologies Group plc
- 7.4.12 NXP Semiconductors N.V.
- 7.4.13 Renesas Electronics Corporation
- 7.4.14 Texas Instruments Incorporated
- 7.4.15 Rockchip Electronics Co., Ltd.
- 7.4.16 Amlogic Co., Ltd.
- 7.4.17 Socionext Inc.
- 7.4.18 STMicroelectronics N.V.
- 7.4.19 Broadcom Inc.
- 7.4.20 Allwinner Technology Co., Ltd.
8 MARKET OPPORTUNITIES AND FUTURE OUTLOOK
- 8.1 White-Space and Unmet-Need Assessment
 圖形處理器 (GPU) 市場預測至 2034 年——按 GPU 類型、部署模式、記憶體類型、裝置類型、功能、應用程式、最終用戶和地區分類的全球分析
 東南亞GPU市場:市場佔有率分析、產業趨勢與統計及成長預測(2026-2031年)超大規模資料中心GPU:市場佔有率分析、產業趨勢與統計及成長預測(2026-2031年)歐洲整合顯示卡市場:市場佔有率分析、產業趨勢與統計及成長預測(2026-2031 年)北美整合顯示卡:市場佔有率分析、產業趨勢與統計及成長預測(2026-2031 年)行動GPU:市場佔有率分析、產業趨勢與統計及成長預測(2026-2031年)印度GPU市場:市場佔有率分析、產業趨勢與統計及成長預測(2026-2031年)德國GPU市場:市場佔有率分析、產業趨勢與統計及成長預測(2026-2031年)日本GPU市場:市佔率分析、產業趨勢與統計及成長預測(2026-2031年)美國GPU市場:市佔率分析、產業趨勢與統計及成長預測(2026-2031年)