

 |
市場調查報告書
商品編碼
2064460
美國GPU市場:市佔率分析、產業趨勢與統計及成長預測(2026-2031年)United States GPU - Market Share Analysis, Industry Trends & Statistics, Growth Forecasts (2026 - 2031) |
||||||
※ 本網頁內容可能與最新版本有所差異。詳細情況請與我們聯繫。
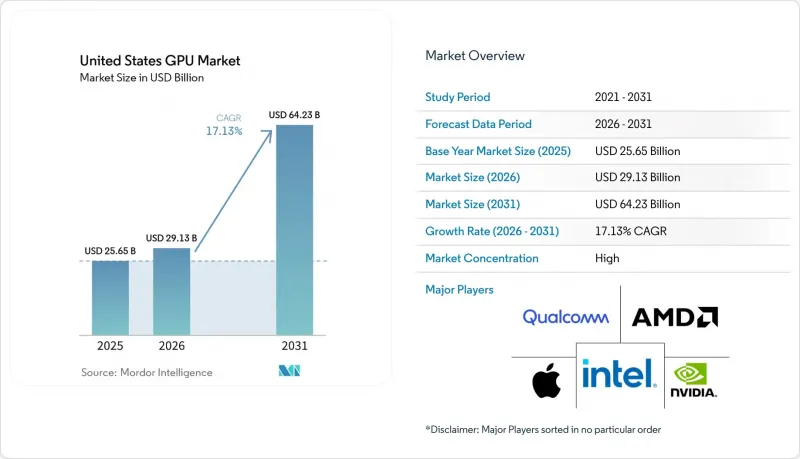
根據 Mordor Intelligence 預測,美國 GPU 市場規模將從 2025 年的 256.5 億美元和 2026 年的 291.3 億美元成長到 2031 年的 642.3 億美元,2026 年至 2031 年的複合年成長率為 17.13%。
本報告按整合類型(整合GPU、獨立GPU)和裝置應用(行動裝置和平板電腦、PC和工作站、伺服器和資料中心加速器、遊戲主機和掌上型遊戲機、汽車/ADAS以及其他嵌入式和邊緣裝置)進行細分。市場預測以美元計價。
美國GPU市場的趨勢與洞察
擴大人工智慧和資料中心加速技術的應用
超大規模營運商預計,到2025年,國內將部署超過一百萬台加速器,其中微軟Azure、AWS和Google雲端將佔據近五分之四的出貨量。目前,多年合約正在取代現貨採購,從而在晶片流片之前就確保了晶圓和封裝的生產能力。雖然這些合約保障了生產優先級,但它們透過減少對區域雲端供應商和研究機構的供應,間接推動了GPU即服務(GPUaaS)模式的發展。一次尖端訓練運行可能需要數萬張GPU卡持續數月,而管理300至1000兆瓦的負載則需要現場發電或將伺服器託管在基本負載電源附近。
對高效能遊戲電腦的需求日益成長
2024年第四季,美國獨立遊戲顯示卡出貨量達840萬張。這主要得益於支援定序競速的遊戲和需要專用運算能力的AI驅動的影像增強技術。然而,售價在300至500美元之間的中階顯示卡已經搶佔了售價超過1000美元的旗艦顯卡的市場佔有率,拉低了平均售價。儘管入門級市場正受到雲端遊戲的衝擊,但電競愛好者仍願意為能夠達到240幀的硬體支付溢價。
先進節點的供應鏈限制
先進封裝技術比晶圓生產落後約18個月,即使3nm晶圓供應充足,出貨量也受限。高頻寬記憶體的供應同樣緊張,迫使小規模買家接受現貨價格40%的溢價,或推廣專案。國內千兆晶圓廠的建設至少要到2028年或更晚才能填補這一缺口,這意味著由於供不應求,價格將居高不下,並且優先分配給簽訂長期合約的超大規模資料中心業者。
細分市場分析
預計到2025年,美國GPU市場中,獨立顯示卡將佔66.29%的佔有率。這反映了市場對專用記憶體、獨立供電和先進散熱解決方案的需求。高階資料中心顯示卡功耗高達700瓦,配備192GB HBM3E顯存,FP8吞吐量超過20 petaflops,能夠進行兆參數規模的模型訓練。隨著超大規模資料超大規模資料中心業者集群中數百萬個加速器的部署,預計美國獨立顯示卡市場將以17.53%的複合年成長率成長。整合式顯示卡佔33.71%的市場佔有率,主要針對筆記型電腦、平板電腦和精簡型用戶端等對功耗要求極高的裝置。高通、蘋果和英特爾正在縮小效能差距,在電池供電設備中提供15-30 teraflops的運算能力,這給入門級獨立顯示卡的需求帶來了壓力。
整合式顯示卡正在主導中階消費市場,而這一市場曾經由售價低於300美元的獨立顯示卡佔據。英特爾即將推出的Panther Lake平台整合了速率定序和矩陣處理引擎,而高通驍龍X2 Elite在功耗低於15瓦的情況下實現了80 TOPS的神經網路吞吐量。因此,獨立顯示卡廠商正將目光轉向利潤豐厚的資料中心、工作站和發燒友市場。在這些市場中,客戶優先考慮每個節點的峰值效能,並投資水冷散熱基礎設施以提升效能。這種策略轉變使他們能夠在消費通路銷售額持平甚至下滑的情況下,仍能維持超過60%的毛利率。
其他福利
- Excel格式的市場預測(ME)表
- 3個月的分析師支持
目錄
第1章:引言
- 研究假設和市場定義
- 調查範圍
第2章:調查方法
第3章執行摘要
第4章 市場狀況
- 市場概覽
- 市場促進因素
- 對高效能遊戲電腦的需求日益成長
- 人工智慧的發展以及資料中心加速器的日益普及
- 雲端遊戲服務日益普及
- 面向專業消費者的內容創作工作量增加
- 政府對國內半導體製造的優惠待遇
- 企業桌面GPU虛擬化的興起
- 市場限制因素
- 先進節點的供應鏈限制
- 高功耗和散熱挑戰
- 整合顯示卡蠶食中階市場
- 加強對資料中心GPU能耗排放的監測
- 宏觀經濟因素對市場的影響
- 產業價值/價值鏈分析
- 監理情勢
- 技術展望
- 波特五力分析
第5章 市場規模與成長預測
- 按類型整合
- 整合顯示卡(iGPU)
- 獨立GPU(dGPU)
- 裝置應用程式
- 行動裝置和平板電腦
- 個人電腦和工作站
- 伺服器和資料中心加速器
- 遊戲主機和掌上型遊戲機
- 汽車/ADAS
- 其他嵌入式和邊緣設備
第6章 競爭情勢
- 市場集中度
- 策略趨勢
- 市佔率分析
- 公司簡介
- Nvidia Corporation
- Advanced Micro Devices, Inc.
- Intel Corporation
- Qualcomm Incorporated
- Apple Inc.
- Samsung Electronics Co., Ltd.
- Arm Holdings plc
- Imagination Technologies Limited
- MediaTek Inc.
- Broadcom Inc.
- Matrox Electronic Systems Ltd.
- Texas Instruments Incorporated
- NXP Semiconductors NV
- Renesas Electronics Corporation
- Graphcore Ltd.
- VIA Technologies, Inc.
- Rockchip Electronics Co., Ltd.
- Allwinner Technology Co., Ltd.
- Zhaoxin Semiconductor Co., Ltd.
第7章 市場機會與未來展望
According to Mordor Intelligence, the united states gPU market size is projected to expand from USD 25.65 billion in 2025 and USD 29.13 billion in 2026 to USD 64.23 billion by 2031, registering a CAGR of 17.13% between 2026 and 2031.
This report is Segmented by Integration Type (Integrated GPUs, Discrete GPUs) and Device Application (Mobile Devices and Tablets, Pcs and Workstations, Servers and Datacenter Accelerators, Gaming Consoles and Handhelds, Automotive/ADAS, Other Embedded and Edge Devices). The Market Forecasts are Provided in Terms of Value (USD).
United States GPU Market Trends and Insights
Growth In AI And Data Center Acceleration Adoption
Hyperscale operators deployed more than one million accelerators domestically in 2025, with Microsoft Azure, AWS, and Google Cloud representing nearly four-fifths of shipments. Multi-year supply contracts now replace spot buys, locking in wafer and packaging capacity well before tape-out. Such commitments protect production priority but reduce availability for regional cloud providers and research labs, indirectly propelling the GPU-as-a-Service model. A single state-of-the-art training run can occupy tens of thousands of cards for months, requiring on-site generation or co-location near baseload power to manage 300- to 1,000-megawatt loads.
Expanding Demand For High-Performance Gaming PCs
U.S. shipments of discrete gaming cards climbed to 8.4 million units in Q4 2024, buoyed by ray-tracing titles and AI-driven upscaling that demand dedicated compute. Yet mid-range boards priced from USD 300 to USD 500 grabbed share from USD 1,000-plus flagships, trimming blended average prices. The entry-level market is being eroded by cloud gaming, while eSports enthusiasts still pay premiums for 240 fps hardware.
Supply Chain Constraints Of Advanced Nodes
Advanced packaging lags wafer output by roughly 18 months, restricting shipments even when plenty of 3 nm wafers are available. The supply of high-bandwidth memory is also tight, forcing smaller buyers to accept 40% spot-price premiums or defer projects. Domestic gigafab construction will close the gap only after 2028, so scarcity will keep prices elevated and allocate priority to hyperscalers with long-term contracts.
Other drivers and restraints analyzed in the detailed report include:
- Government Incentives For Domestic Semiconductor Manufacturing
- Rising Popularity Of Cloud Gaming Services
- High Power Consumption And Cooling Challenges
For complete list of drivers and restraints, kindly check the Table Of Contents.
Segment Analysis
Discrete accelerators accounted for 66.29% of the United States GPU market in 2025, reflecting demand for dedicated memory stacks, independent power rails, and aggressive thermal solutions. Premium datacenter boards showcase 700-watt envelopes, 192 GB of HBM3E, and FP8 throughput exceeding 20 petaflops, enabling trillion-parameter model training. The United States GPU market size for discrete products is projected to grow at 17.53% CAGR as hyperscalers scale clusters by the million-accelerator level. Integrated designs hold 33.71% share and target laptop, tablet, and thin-client workloads where 15-watt budgets are paramount. Qualcomm, Apple, and Intel are closing the capability gap, offering 15-30 teraflops in battery-powered devices, which compresses entry-level discrete demand.
Integrated GPUs are capturing mid-tier consumer spend once served by cards below USD 300. Intel's forthcoming Panther Lake platform integrates ray tracing and matrix engines, while Qualcomm's Snapdragon X2 Elite delivers 80 TOPS neural throughput at sub-15-watt draw. Vendors of discrete boards, therefore, concentrate on high-margin datacenter, workstation, and enthusiast segments, where customers value peak performance per node and invest in liquid cooling infrastructure to unlock gains. This strategic pivot supports gross margins above 60% despite flat to declining unit volume in the consumer channel.
List of Companies Covered in this Report:
- Nvidia Corporation
- Advanced Micro Devices, Inc.
- Intel Corporation
- Qualcomm Incorporated
- Apple Inc.
- Samsung Electronics Co., Ltd.
- Arm Holdings plc
- Imagination Technologies Limited
- MediaTek Inc.
- Broadcom Inc.
- Matrox Electronic Systems Ltd.
- Texas Instruments Incorporated
- NXP Semiconductors N.V.
- Renesas Electronics Corporation
- Graphcore Ltd.
- VIA Technologies, Inc.
- Rockchip Electronics Co., Ltd.
- Allwinner Technology Co., Ltd.
- Zhaoxin Semiconductor Co., Ltd.
Additional Benefits:
- The market estimate (ME) sheet in Excel format
- 3 months of analyst support
TABLE OF CONTENTS
1 INTRODUCTION
- 1.1 Study Assumptions and Market Definition
- 1.2 Scope of the Study
2 RESEARCH METHODOLOGY
3 EXECUTIVE SUMMARY
4 MARKET LANDSCAPE
- 4.1 Market Overview
- 4.2 Market Drivers
- 4.2.1 Expanding Demand for High-Performance Gaming PCs
- 4.2.2 Growth in AI and Data Center Acceleration Adoption
- 4.2.3 Rising Popularity of Cloud Gaming Services
- 4.2.4 Increasing Content Creation Workloads Among Prosumers
- 4.2.5 Government Incentives for Domestic Semiconductor Manufacturing
- 4.2.6 Emergence of GPU Virtualization for Enterprise Desktops
- 4.3 Market Restraints
- 4.3.1 Supply Chain Constraints of Advanced Nodes
- 4.3.2 High Power Consumption and Cooling Challenges
- 4.3.3 Market Cannibalization by Integrated GPUs in Mid-Range Segments
- 4.3.4 Rising Scrutiny Over GPU Energy Emissions in Data Centers
- 4.4 Impact of Macroeconomic Factors on the Market
- 4.5 Industry Value / Supply-Chain Analysis
- 4.6 Regulatory Landscape
- 4.7 Technological Outlook
- 4.8 Porter's Five Forces Analysis
- 4.8.1 Bargaining Power of Suppliers
- 4.8.2 Bargaining Power of Buyers
- 4.8.3 Threat of New Entrants
- 4.8.4 Threat of Substitutes
- 4.8.5 Competitive Rivalry
5 MARKET SIZE AND GROWTH FORECASTS
- 5.1 By Integration Type
- 5.1.1 Integrated GPUs (iGPU)
- 5.1.2 Discrete GPUs (dGPU)
- 5.2 By Device Application
- 5.2.1 Mobile Devices and Tablets
- 5.2.2 PCs and Workstations
- 5.2.3 Servers and Datacenter Accelerators
- 5.2.4 Gaming Consoles and Handhelds
- 5.2.5 Automotive / ADAS
- 5.2.6 Other Embedded and Edge Devices
6 COMPETITIVE LANDSCAPE
- 6.1 Market Concentration
- 6.2 Strategic Moves
- 6.3 Market Share Analysis
- 6.4 Company Profiles (includes Global Level Overview, Market Level Overview, Core Segments, Financials as available, Strategic Information, Market Rank/Share, Products and Services, Recent Developments)
- 6.4.1 Nvidia Corporation
- 6.4.2 Advanced Micro Devices, Inc.
- 6.4.3 Intel Corporation
- 6.4.4 Qualcomm Incorporated
- 6.4.5 Apple Inc.
- 6.4.6 Samsung Electronics Co., Ltd.
- 6.4.7 Arm Holdings plc
- 6.4.8 Imagination Technologies Limited
- 6.4.9 MediaTek Inc.
- 6.4.10 Broadcom Inc.
- 6.4.11 Matrox Electronic Systems Ltd.
- 6.4.12 Texas Instruments Incorporated
- 6.4.13 NXP Semiconductors N.V.
- 6.4.14 Renesas Electronics Corporation
- 6.4.15 Graphcore Ltd.
- 6.4.16 VIA Technologies, Inc.
- 6.4.17 Rockchip Electronics Co., Ltd.
- 6.4.18 Allwinner Technology Co., Ltd.
- 6.4.19 Zhaoxin Semiconductor Co., Ltd.
7 MARKET OPPORTUNITIES AND FUTURE OUTLOOK
- 7.1 White-Space and Unmet-Need Assessment
 圖形處理器 (GPU) 市場預測至 2034 年——按 GPU 類型、部署模式、記憶體類型、裝置類型、功能、應用程式、最終用戶和地區分類的全球分析
 東南亞GPU市場:市場佔有率分析、產業趨勢與統計及成長預測(2026-2031年)超大規模資料中心GPU:市場佔有率分析、產業趨勢與統計及成長預測(2026-2031年)亞太地區整合GPU:市場佔有率分析、產業趨勢與統計及成長預測(2026-2031年)歐洲整合顯示卡市場:市場佔有率分析、產業趨勢與統計及成長預測(2026-2031 年)北美整合顯示卡:市場佔有率分析、產業趨勢與統計及成長預測(2026-2031 年)行動GPU:市場佔有率分析、產業趨勢與統計及成長預測(2026-2031年)印度GPU市場:市場佔有率分析、產業趨勢與統計及成長預測(2026-2031年)德國GPU市場:市場佔有率分析、產業趨勢與統計及成長預測(2026-2031年)日本GPU市場:市佔率分析、產業趨勢與統計及成長預測(2026-2031年)