

 |
市場調查報告書
商品編碼
2065583
北美整合顯示卡:市場佔有率分析、產業趨勢與統計及成長預測(2026-2031 年)North America Integrated GPU - Market Share Analysis, Industry Trends & Statistics, Growth Forecasts (2026 - 2031) |
||||||
※ 本網頁內容可能與最新版本有所差異。詳細情況請與我們聯繫。
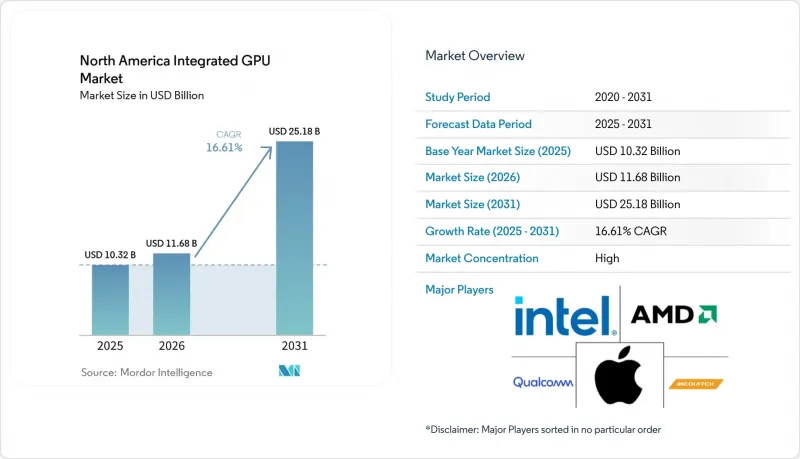
根據 Mordor Intelligence 預測,北美整合 GPU 市場規模預計將在 2025 年達到 103.2 億美元,並在 2026 年至 2031 年以 16.61% 的複合年成長率成長,到 2031 年達到 251.8 億美元。
本報告按設備類別(桌上型電腦和筆記型電腦處理器、行動SoC(智慧型手機和平板電腦)、嵌入式和工業SoC以及具有整合式顯示卡的伺服器和資料中心處理器)、效能等級(入門級(50美元以下)、主流級(50-150美元)、高效能級(150-300美元)及其他)和國家/地區進行細分。市場預測以美元計價。
北美整合GPU市場趨勢與洞察
Windows 10 支援結束後,人工智慧 PC 的更換週期將隨之結束。
Windows 10 將於 2025 年 10 月 14 日停止支持,這意味著企業和中小企業 (SMB) 仍在廣泛使用的系統將不再獲得常規的安全和功能更新。在北美,這項變革使得受安全和合規性要求約束的 IT 團隊更迫切地需要更換 PC。英特爾酷睿 Ultra 系列 3 Panther Lake 處理器於 2026 年 1 月在 CES 上正式上市。這些處理器是首批採用英特爾 18A 製程製造的面向客戶端的晶片,配備 Xe3 Arc GPU,平台算力高達 180 TOPS,效能較上一代產品顯著提升。此外,微軟「Copilot+」對 PC 的 NPU TOPS 要求也使得許多老舊系統不再適合進行裝置端 AI 處理。明確的停止支援期限,加上硬體效能的顯著提升,迫使企業加快更新預算,而不是延遲採購。此外,買家不僅更換老舊的個人電腦,還投資於人工智慧功能本身,這也推動了北美整合GPU市場的短期擴張。
提升高階智慧型手機和平板電腦SoC中的GenAI工作負載
蘋果將於2025年10月15日發表M5處理器,該處理器採用第三代3奈米製程工藝,配備10核心GPU、每個GPU核心專用的神經網路加速器以及153GB/s的整合記憶體頻寬。據蘋果公司稱,與M4相比,這款晶片的GPU AI運算峰值性能提升了四倍以上,提高了該地區高階筆記型電腦、平板電腦和空間感知設備的性能標準。高通的異構設計將Adreno GPU和Hexagon NPU整合在同一晶片上,避免了晶片外資料傳輸,並降低了記憶體延遲,從而提高了裝置令牌生成速度。這對於北美整合GPU市場意義重大,因為高階用戶越來越希望語音、視覺、翻譯和助理功能能夠在本地運行,並具有更高的響應速度和隱私保護。這款將於2025年6月出貨的10.7 Gbps Micron 1-gamma LPDDR5X內存,在微軟的Llama 2測試中,功耗降低了20%,AI語音翻譯響應時間縮短了50%以上。因此,記憶體吞吐量的提升不僅體現在基準測試分數上,更增強了旗艦智慧型手機和平板電腦中整合顯示卡(iGPU)的持續可用性。
獨立顯示卡在遊戲和工作站中的效能極限
由於整合式顯示卡仍共用CPU 和系統內存,其可用頻寬遠低於採用 GDDR6X 或 HBM 記憶體的獨立顯示卡。英特爾表示,搭載 Xe3 圖形處理器的 Panther Lake 處理器效能接近入門級行動獨立顯示卡,但與高階遊戲和工作站顯示卡之間仍存在較大差距。在北美,這一差距尤其顯著,因為遊戲、3D 內容創作、建築視覺化和模擬等應用集中在專業領域,而專業領域的單價最高。這些工作負載需要持續的記憶體頻寬和超過 24 GB 的記憶體容量,而目前的整合式顯示卡平台在多用戶或多型號環境下無法滿足這些需求。對廠商而言,問題更在於收入密度而非總出貨量,因為獨立顯示卡仍然佔據圖形相關支出的高價位市場。因此,北美整合式顯示卡市場可以在不完全取代盈利最高的工作站和發燒友市場的情況下快速成長。
細分市場分析
2025年,行動SoC佔設備類別銷售額的49.55%,在北美整合GPU市場中佔據最大佔有率。蘋果在高階智慧型手機和平板電腦領域的強勁表現使其保持領先地位,而高通則進一步擴大了其在高階Windows on ARM系統和高階行動運算的市場佔有率。桌上型電腦和筆記型電腦處理器在北美整合GPU市場仍佔據核心地位。這是因為企業更新換代的需求不僅與常規升級有關,還與支援人工智慧的用戶端硬體密切相關。據AMD稱,該公司行動處理器的市佔率在2025年第四季上升至26.0%,反映出Ryzen AI在企業和高階消費系統中的應用日益廣泛。嵌入式和工業SoC的銷售額仍然小規模,但它們在工廠自動化、能源和零售設備部署中仍然廣泛使用。
預計到2031年,整合顯示卡的伺服器和資料中心處理器將以16.98%的複合年成長率成長,成為成長最快的設備類別。這一成長反映了機架邊緣的實際需求,在這些區域,推理、視覺化、媒體處理和本地顯示輸出通常需要同時進行,而無需使用獨立的擴充卡。英特爾發布了基於Xe3P架構的資料中心GPU Crescent Island,強調了這個發展方向。 Crescent Island配備160GB LPDDR5X顯存,適用於風冷式企業級推理工作負載。 AMD也在2025年11月表示,預計資料中心AI銷售額將實現極速成長,進而推動嵌入式圖形IP在面向邊緣的伺服器平台上得到更廣泛的應用。在北美整合GPU產業,由於低功耗、簡化部署以及在分店和工廠等無需部署獨立加速卡的應用場景,市場需求正在不斷成長。
其他好處:
- Excel格式的市場預測(ME)表
- 3個月的分析師支持
目錄
第1章:引言
- 研究假設和市場定義
- 調查範圍
第2章:調查方法
第3章執行摘要
第4章 市場狀況
- 市場概覽
- 宏觀經濟因素對市場的影響
- 市場促進因素
- Windows 10 支援結束後,人工智慧 PC 的更換週期將隨之結束。
- 高階智慧型手機和平板電腦SoC中日益成長的GenAI工作負載
- 在主流系統中,與獨立顯示卡相比,成本和功耗方面具有優勢。
- 邊緣人工智慧和工業人機介面SoC的成長
- 透過 LPDDR5X 和提高整合記憶體頻寬,提高了 iGPU 的可用性。
- 在關稅壓力下最佳化單晶片平台
- 市場限制因素
- 與獨立顯示卡相比,整合顯示卡在遊戲和工作站方面的效能上限更高。
- 共用記憶體頻寬和容量限制
- 高額關稅和不斷上漲的記憶體價格推高了系統價格。
- 不適用於伺服器和資料中心環境中的整合式顯示卡。
- 產業價值鏈分析
- 監理情勢
- 技術展望
- 波特五力分析
第5章 市場規模與成長預測
- 透過裝置
- 桌上型電腦和筆記型電腦處理器
- 行動SoC(智慧型手機和平板電腦)
- 嵌入式和工業級SoC
- 伺服器和資料中心處理器,整合顯示卡
- 按績效水準
- 入門級(低於50美元)
- 主流(50-150美元)
- 性能範圍(150-300美元)
- 高性能(超過 300 美元)
- 國家
- 美國
- 加拿大
- 墨西哥
第6章 競爭情勢
- 市場集中度
- 策略趨勢
- 市佔率分析
- 公司簡介
- Intel Corporation
- Advanced Micro Devices, Inc.
- Apple Inc.
- Qualcomm Incorporated
- MediaTek Inc.
- NVIDIA Corporation
- Samsung Electronics Co., Ltd.
- NXP Semiconductors NV
- Renesas Electronics Corporation
- Texas Instruments Incorporated
- Arm Holdings plc
- Imagination Technologies Group plc
- Google LLC
- STMicroelectronics NV
- Synaptics Incorporated
- Socionext Inc.
- Telechips Inc.
- Amlogic, Inc.
- Rockchip Electronics Co., Ltd.
- Microchip Technology Incorporated
第7章 市場機會與未來展望
According to Mordor Intelligence, the north america integrated GPU market size was USD 10.32 billion in 2025 and is projected to reach USD 25.18 billion by 2031 at a CAGR of 16.61% during 2026-2031.
This report is Segmented by Device Category (Desktop and Laptop Processors, Mobile SoCs (Smartphones and Tablets), Embedded and Industrial SoCs, and Server and Data Center Processors With Integrated Graphics), Performance Tier (Entry-Level (less Than USD 50), Mainstream (USD 50 - USD 150), Performance (USD 150 - USD 300), and More), and Country. The Market Forecasts are Provided in Terms of Value (USD).
North America Integrated GPU Market Trends and Insights
AI PC Refresh Cycle After Windows 10 End of Support
Windows 10 reached end of support on October 14, 2025, which removed regular security and feature updates for systems that were still widely used across enterprise and SMB fleets. In North America, that change turned PC replacement into a more urgent decision for IT teams working under security and compliance requirements. Intel's Core Ultra Series 3 Panther Lake processors entered commercial availability at CES in January 2026 as the first client chips built on Intel 18A, with up to 180 Platform TOPS and an Xe3 Arc GPU that moved performance well above the prior generation. Microsoft's Copilot+ PC threshold of 40 dedicated NPU TOPS also placed many older systems outside the preferred hardware pool for on-device AI work. This pairing of a firm support deadline and a clear hardware step-up is pulling refresh budgets forward instead of letting companies delay purchases. It is also supporting near-term expansion in the North America integrated GPU market because buyers are paying for AI readiness rather than only replacing aging PCs.
Rising GenAI Workloads on Premium Smartphone and Tablet SoCs
Apple's M5, released on October 15, 2025, used third-generation 3-nanometer technology, a 10-core GPU, dedicated Neural Accelerators in each GPU core, and 153 GB/s of unified memory bandwidth. Apple said the chip delivered more than 4x peak GPU AI compute versus M4, which raised the performance standard for premium notebooks, tablets, and spatial devices sold in the region. Qualcomm's heterogeneous design pairs the Adreno GPU with the Hexagon NPU on the same die, which improves on-device token generation by avoiding off-chip data movement and reducing memory latency. This matters in the North America integrated GPU market because premium users increasingly expect voice, vision, translation, and assistant features to run locally with better responsiveness and privacy. Micron's 1-gamma LPDDR5X, shipped in June 2025 at 10.7 Gbps, cut power use by 20% and improved AI voice-translation response times by more than 50% in the company's Llama 2 testing. Higher memory throughput is therefore improving sustained iGPU usability in flagship smartphones and tablets rather than only lifting headline benchmark scores.
Performance Ceiling Versus Discrete GPUs in Gaming and Workstations
Integrated graphics still share system memory with the CPU, which keeps available bandwidth well below discrete cards that use GDDR6X or HBM. Intel said Panther Lake with Xe3 graphics moved closer to entry-level discrete mobile performance, but that still leaves a large gap to higher-end gaming and workstation cards. In North America, that gap matters because gaming, 3D content creation, architectural visualization, and simulation remain concentrated in professional segments that pay the highest per-unit prices. These workloads also require sustained memory bandwidth and VRAM pools that can exceed 24 GB, which current iGPU platforms do not match in multi-user or multi-model settings. The issue for vendors is less about total shipment volumes and more about revenue density, because the premium end of graphics spending still sits in discrete hardware. As a result, the North America integrated GPU market can grow rapidly without fully displacing the most profitable workstation and enthusiast categories.
Other drivers and restraints analyzed in the detailed report include:
- Cost and Power Advantage Versus Discrete Graphics in Mainstream Systems
- Growth in Edge AI and Industrial HMI SoCs
- Shared Memory Bandwidth and Capacity Constraints
For complete list of drivers and restraints, kindly check the Table Of Contents.
Segment Analysis
Mobile SoCs held 49.55% of device-category revenue in 2025, the largest slice of the North America integrated GPU market share within this segmentation. Apple's strength in premium smartphones and tablets helped sustain that lead, while Qualcomm continued to build its role in higher-value Windows-on-ARM systems and premium mobile computing. Desktop and laptop processors remain central to the North America integrated GPU market because enterprise refresh demand is now tied to AI-ready client hardware rather than only routine replacement. AMD said its mobile processor unit share rose to 26.0% in Q4 2025, reflecting stronger Ryzen AI uptake in enterprise and premium consumer systems. Embedded and industrial SoCs stayed smaller in revenue terms, but they remained widely distributed across factory automation, energy, and retail equipment deployments.
Server and Data Center Processors with Integrated Graphics are projected to expand at a 16.98% CAGR through 2031, making them the fastest-growing device category. That growth reflects a practical need at the rack edge, where inference, visualization, media handling, and local display output often need to run together without the cost of a discrete add-in card. Intel highlighted this direction with Crescent Island, an Xe3P-based data center GPU announced with 160 GB of LPDDR5X memory for air-cooled enterprise inference workloads. AMD also said in November 2025 that it expected very rapid expansion in data center AI revenue, which supports wider use of embedded graphics IP across edge-oriented server platforms. Across the North America integrated GPU industry, this category is gaining from lower idle power, simpler deployment, and branch and factory use cases that do not justify a separate accelerator card.
List of Companies Covered in this Report:
- Intel Corporation
- Advanced Micro Devices, Inc.
- Apple Inc.
- Qualcomm Incorporated
- MediaTek Inc.
- NVIDIA Corporation
- Samsung Electronics Co., Ltd.
- NXP Semiconductors N.V.
- Renesas Electronics Corporation
- Texas Instruments Incorporated
- Arm Holdings plc
- Imagination Technologies Group plc
- Google LLC
- STMicroelectronics N.V.
- Synaptics Incorporated
- Socionext Inc.
- Telechips Inc.
- Amlogic, Inc.
- Rockchip Electronics Co., Ltd.
- Microchip Technology Incorporated
Additional Benefits:
- The market estimate (ME) sheet in Excel format
- 3 months of analyst support
TABLE OF CONTENTS
1 INTRODUCTION
- 1.1 Study Assumptions and Market Definition
- 1.2 Scope of the Study
2 RESEARCH METHODOLOGY
3 EXECUTIVE SUMMARY
4 MARKET LANDSCAPE
- 4.1 Market Overview
- 4.2 Impact of Macroeconomic Factors on the Market
- 4.3 Market Drivers
- 4.3.1 AI PC Refresh Cycle After Windows 10 End of Support
- 4.3.2 Rising GenAI Workloads on Premium Smartphone and Tablet SoCs
- 4.3.3 Cost and Power Advantage Versus Discrete Graphics in Mainstream Systems
- 4.3.4 Growth in Edge AI and Industrial HMI SoCs
- 4.3.5 LPDDR5X and Unified Memory Bandwidth Lifting iGPU Usability
- 4.3.6 Single-Chip Platform Optimization Under Tariff Pressure
- 4.4 Market Restraints
- 4.4.1 Performance Ceiling Versus Discrete GPUs in Gaming and Workstations
- 4.4.2 Shared Memory Bandwidth and Capacity Constraints
- 4.4.3 Tariffs and Memory Inflation Raising System Prices
- 4.4.4 Limited Fit for Integrated Graphics in Server and Data Center Deployments
- 4.5 Industry Value Chain Analysis
- 4.6 Regulatory Landscape
- 4.7 Technological Outlook
- 4.8 Porter's Five Forces Analysis
- 4.8.1 Threat of New Entrants
- 4.8.2 Bargaining Power of Suppliers
- 4.8.3 Bargaining Power of Buyers
- 4.8.4 Threat of Substitutes
- 4.8.5 Intensity of Rivalry
5 MARKET SIZE AND GROWTH FORECASTS (VALUE)
- 5.1 By Device Category
- 5.1.1 Desktop and Laptop Processors
- 5.1.2 Mobile SoCs (Smartphones and Tablets)
- 5.1.3 Embedded and Industrial SoCs
- 5.1.4 Server and Data Center Processors with Integrated Graphics
- 5.2 By Performance Tier
- 5.2.1 Entry-Level (Less than USD 50)
- 5.2.2 Mainstream (USD 50 - USD 150)
- 5.2.3 Performance (USD 150 - USD 300)
- 5.2.4 High-Performance (Greater than USD 300)
- 5.3 By Country
- 5.3.1 United States
- 5.3.2 Canada
- 5.3.3 Mexico
6 COMPETITIVE LANDSCAPE
- 6.1 Market Concentration
- 6.2 Strategic Moves
- 6.3 Market Share Analysis
- 6.4 Company Profiles (includes Global Level Overview, Market Level Overview, Core Segments, Financials as available, Strategic Information, Market Rank/Share, Products and Services, Recent Developments)
- 6.4.1 Intel Corporation
- 6.4.2 Advanced Micro Devices, Inc.
- 6.4.3 Apple Inc.
- 6.4.4 Qualcomm Incorporated
- 6.4.5 MediaTek Inc.
- 6.4.6 NVIDIA Corporation
- 6.4.7 Samsung Electronics Co., Ltd.
- 6.4.8 NXP Semiconductors N.V.
- 6.4.9 Renesas Electronics Corporation
- 6.4.10 Texas Instruments Incorporated
- 6.4.11 Arm Holdings plc
- 6.4.12 Imagination Technologies Group plc
- 6.4.13 Google LLC
- 6.4.14 STMicroelectronics N.V.
- 6.4.15 Synaptics Incorporated
- 6.4.16 Socionext Inc.
- 6.4.17 Telechips Inc.
- 6.4.18 Amlogic, Inc.
- 6.4.19 Rockchip Electronics Co., Ltd.
- 6.4.20 Microchip Technology Incorporated
7 MARKET OPPORTUNITIES AND FUTURE OUTLOOK
- 7.1 White-Space and Unmet-Need Assessment
 圖形處理器 (GPU) 市場預測至 2034 年——按 GPU 類型、部署模式、記憶體類型、裝置類型、功能、應用程式、最終用戶和地區分類的全球分析
 東南亞GPU市場:市場佔有率分析、產業趨勢與統計及成長預測(2026-2031年)超大規模資料中心GPU:市場佔有率分析、產業趨勢與統計及成長預測(2026-2031年)亞太地區整合GPU:市場佔有率分析、產業趨勢與統計及成長預測(2026-2031年)歐洲整合顯示卡市場:市場佔有率分析、產業趨勢與統計及成長預測(2026-2031 年)行動GPU:市場佔有率分析、產業趨勢與統計及成長預測(2026-2031年)印度GPU市場:市場佔有率分析、產業趨勢與統計及成長預測(2026-2031年)德國GPU市場:市場佔有率分析、產業趨勢與統計及成長預測(2026-2031年)日本GPU市場:市佔率分析、產業趨勢與統計及成長預測(2026-2031年)美國GPU市場:市佔率分析、產業趨勢與統計及成長預測(2026-2031年)