

 |
市場調查報告書
商品編碼
2065521
行動GPU:市場佔有率分析、產業趨勢與統計及成長預測(2026-2031年)Mobile GPU - Market Share Analysis, Industry Trends & Statistics, Growth Forecasts (2026 - 2031) |
||||||
※ 本網頁內容可能與最新版本有所差異。詳細情況請與我們聯繫。
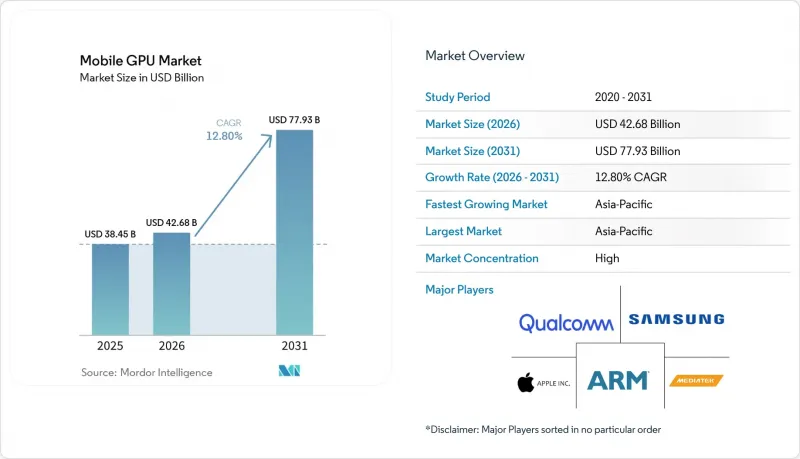
根據 Mordor Intelligence 預測,行動 GPU 市場規模將從 2025 年的 384.5 億美元和 2026 年的 426.8 億美元成長到 2031 年的 779.3 億美元,2026 年至 2031 年的年複合成長率(CAGR)為 12.8%。
本報告按設備類型(智慧型手機和平板電腦)、設備價格範圍(入門級設備低於 200 美元,中階設備 200 美元至 600 美元及以上)、最終用戶群(消費者和企業)以及地區(北美、歐洲、亞太地區及其他地區)進行細分。市場預測以美元計價。
全球行動GPU市場趨勢與洞察
行動遊戲對圖形效能的需求日益成長
2024年,隨著行動遊戲收入的成長和遊戲時間的延長,裝置製造商必須確保在不出現過熱降頻的情況下,穩定提供每秒60幀的遊戲體驗。聯發科的天璣9500將於2025年9月發布,它採用Mali-G1 Ultra GPU,射線追蹤吞吐量提升119%,從而在《原神》等遊戲中實現即時光照效果。策略和角色扮演遊戲的安裝量正呈現兩位數的成長,由於這些遊戲類型依賴複雜的著色器管線,OEM廠商正在為圖形晶片分配更多面積。隨著發行商從超休閒遊戲轉向遊戲時長在5-30分鐘之間的混合休閒遊戲,市場對能夠保持溫度在安全範圍內的中階設備的需求正在加速成長。
行動GPU中AI加速器的應用
目前的SoC整合了處理能力高達每秒40至48兆次運算的神經網路處理單元(NPU),因此能夠在裝置上實現夜間模式攝影、即時翻譯和生成式AI特效等功能。高通驍龍8 Elite Gen 5將Adreno 840 GPU與45 TOPS的Hexagon NPU結合,使影像處理管線的動態範圍提升了四倍。微軟第11代Surface Pro也採用了這款晶片,可驅動兩台外接4K顯示器,同時運行設備內摘要功能,以適應混合辦公環境。透過將Tensor Engine置於GPU叢集,設計人員可以啟用共用快取,從而緩解記憶體爭用,並允許圖形渲染和AI推理同時執行。
超薄智慧型手機設計中的熱限制
目前旗艦智慧型手機的厚度為7-8毫米,因此廠商可能會停用GPU的一個運算單元或降低運作頻率,以將溫度控制在43 度C以下。三星的混合像素合併控制技術增加了電源管理積體電路的成本,但如果沒有這項技術,遊戲運行10分鐘後影格速率就會驟降。高通為折疊式設備開發了一款7核心Adreno處理器,功耗降低了約12%。均熱板散熱會使每台設備的成本增加3-5美元,從而擠壓價格敏感型市場的利潤空間。
細分市場分析
到2025年,智慧型手機將佔據行動GPU市場91.55%的佔有率,鞏固其作為超過50億用戶主要螢幕的地位。旗艦機型每年更新一次,中階機型每兩年更新一次,這種頻繁的更新周期持續推動著圖形性能的穩步提升,以支援120Hz OLED面板和即時射線追蹤的發展。平板電腦是成長最快的細分市場,預計從2026年到2031年將以13.47%的複合年成長率成長,這主要得益於企業對多顯示器二合一裝置的青睞。微軟第11代Surface Pro將Adreno GPU與45 TOPS NPU結合,實現了在兩台外接4K顯示器上進行AI字幕顯示,這標誌著平板電腦正從單純的內容消費工具演變為工作站。
預計智慧型手機細分市場將繼續主導行動GPU市場,到2025年,高通、聯發科和蘋果的SoC出貨量將超過12億顆。然而,搭載驍龍X Elite處理器的商用平板電腦正在縮小與輕薄筆記型電腦的效能差距,為現場工程師和創新自由工作者提供工作站級別的圖形處理能力。配備M4晶片的蘋果iPad Air擁有9核心GPU,其3D場景渲染速度是M1的四倍,凸顯了手持終端機和筆記型電腦運算能力的融合趨勢。
區域分析
預計到2025年,亞太地區將佔據行動GPU市場68.33%的佔有率,並在2026年至2031年間以13.79%的複合年成長率成長。在新增8,700萬智慧型手機用戶和全國範圍內的5G網路部署的推動下,印度線上遊戲收入預計到2028年將有所成長。中國仍然是部署量最大的市場,但由於監管限制,其成長速度正在放緩。中國半導體製造商紫光展銳正透過其基於Mali架構的SoC晶片,在非洲和東南亞市場拓展其目標行動GPU市場,這些晶片適用於超低成本智慧型手機。
在北美和歐洲,整合射線追蹤技術和40 TOPS以上NPU的高階設備正在推動市場發展。微軟以搭載驍龍X Elite處理器的筆記型電腦進軍企業市場,也顯示該地區對生產力型GPU的需求旺盛。美國工業與安全局(BIS)的出口限制阻礙了中國企業取得尖端GPU IP,進一步加劇了供應鏈的兩極化:西方消費者可以使用最新的架構,而中國品牌卻被迫依賴老舊的Mali核心。
南美洲、中東和非洲地區均呈現成長態勢。隨著巴西Pix支付基礎設施的快速擴張和價格親民的4G智慧型手機的普及,預計到2028年,南美洲的遊戲收入將達到70億美元。波灣合作理事會成員國對電子競技場館的投資不斷增加,推動了對高階智慧型手機的需求。然而,由於這些地區的購買力低於全球平均水平,中階晶片可能仍將佔據主導地位。
其他好處:
- Excel格式的市場預測(ME)表
- 3個月的分析師支持
目錄
第1章:引言
- 研究假設和市場定義
- 調查範圍
第2章:調查方法
第3章執行摘要
第4章 市場狀況
- 市場概覽
- 市場促進因素
- 行動遊戲對圖形效能的需求日益成長
- 行動GPU中AI加速器的應用
- 透過 5G 部署實現高頻寬圖形串流傳輸
- 折疊式設備的成長需要提高 GPU 效率。
- 射線追蹤功能的主流化
- Vulkan 和 Metal API 的開發者正在擴大採用它們。
- 市場限制因素
- 超薄智慧型手機設計中的熱限制
- 智慧型手機平均售價 (ASP) 的上漲抑制了 GPU 的物料清單 (BOM) 成本。
- 對先進半導體智慧財產權的出口限制
- 智慧財產權授權人的專利訴訟風險
- 宏觀經濟因素對市場的影響
- 產業價值鏈分析
- 監理情勢
- 技術展望
- 波特五力分析
- 價格分析
第5章 市場規模與成長預測
- 依設備類型
- 智慧型手機
- 藥片
- 更多價格範圍
- 入門級設備(200 美元以下)
- 中階設備(200-600 美元)
- 高階設備(600 美元或以上)
- 最終用戶
- 一般消費者
- 企業/商業
- 按地區
- 北美洲
- 美國
- 加拿大
- 墨西哥
- 歐洲
- 德國
- 英國
- 法國
- 其他歐洲國家
- 亞太地區
- 中國
- 日本
- 韓國
- 印度
- 其他亞太國家
- 南美洲
- 中東和非洲
- 北美洲
第6章 競爭情勢
- 市場集中度
- 策略趨勢
- 市佔率分析
- 公司簡介
- Apple Inc.
- Qualcomm Technologies, Inc.
- Arm Ltd.
- Imagination Technologies Ltd.
- Samsung Electronics Co., Ltd.
- MediaTek Inc.
- Advanced Micro Devices, Inc.
- Nvidia Corporation
- Huawei Technologies Co., Ltd.(HiSilicon)
- UNISOC(Shanghai)Technologies Co., Ltd.
- VeriSilicon Holdings Co., Ltd.
- Vivante Corporation(Cadence Design Systems, Inc.)
- Silicon Integrated Systems Corp.
- Google LLC
- Oppo Guangdong Mobile Communications Co., Ltd.(MariSilicon)
- Xiaomi Corporation
第7章 市場機會與未來展望
According to Mordor Intelligence, the mobile gPU market size is projected to expand from USD 38.45 billion in 2025 and USD 42.68 billion in 2026 to USD 77.93 billion by 2031, registering a CAGR of 12.8% between 2026 and 2031.
This report is Segmented by Device Type (Smartphones and Tablets), Device Price Tier (Entry-Level Devices Less Than USD 200, Mid-Range Devices USD 200 To USD 600, and More), End-User Segment (Consumer, and Enterprise), and Geography (North America, Europe, Asia-Pacific, and More). The Market Forecasts are Provided in Terms of Value (USD).
Global Mobile GPU Market Trends and Insights
Increasing Demand for Mobile Gaming Graphics Performance
Mobile gaming revenue increased in 2024, and rising session times are pressuring handset makers to deliver sustained 60 frames-per-second play without thermal throttling. MediaTek's Dimensity 9500, released in September 2025, employs the Mali-G1 Ultra GPU to boost ray-tracing throughput by 119%, allowing real-time global illumination in titles such as Genshin Impact. Strategy and role-playing install growth was in the double digits, and these genres rely on complex shader pipelines, which in turn persuade original equipment manufacturers to allocate more die area to graphics blocks. As publishers shift from hyper-casual toward hybrid-casual designs with 5-to-30-minute sessions, demand for mid-range devices that can stay within temperature limits is accelerating.
Adoption of AI Accelerators Within Mobile GPUs
SoCs now integrate neural processing units capable of 40-48 tera-operations per second, enabling night-mode photography, live translation, and generative AI effects entirely on the device. Qualcomm's Snapdragon 8 Elite Gen 5 pairs the Adreno 840 GPU with a 45-TOPS Hexagon NPU to quadruple dynamic range in imaging pipelines. Microsoft's Surface Pro 11th Edition leverages the same silicon to drive two external 4K monitors while running on-device summarization features for hybrid workforces. As designers co-locate tensor engines within GPU clusters, shared caches reduce memory contention and allow simultaneous graphics rendering and AI inference.
Thermal Constraints in Ultra-Slim Smartphone Designs
Flagship handsets are now 7-8 mm thick, so vendors sometimes disable one GPU compute unit or lower frequencies to avoid exceeding 43 °C. Samsung's hybrid pixel-binning control adds cost to the power-management integrated circuit, but without it, frame rates would collapse during ten-minute gaming sessions. Qualcomm created a seven-core Adreno variant for foldables, cutting power draw by roughly 12%. Vapor-chamber cooling adds USD 3-5 per device, squeezing margins in price-sensitive segments.
Other drivers and restraints analyzed in the detailed report include:
- Rollout of 5G Enabling High-Bandwidth Graphics Streaming
- Growth of Foldable Devices Requiring Enhanced GPU Efficiency
- Rising Smartphone ASP Pressure Limiting GPU BOM Cost
For complete list of drivers and restraints, kindly check the Table Of Contents.
Segment Analysis
Smartphones held 91.55% of the Mobile GPU market in 2025, confirming their role as the primary screen for more than 5 billion users. Multiple refresh cadences, annual for flagships, biennial for mid-tiers, sustain a steady need for incremental graphics gains that power 120 Hz OLED panels and real-time ray tracing. Tablets represent the fastest-growing slice, posting a 13.47% CAGR between 2026 and 2031 as enterprises favor 2-in-1 devices with multi-monitor support. Microsoft's Surface Pro 11th Edition couples an Adreno GPU with a 45-TOPS NPU, enabling AI captioning across two external 4K displays, evidence that tablets are graduating from consumption to workstation roles.
The smartphone sub-segment will continue to account for the bulk of the Mobile GPU market, as Qualcomm, MediaTek, and Apple shipped more than 1.2 billion SoCs in 2025. Yet commercial tablets equipped with Snapdragon X Elite are closing the performance gap with thin laptops, bringing workstation-class graphics to field technicians and creative freelancers. Apple's iPad Air with the M4 chip integrates a nine-core GPU that renders 3D scenes four times faster than the M1, underscoring the convergence of handheld and notebook compute.
Geography Analysis
Asia-Pacific accounted for 68.33% of the Mobile GPU market in 2025 and is set to grow at a 13.79% CAGR over 2026-2031. India's online gaming revenue is projected to climb by 2028, helped by 87 million additional smartphone users and nationwide 5G rollouts. China remains the largest market by installed base, though regulatory constraints are moderating its growth. Chinese chipmaker UNISOC has seized share in Africa and Southeast Asia with Mali-equipped SoCs that fit ultra-budget phones, broadening the addressable Mobile GPU market.
North America and Europe are driven by premium handsets that integrate ray tracing and 40-plus TOPS NPUs. Microsoft's enterprise push with Snapdragon X Elite laptops illustrates regional appetite for productivity-class GPUs. U.S. Bureau of Industry and Security export controls have restricted Chinese access to leading-edge GPU IP, reinforcing a bifurcated supply chain where Western consumers receive the latest architectures while Chinese brands fall back on earlier Mali cores.
South America, the Middle East, and Africa are seeing growth. Brazil's fast-growing Pix payment rails and affordable 4G handsets are helping South America's gaming revenue rise toward USD 7 billion by 2028. Gulf Cooperation Council countries are investing in esports arenas, boosting demand for high-end handsets. Nonetheless, mid-range silicon will remain dominant in these regions because purchasing power lags the global average.
- Apple Inc.
- Qualcomm Technologies, Inc.
- Arm Ltd.
- Imagination Technologies Ltd.
- Samsung Electronics Co., Ltd.
- MediaTek Inc.
- Advanced Micro Devices, Inc.
- Nvidia Corporation
- Huawei Technologies Co., Ltd. (HiSilicon)
- UNISOC (Shanghai) Technologies Co., Ltd.
- VeriSilicon Holdings Co., Ltd.
- Vivante Corporation (Cadence Design Systems, Inc.)
- Silicon Integrated Systems Corp.
- Google LLC
- Oppo Guangdong Mobile Communications Co., Ltd. (MariSilicon)
- Xiaomi Corporation
Additional Benefits:
- The market estimate (ME) sheet in Excel format
- 3 months of analyst support
TABLE OF CONTENTS
1 INTRODUCTION
- 1.1 Study Assumptions and Market Definition
- 1.2 Scope of the Study
2 RESEARCH METHODOLOGY
3 EXECUTIVE SUMMARY
4 MARKET LANDSCAPE
- 4.1 Market Overview
- 4.2 Market Drivers
- 4.2.1 Increasing Demand for Mobile Gaming Graphics Performance
- 4.2.2 Adoption of AI Accelerators Within Mobile GPUs
- 4.2.3 Rollout of 5G Enabling High-Bandwidth Graphics Streaming
- 4.2.4 Growth of Foldable Devices Requiring Enhanced GPU Efficiency
- 4.2.5 Mainstream Integration of Ray Tracing Capabilities
- 4.2.6 Rising Developer Adoption of Vulkan and Metal APIs
- 4.3 Market Restraints
- 4.3.1 Thermal Constraints in Ultra-Slim Smartphone Designs
- 4.3.2 Rising Smartphone ASP Pressure Limiting GPU BOM Cost
- 4.3.3 Export Controls on Advanced Semiconductor IP
- 4.3.4 Patent Litigation Risks Among IP Licensors
- 4.4 Impact of Macroeconomic Factors on the Market
- 4.5 Industry Value-Chain Analysis
- 4.6 Regulatory Landscape
- 4.7 Technological Outlook
- 4.8 Porter's Five Forces Analysis
- 4.8.1 Threat of New Entrants
- 4.8.2 Bargaining Power of Buyers
- 4.8.3 Bargaining Power of Suppliers
- 4.8.4 Threat of Substitute Products
- 4.8.5 Intensity of Competitive Rivalry
- 4.9 Pricing Analysis
5 MARKET SIZE AND GROWTH FORECASTS (VALUE)
- 5.1 By Device Type
- 5.1.1 Smartphones
- 5.1.2 Tablets
- 5.2 By Device Price Tier
- 5.2.1 Entry-Level Devices (Less Than USD 200)
- 5.2.2 Mid-Range Devices (USD 200-USD 600)
- 5.2.3 Premium Devices (Greater Than USD 600)
- 5.3 By End-User Segment
- 5.3.1 Consumer
- 5.3.2 Enterprise / Commercial
- 5.4 By Geography
- 5.4.1 North America
- 5.4.1.1 United States
- 5.4.1.2 Canada
- 5.4.1.3 Mexico
- 5.4.2 Europe
- 5.4.2.1 Germany
- 5.4.2.2 United Kingdom
- 5.4.2.3 France
- 5.4.2.4 Rest of Europe
- 5.4.3 Asia-Pacific
- 5.4.3.1 China
- 5.4.3.2 Japan
- 5.4.3.3 South Korea
- 5.4.3.4 India
- 5.4.3.5 Rest of Asia-Pacific
- 5.4.4 South America
- 5.4.5 Middle East and Africa
- 5.4.1 North America
6 COMPETITIVE LANDSCAPE
- 6.1 Market Concentration
- 6.2 Strategic Moves
- 6.3 Market Share Analysis
- 6.4 Company Profiles (includes Global Level Overview, Market Level Overview, Core Segments, Financials as available, Strategic Information, Market Rank/Share, Products and Services, Recent Developments)
- 6.4.1 Apple Inc.
- 6.4.2 Qualcomm Technologies, Inc.
- 6.4.3 Arm Ltd.
- 6.4.4 Imagination Technologies Ltd.
- 6.4.5 Samsung Electronics Co., Ltd.
- 6.4.6 MediaTek Inc.
- 6.4.7 Advanced Micro Devices, Inc.
- 6.4.8 Nvidia Corporation
- 6.4.9 Huawei Technologies Co., Ltd. (HiSilicon)
- 6.4.10 UNISOC (Shanghai) Technologies Co., Ltd.
- 6.4.11 VeriSilicon Holdings Co., Ltd.
- 6.4.12 Vivante Corporation (Cadence Design Systems, Inc.)
- 6.4.13 Silicon Integrated Systems Corp.
- 6.4.14 Google LLC
- 6.4.15 Oppo Guangdong Mobile Communications Co., Ltd. (MariSilicon)
- 6.4.16 Xiaomi Corporation
7 MARKET OPPORTUNITIES AND FUTURE OUTLOOK
- 7.1 White-Space and Unmet-Need Assessment
 圖形處理器 (GPU) 市場預測至 2034 年——按 GPU 類型、部署模式、記憶體類型、裝置類型、功能、應用程式、最終用戶和地區分類的全球分析
 東南亞GPU市場:市場佔有率分析、產業趨勢與統計及成長預測(2026-2031年)超大規模資料中心GPU:市場佔有率分析、產業趨勢與統計及成長預測(2026-2031年)亞太地區整合GPU:市場佔有率分析、產業趨勢與統計及成長預測(2026-2031年)歐洲整合顯示卡市場:市場佔有率分析、產業趨勢與統計及成長預測(2026-2031 年)北美整合顯示卡:市場佔有率分析、產業趨勢與統計及成長預測(2026-2031 年)印度GPU市場:市場佔有率分析、產業趨勢與統計及成長預測(2026-2031年)德國GPU市場:市場佔有率分析、產業趨勢與統計及成長預測(2026-2031年)日本GPU市場:市佔率分析、產業趨勢與統計及成長預測(2026-2031年)美國GPU市場:市佔率分析、產業趨勢與統計及成長預測(2026-2031年)