


 |
市場調查報告書
商品編碼
1885889
非基因改造蛋白水解物市場機會、成長促進因素、產業趨勢分析及預測(2025-2034年)Non-GMO Protein Hydrolysates Market Opportunity, Growth Drivers, Industry Trend Analysis, and Forecast 2025 - 2034 |
||||||
2024 年全球非基因改造蛋白質水解物市值為 4.512 億美元,預計到 2034 年將以 5.2% 的複合年成長率成長至 7.501 億美元。
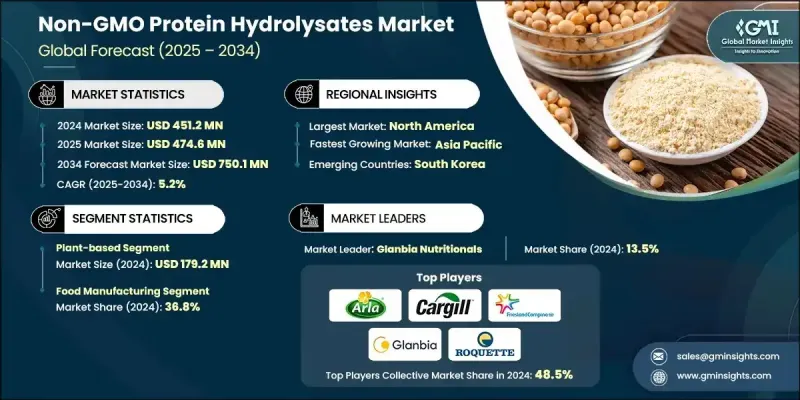
這些水解物源自非基因改造原料,並經過可控水解工藝,以提高其消化率、功能性和與清潔標籤產品標準的兼容性。消費者對天然和非基因改造配方的日益關注,推動了食品飲料、運動營養和膳食補充劑等領域的需求成長。北美是最大的區域市場,這得益於其嚴格的成分監管和完善的生產體系,能夠生產優質水解物。同時,亞太地區繼續保持最快的成長速度,這得益於快速的城市化進程、可支配收入的提高以及對食品安全和農業永續性的日益重視。印度和中國等國的政府措施進一步增強了消費者對非基因改造蛋白質成分的信任。食物不耐症和過敏症的增加也促使生產商優先考慮低過敏性和易消化的替代品,而這些替代品很大程度上依賴非基因改造水解物。在運動和積極生活方式營養領域,消費者對非基因改造水解物的需求尤其顯著,他們始終在尋找能夠提供性能提升且不含合成或基因改造成分的原料。
| 市場範圍 | |
|---|---|
| 起始年份 | 2024 |
| 預測年份 | 2025-2034 |
| 起始值 | 4.512億美元 |
| 預測值 | 7.501億美元 |
| 複合年成長率 | 5.2% |
2024年,植物性食品市場規模達1.792億美元,反映消費者對永續來源、非基因改造蛋白質原料的強勁需求。消費者越來越傾向於選擇天然且成分透明的產品,因此他們更青睞符合道德規範和清潔標籤理念的植物水解物。
2024 年,食品製造業佔了 36.8% 的市場。該行業受益於水解物作為功能性成分的日益廣泛應用,這些成分可以增強食品的質地、營養價值和風味,同時滿足包裝食品中對無過敏原和天然成分日益成長的需求。
預計2025年至2034年間,北美非基因改造蛋白水解物市場將以5.3%的複合年成長率成長。在消費者意識不斷增強以及對清潔標籤、低致敏性產品的偏好日益成長的推動下,該地區持續將這些水解物應用於功能性食品、特殊營養品和膳食補充劑產品中。酶水解技術和永續萃取方法的進步正在生產出更高品質的生物活性成分,以滿足不斷變化的健康趨勢。
非基因改造蛋白水解物市場的領導企業包括嘉吉公司 (Cargill Inc.)、泰坦生物科技 (Titan Biotech)、格蘭比亞營養品公司 (Glanbia Nutritionals)、洛克特兄弟公司 (Roquette Freres)、柴坦尼亞農業生物科技私人有限公司 (Chaitanya Agro Biotech Pvt. Ltd.)、新香蘭肯巴香料公司 (Flavland), Flavers Ltd. Fragrances Inc.)、卡伯里公司 (Carbery)、塔圖亞合作乳業有限公司 (Tatua Co-operative Dairy Company Limited) 和阿拉食品配料集團 (Arla Foods Ingredients Group)。這些公司正透過拓展產品線來增強其競爭優勢,這些產品線主打清潔標籤、低致敏性和永續來源的水解物,並針對食品、膳食補充劑和醫療營養應用進行客製化。許多公司正在投資先進的酵素加工技術,以改善風味、溶解度和生物活性胜肽譜,從而實現更高價值的配方。與食品製造商和健康品牌的策略合作正在幫助這些公司建立長期的供應夥伴關係。此外,這些公司也強調嚴格的品質認證和透明的採購流程,以增強消費者對非基因改造成分的信任。
目錄
第1章:方法論與範圍
第2章:執行概要
第3章:行業洞察
- 產業生態系分析
- 供應商格局
- 利潤率
- 每個階段的價值增加
- 影響價值鏈的因素
- 中斷
- 產業影響因素
- 成長促進因素
- 消費者對清潔標籤和非基因改造產品的需求不斷成長
- 食物過敏和不耐症的盛行率不斷上升
- 運動營養和積極生活方式市場不斷成長
- 產業陷阱與挑戰
- 生產成本高昂,定價較高
- 非基因改造原料供應有限
- 市場機遇
- 動物飼料應用領域的拓展
- 個人化營養領域的新興應用
- 成長促進因素
- 成長潛力分析
- 監管環境
- 北美洲
- 歐洲
- 亞太地區
- 拉丁美洲
- 中東和非洲
- 波特的分析
- PESTEL 分析
- 技術與創新格局
- 當前技術趨勢
- 新興技術
- 價格趨勢
- 按地區
- 來源
- 未來市場趨勢
- 專利格局
- 貿易統計(HS編碼)(註:僅提供重點國家的貿易統計資料)
- 主要進口國
- 主要出口國
- 永續性和環境方面
- 永續實踐
- 減少廢棄物策略
- 生產中的能源效率
- 環保舉措
- 碳足跡考量
第4章:競爭格局
- 介紹
- 公司市佔率分析
- 按地區
- 北美洲
- 歐洲
- 亞太地區
- 拉丁美洲
- MEA
- 按地區
- 公司矩陣分析
- 主要市場參與者的競爭分析
- 競爭定位矩陣
- 關鍵進展
- 併購
- 合作夥伴關係與合作
- 新產品發布
- 擴張計劃
第5章:市場估算與預測:依來源分類,2021-2034年
- 主要趨勢
- 植物性
- 豌豆蛋白水解物
- 大豆蛋白水解物
- 米蛋白水解物
- 小麥/麩質水解物
- 動物性
- 乳蛋白水解物(乳清蛋白、酪蛋白)
- 肉類蛋白水解物
- 蛋清蛋白水解物
- 海洋
- 魚蛋白水解物
- 膠原蛋白水解物
- 其他
第6章:市場估算與預測:依應用領域分類,2021-2034年
- 主要趨勢
- 治療和醫療應用
- 嬰幼兒營養
- 成人臨床營養
- 特殊醫學用途食品
- 消費者營養與健康應用
- 運動與表現營養
- 整體健康與保健
- 食品製造應用
- 加工食品原料
- 飲料原料
- 增強風味和質地
- 動物營養應用
- 伴侶動物飼料
- 牲畜飼料
- 水產飼料
- 其他
第7章:市場估計與預測:依地區分類,2021-2034年
- 主要趨勢
- 北美洲
- 美國
- 加拿大
- 歐洲
- 德國
- 英國
- 法國
- 西班牙
- 義大利
- 歐洲其他地區
- 亞太地區
- 中國
- 印度
- 日本
- 澳洲
- 韓國
- 亞太其他地區
- 拉丁美洲
- 巴西
- 墨西哥
- 阿根廷
- 拉丁美洲其他地區
- 中東和非洲
- 沙烏地阿拉伯
- 南非
- 阿拉伯聯合大公國
- 中東和非洲其他地區
第8章:公司簡介
- Arla Foods Ingredients Group
- Carbery
- Cargill Inc.
- Chaitanya Agro Biotech Pvt. Ltd.
- FrieslandCampina
- Glanbia Nutritionals
- International Flavors & Fragrances Inc
- Roquette Freres
- Tatua Co-operative Dairy Company Limited
- Titan Biotech
The Global Non-GMO Protein Hydrolysates Market was valued at USD 451.2 million in 2024 and is estimated to grow at a CAGR of 5.2% to reach USD 750.1 million by 2034.
These hydrolysates are produced from non-genetically modified sources and undergo controlled hydrolysis to enhance digestibility, functionality, and compatibility with clean-label product standards. Rising interest in natural and non-GMO formulations is strengthening demand across food and beverage applications, sports nutrition, and dietary supplements. North America represents the largest regional market due to strict ingredient regulations and a well-developed manufacturing framework capable of producing premium-grade hydrolysates. Meanwhile, Asia Pacific continues to grow at the fastest pace, supported by rapid urbanization, higher disposable incomes, and increased focus on food safety and agricultural sustainability. Government measures across countries such as India and China further reinforce consumer trust in non-GMO protein ingredients. The rise in food intolerances and allergies is also influencing producers to prioritize hypoallergenic and easily digestible alternatives, which rely heavily on non-GMO hydrolysates. Interest is especially notable in sports and active lifestyle nutrition, where shoppers consistently seek ingredients that deliver performance benefits without synthetic or genetically modified components.
| Market Scope | |
|---|---|
| Start Year | 2024 |
| Forecast Year | 2025-2034 |
| Start Value | $451.2 Million |
| Forecast Value | $750.1 Million |
| CAGR | 5.2% |
The plant-based category generated USD 179.2 million in 2024, reflecting strong demand for sustainably sourced, GMO-free protein inputs. Growing preference for natural and transparent ingredient lists has led consumers to favor plant-derived hydrolysates that align with ethical and clean-label expectations.
The food manufacturing segment held a 36.8% share in 2024. This segment benefits from increasing use of hydrolysates as functional components that enhance texture, nutritional value, and flavor while meeting rising demand for allergen-friendly and natural ingredients in packaged foods.
North America Non-GMO Protein Hydrolysates Market is projected to grow at a 5.3% CAGR between 2025 and 2034. The region continues to adopt these hydrolysates in functional foods, specialized nutrition, and supplement products, driven by strong consumer awareness and rising preference for clean-label, allergen-conscious options. Advances in enzymatic hydrolysis and sustainable extraction methods are producing higher-quality bioactive ingredients suited to evolving wellness trends.
Leading companies in the Non-GMO Protein Hydrolysates Market include Cargill Inc., Titan Biotech, Glanbia Nutritionals, Roquette Freres, Chaitanya Agro Biotech Pvt. Ltd., FrieslandCampina, International Flavors & Fragrances Inc., Carbery, Tatua Co-operative Dairy Company Limited, and Arla Foods Ingredients Group. Companies are strengthening their competitive position by expanding product lines that feature clean-label, allergen-friendly, and sustainably sourced hydrolysates tailored to food, supplement, and medical nutrition applications. Many firms are investing in advanced enzymatic processing technologies to improve flavor, solubility, and bioactive peptide profiles, enabling higher-value formulations. Strategic collaborations with food manufacturers and wellness brands are helping companies secure long-term supply partnerships. Firms are also emphasizing rigorous quality certification and transparent sourcing practices to reinforce consumer trust in non-GMO ingredients.
Table of Contents
Chapter 1 Methodology & Scope
- 1.1 Market scope and definition
- 1.2 Research design
- 1.2.1 Research approach
- 1.2.2 Data collection methods
- 1.3 Data mining sources
- 1.3.1 Global
- 1.3.2 Regional/Country
- 1.4 Base estimates and calculations
- 1.4.1 Base year calculation
- 1.4.2 Key trends for market estimation
- 1.5 Primary research and validation
- 1.5.1 Primary sources
- 1.6 Forecast model
- 1.7 Research assumptions and limitations
Chapter 2 Executive Summary
- 2.1 Industry 3600 synopsis
- 2.2 Key market trends
- 2.2.1 Source trends
- 2.2.2 Application trends
- 2.2.3 Regional trends
- 2.3 TAM Analysis, 2025-2034
- 2.4 CXO perspectives: strategic imperatives
- 2.4.1 Executive decision points
- 2.4.2 Critical success factors
- 2.5 Future outlook and strategic recommendations
Chapter 3 Industry Insights
- 3.1 Industry ecosystem analysis
- 3.1.1 Supplier landscape
- 3.1.2 Profit margin
- 3.1.3 Value addition at each stage
- 3.1.4 Factor affecting the value chain
- 3.1.5 Disruptions
- 3.2 Industry impact forces
- 3.2.1 Growth drivers
- 3.2.1.1 Rising consumer demand for clean-label & non-GMO products
- 3.2.1.2 Increasing prevalence of food allergies & intolerances
- 3.2.1.3 Growing sports nutrition & active lifestyle market
- 3.2.2 Industry pitfalls and challenges
- 3.2.2.1 High production costs & premium pricing
- 3.2.2.2 Limited raw material availability for non-GMO sources
- 3.2.3 Market opportunities
- 3.2.3.1 Expansion in animal feed applications
- 3.2.3.2 Emerging applications in personalized nutrition
- 3.2.1 Growth drivers
- 3.3 Growth potential analysis
- 3.4 Regulatory landscape
- 3.4.1 North America
- 3.4.2 Europe
- 3.4.3 Asia Pacific
- 3.4.4 Latin America
- 3.4.5 Middle East & Africa
- 3.5 Porter's analysis
- 3.6 PESTEL analysis
- 3.7 Technology and Innovation landscape
- 3.7.1 Current technological trends
- 3.7.2 Emerging technologies
- 3.8 Price trends
- 3.8.1 By region
- 3.8.2 By source
- 3.9 Future market trends
- 3.10 Patent landscape
- 3.11 Trade statistics (HS code) ( Note: the trade statistics will be provided for key countries only)
- 3.11.1 Major importing countries
- 3.11.2 Major exporting countries
- 3.12 Sustainability and environmental aspects
- 3.12.1 Sustainable practices
- 3.12.2 Waste reduction strategies
- 3.12.3 Energy efficiency in production
- 3.12.4 Eco-friendly initiatives
- 3.13 Carbon footprint consideration
Chapter 4 Competitive Landscape, 2024
- 4.1 Introduction
- 4.2 Company market share analysis
- 4.2.1 By region
- 4.2.1.1 North America
- 4.2.1.2 Europe
- 4.2.1.3 Asia Pacific
- 4.2.1.4 LATAM
- 4.2.1.5 MEA
- 4.2.1 By region
- 4.3 Company matrix analysis
- 4.4 Competitive analysis of major market players
- 4.5 Competitive positioning matrix
- 4.6 Key developments
- 4.6.1 Mergers & acquisitions
- 4.6.2 Partnerships & collaborations
- 4.6.3 New product launches
- 4.6.4 Expansion plans
Chapter 5 Market Estimates and Forecast, By Source, 2021-2034 (USD Million) (Kilo Tons)
- 5.1 Key trends
- 5.2 Plant-based
- 5.2.1 Pea protein hydrolysates
- 5.2.2 Soy protein hydrolysates
- 5.2.3 Rice protein hydrolysates
- 5.2.4 Wheat/gluten hydrolysates
- 5.3 Animal-based
- 5.3.1 Milk protein hydrolysates (whey, casein)
- 5.3.2 Meat protein hydrolysates
- 5.3.3 Egg protein hydrolysates
- 5.4 Marine-based
- 5.4.1 Fish protein hydrolysates
- 5.4.2 Collagen hydrolysates
- 5.5 Others
Chapter 6 Market Estimates and Forecast, By Application, 2021-2034 (USD Million) (Kilo Tons)
- 6.1 Key trends
- 6.2 Therapeutic & medical applications
- 6.2.1 Infant & pediatric nutrition
- 6.2.2 Adult clinical nutrition
- 6.2.3 Foods for special medical purposes
- 6.3 Consumer nutrition & wellness applications
- 6.3.1 Sports & performance nutrition
- 6.3.2 General health & wellness
- 6.4 Food manufacturing applications
- 6.4.1 Processed food ingredients
- 6.4.2 Beverage ingredients
- 6.4.3 Flavor & texture enhancement
- 6.5 Animal nutrition applications
- 6.5.1 Companion animal feed
- 6.5.2 Livestock feed
- 6.5.3 Aquaculture feed
- 6.6 Others
Chapter 7 Market Estimates and Forecast, By Region, 2021-2034 (USD Billion) (Kilo Tons)
- 7.1 Key trends
- 7.2 North America
- 7.2.1 U.S.
- 7.2.2 Canada
- 7.3 Europe
- 7.3.1 Germany
- 7.3.2 UK
- 7.3.3 France
- 7.3.4 Spain
- 7.3.5 Italy
- 7.3.6 Rest of Europe
- 7.4 Asia Pacific
- 7.4.1 China
- 7.4.2 India
- 7.4.3 Japan
- 7.4.4 Australia
- 7.4.5 South Korea
- 7.4.6 Rest of Asia Pacific
- 7.5 Latin America
- 7.5.1 Brazil
- 7.5.2 Mexico
- 7.5.3 Argentina
- 7.5.4 Rest of Latin America
- 7.6 Middle East and Africa
- 7.6.1 Saudi Arabia
- 7.6.2 South Africa
- 7.6.3 UAE
- 7.6.4 Rest of Middle East and Africa
Chapter 8 Company Profiles
- 8.1 Arla Foods Ingredients Group
- 8.2 Carbery
- 8.3 Cargill Inc.
- 8.4 Chaitanya Agro Biotech Pvt. Ltd.
- 8.5 FrieslandCampina
- 8.6 Glanbia Nutritionals
- 8.7 International Flavors & Fragrances Inc
- 8.8 Roquette Freres
- 8.9 Tatua Co-operative Dairy Company Limited
- 8.10 Titan Biotech
 蛋白質水解物市場規模、佔有率及成長分析(依產品類型、形態類型、應用類型及地區分類)-2026-2033年產業預測
 全球蛋白質水解物市場規模、佔有率、趨勢和成長分析報告(2026-2034)
 有機蛋白水解物市場機會、成長促進因素、產業趨勢分析及預測(2025-2034年)單細胞蛋白水解物市場機會、成長促進因素、產業趨勢分析及預測(2025-2034年)精準發酵法製備蛋白水解物市場機會、成長促進因素、產業趨勢分析及預測(2025-2034年)老年營養蛋白水解物市場機會、成長促進因素、產業趨勢分析及預測(2025-2034年)下一代蛋白質水解物市場機會、成長促進因素、產業趨勢分析及預測(2025-2034)
 蛋白質水解物市場-全球產業規模、佔有率、趨勢、機會和預測,按類型、來源、形態、製程、應用、地區和競爭格局分類,2020-2030年預測食品廢棄物衍生蛋白水解物市場機會、成長促進因素、產業趨勢分析及預測(2025-2034年)噴霧乾燥蛋白水解物市場機會、成長促進因素、產業趨勢分析及預測(2025-2034年)