


 |
市場調查報告書
商品編碼
2125381
美國IT服務:市場佔有率分析、產業趨勢與統計、成長預測(2026-2031年)United States IT Services - Market Share Analysis, Industry Trends & Statistics, Growth Forecasts (2026 - 2031) |
||||||

※ 本網頁內容可能與最新版本有所差異。詳細情況請與我們聯繫。
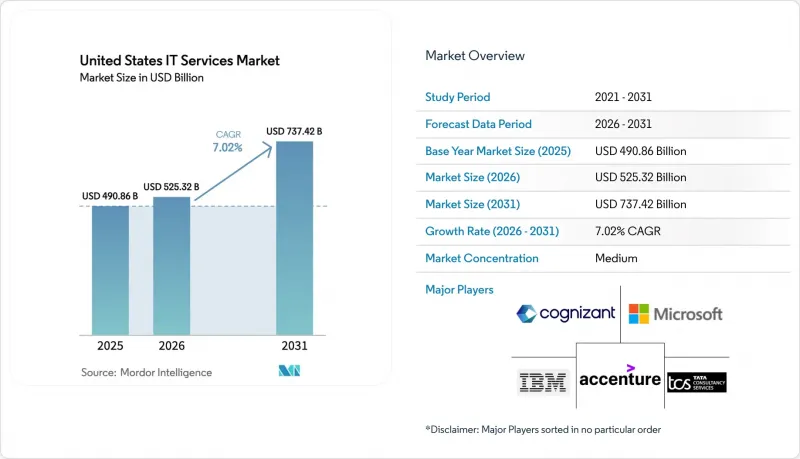
據 Mordor Intelligence 稱,2025 年美國 IT 服務市值為 4908.6 億美元,預計到 2031 年將達到 7374.2 億美元,而 2026 年為 5253.2 億美元,預測期(2026-2031 年)的複合年成長率為 7.02%。
本報告按服務類型(IT諮詢與實施、其他)、部署模式(境內、近岸、離岸)、合約模式(企劃為基礎、人員配備、託管服務)、組織規模(大型企業、中小企業)和最終用戶行業(銀行、金融服務和保險、製造業、政府機構、其他)進行細分。市場預測以美元計價。
美國IT服務市場的趨勢與洞察
美國聯邦政府獎勵加速公共部門雲端遷移
2026年,聯邦機構從技術現代化基金獲得了10.5億美元的撥款。這一快速成長推動了對能夠大規模重構大型主機工作負載的一級整合商的需求,因為資金正被投入到淘汰舊有系統和採用符合FedRAMP標準的雲端解決方案中。雖然各機構已遷移了67%的目標系統,但剩餘的系統包含封裝器和客製化中間件以確保資料主權,這進一步擴大了擁有安全許可人員的供應商的營運優勢。價值90億美元的聯合作戰雲端能力合約規定,中小企業的轉包率必須達到35%,這進一步分散了交付結構,並增加了專案管理的複雜性。州和地方政府正爭分奪秒地執行《基礎設施投資和就業法案》(IIJA)的津貼,以趕在2027年到期前完成,這將縮短2025年的採購週期,並使提供基於目錄的解決方案的供應商獲得優勢。網路安全和雲端領域人員嚴重短缺(23,000 個職缺),導致國家首都地區 (NCR) 獲得安全許可的人員的時薪超過 185 美元,並導致專案預算大幅膨脹。
財富 1000 強企業大規模部署生成式人工智慧
2025年1月至2026年1月期間,生成式人工智慧(AI)用例的生產運作數量從412個增加到1847個,其中近三分之二用於內部生產力提升工作流程,而非產生收入。資料品質不足仍然是最大的障礙,71%的首席資料長(CDO)承認缺乏統一的客戶主記錄,這推高了預處理成本。領導企業正在迅速實現商業化,例如摩根大通的合約智慧助理每年可節省36萬小時的審核時間。監管方面的擔憂仍然存在,在聯邦貿易委員會(FTC)於2025年調查了18種AI驅動的定價演算法之後,消費者領域的採用率停滯不前。整合專家目前正在打包搜尋增強型生成式管道、偏差檢測和審計追蹤功能,並透過將實驗性先導計畫轉化為合規、可擴展的解決方案而獲得高額費用。
雲端運算和安全領域高級人才短缺
到2025年,美國雇主將面臨資訊安全領域37.75萬個職位的缺口,增幅高達22%,這將使雲端架構師的薪資中位數達到16.8萬美元。對精英認證的需求遠超過供給,儘管只有4.7萬名專業人士持有AWS解決方案架構師專業認證,但相關職缺卻飆升至11.2萬個。實施零信任環境需要身分架構專家,他們的薪資溢價高達28%,並且正面臨嚴重的人才流失。供應商正在擴大培訓項目,光是Cognizant一家就招收了8,200名應屆畢業生參加為期16週的密集訓練營,但其中34%的人在18個月內離職,因為超大規模資料中心業者公司挖走了這些受訓人才。離岸套利機會正在減少,班加羅爾的高級Java工程師現在的年薪為5.2萬美元,曾經支撐傳統支援模式的成本差距正在縮小。
細分市場分析
2025年,託管服務佔總營收的27.46%,反映企業對可預測營運成本的重視。同時,網路安全保全服務預計到2031年將達到8.42%的複合年成長率。美國IT服務市場佔有率正在整合,主要集中在那些將漏洞保障(通常上限為500萬美元)整合到託管偵測與回應(MDR)服務中的供應商,從而將經濟獎勵與風險降低相結合。應用開發和維護仍然是最大的絕對支出,但隨著低代碼平台使業務用戶能夠快速構建部門應用程式,對客製化Java和.NET開發的需求減少,其成長速度正在放緩。受FinOps管治和多重雲端編配需求成長的推動,雲端和平台服務在2025年成長了11.3%,因為平均每家公司並行運作4.7個雲端平台。基礎設施服務正面臨商品化,迫使供應商將諮詢、遷移和託管營運層捆綁在一起。 IT外包和業務流程外包正日益融合,Genpact計劃在2025年收購一家RPA先導計畫以實現「概念驗證到管治」的模式,便是一個例證。
隨著客戶對結果的需求日益成長,這一趨勢正在加速發展。託管安全服務提供者現在將專家級安全營運中心 (SOC) 分析師和專有的 AI 驅動型威脅情報來源納入多年訂閱費用中,從而將資本支出 (CAPEX) 轉化為營運支出 (OPEX)。同時,傳統的基礎設施合約正在採用雲端的「按需付費」收費,供應商的報酬與工作負載遷移的速度以及遷移後的成本節省掛鉤。應用程式現代化正在從瀑布式模式轉向從一開始就整合 DevSecOps 的敏捷開發團隊,進一步加強業務相關人員和交付團隊之間的反饋循環。在美國 IT 服務市場,那些將垂直行業專業知識與能夠縮短測試週期和減少技術債務的自動化平台相結合的供應商仍然備受青睞。
2025年,受監管行業優先考慮出於合規和協作目的而採用託管服務的推動,在岸交付仍將保持54.63%的市場佔有率,而近岸交付預計將以8.87%的複合年成長率成長。在美墨加協定(USMCA)的保護和41%的人事費用優勢的支撐下,墨西哥對美出口額達到92億美元,促使187家美國公司在蒙特雷和瓜達拉哈拉設立了專屬式服務中心。加拿大的文化親和性和健全的智慧財產權法正在吸引金融服務客戶,多倫多工程師的薪酬比灣區同行低22%。隨著客戶利用重疊的時區縮短迭代週期,與近岸服務中心相關的美國IT服務市場規模正在擴大。
離岸交付仍然是一個重要的市場,但印度和菲律賓不斷上漲的離職率正日益對獲利能力構成挑戰。馬尼拉和宿霧擁有23,000名安全營運中心(SOC)分析師,這些網路安全中心正在蓬勃發展,但地緣政治緊張局勢正促使風險規避型客戶轉向美洲。東歐在GDPR的推動下,合規業務蓬勃發展,但預計到2025年工資將上漲8.2%,加上地區局勢不穩,抵消了其成本優勢。為了平衡成本、速度和人才儲備,服務提供者現在正透過建立全球分散式敏捷團隊來規避服務交付風險。這些團隊將本地產品負責人、近岸Scrum主管和離岸開發人員整合在一起。
其他好處:
- Excel格式的市場預測(ME)表
- 3個月的分析師支持
目錄
第1章:引言
- 研究假設和市場定義
- 調查範圍
第2章:調查方法
第3章執行摘要
第4章 市場狀況
- 市場概覽
- 市場促進因素
- 美國聯邦政府獎勵,加速公共部門向雲端運算遷移
- 財富1000強企業廣泛採用生成式人工智慧
- 5G和邊緣網路的部署正在推動對網路整合的需求。
- 零信任網路安全的強制實施正在推高對保全服務。
- 有關醫療資訊互通性的法規正在推動整合電子健康記錄 (EHR) 服務的發展。
- 透過私募股權投資推動中型企業ERP現代化浪潮
- 市場限制因素
- 雲端運算和安全領域高級人才短缺
- 基於績效的定價模式對利潤率帶來壓力
- CCPA/CPRA訴訟中合規的複雜性
- 海外工資上漲正在削弱成本優勢。
- 產業價值鏈分析
- 監理展望
- 宏觀經濟因素對市場的影響
- 技術展望
- 波特五力分析
- 比較分析-一級供應商與二級供應商
- 內部解決方案與外包解決方案的比較分析
- 投資分析
第5章 市場規模與成長預測
- 按服務類型
- IT諮詢與實施
- 應用開發與維護(ADM)
- 基礎設施服務
- 託管服務
- IT外包(ITO)
- 業務流程外包(BPO)
- 雲端和平台服務
- 保全服務
- 數位轉型與新興技術(人工智慧、物聯網、區塊鏈)
- 按部署模式
- 陸上交付
- 近岸交付
- 離岸交付
- 按合約模式
- 企劃為基礎/固定價格
- 人員增補/工時及材料
- 託管服務/基於結果的服務
- 按組織規模
- 大公司
- 中小企業
- 按最終用戶行業分類
- 銀行、金融服務和保險(BFSI)
- 製造業
- 政府/公共部門
- 醫療保健和生命科學
- 零售和消費品
- 通訊與媒體
- 運輸/物流
- 能源公用事業
- 其他終端用戶產業
第6章 競爭情勢
- 市場集中度
- 策略趨勢
- 市佔率分析
- 公司簡介
- Accenture plc
- IBM Corporation
- Cognizant Technology Solutions Corp.
- Tata Consultancy Services Ltd.
- Microsoft Corporation
- Infosys Ltd.
- Wipro Ltd.
- Deloitte Consulting LLP
- Capgemini SE
- HCL Technologies Ltd.
- CGI Inc.
- DXC Technology Co.
- Booz Allen Hamilton Inc.
- Leidos Holdings Inc.
- Slalom LLC
- EPAM Systems Inc.
- NTT DATA Services
- Kyndryl Holdings Inc.
- LTI Mindtree Ltd.
- Tech Mahindra Ltd.
- Perficient Inc.
- ThoughtWorks Inc.
- Persistent Systems Ltd.
第7章 市場機會與未來展望
According to Mordor Intelligence, the United States IT services market size was valued at USD 490.86 billion in 2025 and is estimated to grow from USD 525.32 billion in 2026 to reach USD 737.42 billion by 2031, at a CAGR of 7.02% during the forecast period (2026-2031).
This report is Segmented by Service Type (IT Consulting and Implementation, and More), Deployment Model (Onshore, Nearshore, and Offshore), Engagement Model (Project-Based, Staff Augmentation, and Managed Services), Organization Size (Large Enterprises, and SMEs), and End-User Industry (BFSI, Manufacturing, Government, and More). The Market Forecasts are Provided in Terms of Value (USD).
United States IT Services Market Trends and Insights
Federal Incentives Accelerating Cloud Migration in United States Public Sector
Federal agencies drew USD 1.05 billion from the Technology Modernization Fund in 2026, a steep rise that channels capital toward legacy-system retirement and FedRAMP cloud deployments, lifting demand for tier-1 integrators that can re-platform mainframe workloads at scale. Agencies have already migrated 67% of eligible systems, but the remaining estate involves data-sovereignty wrappers and custom middleware, widening the execution moat for vendors with cleared talent. The USD 9 billion Joint Warfighting Cloud Capability contract imposes a 35% small-business subcontracting quota, fragmenting delivery and raising program-management complexity. State and local governments, racing to obligate Infrastructure Investment and Jobs Act grants before 2027 expiry, compressed sourcing cycles in 2025, advantaging suppliers with catalog-based solutions. An acute talent deficit23,000 unfilled cyber and cloud positionshas pushed cleared hourly rates above USD 185 in the National Capital Region, inflating project budgets.
Large-Scale Adoption of Generative AI among Fortune 1000
Production deployments of generative-AI use cases climbed from 412 to 1,847 between January 2025 and January 2026, yet nearly two-thirds serve internal productivity workflows, not revenue generation. Data-quality shortcomings remain the chief barrier; 71% of chief data officers confess to lacking unified customer-master records, inflating preprocessing costs. Financial-services leaders are monetizing first, as illustrated by JPMorgan Chase's contract-intelligence assistant that trims 360,000 review hours a year. Regulatory clouds persist, with the Federal Trade Commission probing 18 AI-driven pricing algorithms in 2025, stalling consumer-sector rollouts. Integration specialists now package retrieval-augmented generation pipelines, bias detection, and audit trails, earning premium fees as they translate experimental pilots into compliant, scalable solutions.
Scarcity of Senior Cloud and Security Talent
United States employers faced 377,500 open information-security roles in 2025, a 22% uptick that pushed median cloud-architect salaries to USD 168,000. Demand for elite certifications far outstrips supply; only 47,000 professionals hold AWS Solutions Architect-Professional credentials, yet job postings climbed to 112,000. Zero-trust deployments require identity-fabric specialists who draw 28% wage premiums, intensifying churn. Vendors ramped apprenticeship programsCognizant alone enrolled 8,200 graduates in a 16-week bootcampbut 34% quit within 18 months as hyperscalers poached trained talent. Offshore arbitrage is narrowing, senior Java engineers in Bengaluru now draw USD 52,000, eroding the cost delta that once underpinned traditional support models.
Other drivers and restraints analyzed in the detailed report include:
- 5G and Edge Roll-out Driving Network Integration Demand
- Zero-Trust Cybersecurity Mandates Boosting Security Services
- Margin Pressure from Outcome-Based Pricing Models
For complete list of drivers and restraints, kindly check the Table Of Contents.
Segment Analysis
Managed Services secured 27.46% of 2025 revenue, reflecting enterprise appetite for predictable operating expenses, while Cybersecurity Services is expected to deliver an 8.42% CAGR through 2031. The United States IT Services market share is consolidating around providers that layer breach warranties often capped at USD 5 million to managed detection and response offerings, aligning economic incentives with risk reduction. Application Development and Maintenance still drives the largest absolute spend, although growth slackens as low-code platforms let business users spin up departmental apps, trimming demand for bespoke Java and.NET builds. Cloud and Platform Services expanded 11.3% in 2025 as the average enterprise juggled 4.7 cloud platforms, intensifying demand for FinOps governance and multi-cloud orchestration. Infrastructure Services face commoditization, compelling vendors to bundle advisory, migration, and managed-ops layers. IT Outsourcing and Business Process Outsourcing increasingly converge, illustrated by Genpact's 2025 acquisition of an RPA vendor that now stitches invoice-to-cash automation across IT and finance workstreams. Digital-transformation consulting remains in high demand, yet 57% of emerging-tech pilots stall at proof-of-concept, underscoring data-governance gaps.
Tailwinds extend as clients pursue outcome guarantees. Managed-security providers now price access to specialized SOC analysts and proprietary AI-driven threat-intel feeds within multiyear subscriptions, converting capital spend into OPEX. Conversely, legacy infrastructure deals replicate cloud's pay-as-you-grow model, tying vendor remuneration to workload migration velocity and post-move cost savings. Application modernization is shifting from waterfall to agile pods that integrate DevSecOps from day zero, further tightening feedback loops between business stakeholders and delivery teams. The United States IT Services market continues to reward vendors that meld vertical-domain expertise with automation platforms that shrink test cycles and cut technical debt.
Onshore Delivery retained 54.63% share in 2025, anchored in regulated industries that prize co-location for compliance and collaboration, yet Nearshore Delivery is forecast to expand at an 8.87% CAGR. Mexico's exports hit USD 9.2 billion, aided by USMCA protections and 41% labor discounts, prompting 187 United States enterprises to establish captive centers in Monterrey and Guadalajara. Canada's cultural fit and robust IP laws lure financial-services clients, with Toronto engineers charging 22% less than Bay Area peers. The United States IT Services market size linked to nearshore centers is widening as clients compress sprint cycles by exploiting the same-time-zone overlap.
Offshore Delivery remains large but margin headwinds rise as Indian and Philippine wages climb and attrition nears 20%. Manila and Cebu pitch cybersecurity centers staffed by 23,000 SOC analysts, yet geopolitical tension nudges risk-averse clients toward the Americas. Eastern Europe wins compliance-sensitive work under GDPR, but 8.2% 2025 wage inflation and regional instability moderate its cost appeal. Providers now hedge delivery by architecting globally distributed agile pods, blending onshore product owners, nearshore scrum masters, and offshore developers to balance cost, speed, and talent depth.
Complete Report Scope:
- By Service Type
- IT Consulting and Implementation
- Application Development and Maintenance (ADM)
- Infrastructure Services
- Managed Services
- IT Outsourcing (ITO)
- Business Process Outsourcing (BPO)
- Cloud and Platform Services
- Cybersecurity Services
- Digital Transformation and Emerging Tech (AI, IoT, Blockchain)
- By Deployment Model
- Onshore Delivery
- Nearshore Delivery
- Offshore Delivery
- By Engagement Model
- Project-based / Fixed Price
- Staff Augmentation / Time-and-Material
- Managed Services / Outcome-based
- By Organization Size
- Large Enterprises
- Small and Medium Enterprises (SMEs)
- By End-User Industry
- Banking, Financial Services and Insurance (BFSI)
- Manufacturing
- Government and Public Sector
- Healthcare and Life Sciences
- Retail and Consumer Goods
- Telecom and Media
- Transportation and Logistics
- Energy and Utilities
- Other End-User Industries
List of Companies Covered in this Report:
- Accenture plc
- IBM Corporation
- Cognizant Technology Solutions Corp.
- Tata Consultancy Services Ltd.
- Microsoft Corporation
- Infosys Ltd.
- Wipro Ltd.
- Deloitte Consulting LLP
- Capgemini SE
- HCL Technologies Ltd.
- CGI Inc.
- DXC Technology Co.
- Booz Allen Hamilton Inc.
- Leidos Holdings Inc.
- Slalom LLC
- EPAM Systems Inc.
- NTT DATA Services
- Kyndryl Holdings Inc.
- LTI Mindtree Ltd.
- Tech Mahindra Ltd.
- Perficient Inc.
- ThoughtWorks Inc.
- Persistent Systems Ltd.
Additional Benefits:
- The market estimate (ME) sheet in Excel format
- 3 months of analyst support
TABLE OF CONTENTS
1 INTRODUCTION
- 1.1 Study Assumptions and Market Definition
- 1.2 Scope of the Study
2 RESEARCH METHODOLOGY
3 EXECUTIVE SUMMARY
4 MARKET LANDSCAPE
- 4.1 Market Overview
- 4.2 Market Drivers
- 4.2.1 Federal Incentives Accelerating Cloud Migration in US Public Sector
- 4.2.2 Large-Scale Adoption of Generative AI among Fortune 1000
- 4.2.3 5G and Edge Roll-out Driving Network Integration Demand
- 4.2.4 Zero-Trust Cybersecurity Mandates Boosting Security Services
- 4.2.5 Healthcare Interoperability Rules Fueling EHR Integration Services
- 4.2.6 PE-Backed ERP Modernization Wave in Mid-Market Firms
- 4.3 Market Restraints
- 4.3.1 Scarcity of Senior Cloud and Security Talent
- 4.3.2 Margin Pressure from Outcome-Based Pricing Models
- 4.3.3 Compliance Complexity under CCPA/CPRA Litigation
- 4.3.4 Offshore Wage Inflation Eroding Cost Advantages
- 4.4 Industry Value Chain Analysis
- 4.5 Regulatory Outlook
- 4.6 Impact of Macroeconomic Factors on the Market
- 4.7 Technological Outlook
- 4.8 Porter's Five Forces Analysis
- 4.8.1 Bargaining Power of Suppliers
- 4.8.2 Bargaining Power of Buyers
- 4.8.3 Threat of New Entrants
- 4.8.4 Degree of Competition
- 4.8.5 Threat of Substitutes
- 4.9 Comparative Insights - Tier 1 vs Tier 2 Vendors
- 4.10 In-housing vs Outsourcing Analysis
- 4.11 Investment Analysis
5 MARKET SIZE AND GROWTH FORECASTS (VALUE)
- 5.1 By Service Type
- 5.1.1 IT Consulting and Implementation
- 5.1.2 Application Development and Maintenance (ADM)
- 5.1.3 Infrastructure Services
- 5.1.4 Managed Services
- 5.1.5 IT Outsourcing (ITO)
- 5.1.6 Business Process Outsourcing (BPO)
- 5.1.7 Cloud and Platform Services
- 5.1.8 Cybersecurity Services
- 5.1.9 Digital Transformation and Emerging Tech (AI, IoT, Blockchain)
- 5.2 By Deployment Model
- 5.2.1 Onshore Delivery
- 5.2.2 Nearshore Delivery
- 5.2.3 Offshore Delivery
- 5.3 By Engagement Model
- 5.3.1 Project-based / Fixed Price
- 5.3.2 Staff Augmentation / Time-and-Material
- 5.3.3 Managed Services / Outcome-based
- 5.4 By Organization Size
- 5.4.1 Large Enterprises
- 5.4.2 Small and Medium Enterprises (SMEs)
- 5.5 By End-User Industry
- 5.5.1 Banking, Financial Services and Insurance (BFSI)
- 5.5.2 Manufacturing
- 5.5.3 Government and Public Sector
- 5.5.4 Healthcare and Life Sciences
- 5.5.5 Retail and Consumer Goods
- 5.5.6 Telecom and Media
- 5.5.7 Transportation and Logistics
- 5.5.8 Energy and Utilities
- 5.5.9 Other End-User Industries
6 COMPETITIVE LANDSCAPE
- 6.1 Market Concentration
- 6.2 Strategic Moves
- 6.3 Market Share Analysis
- 6.4 Company Profiles (includes Global level Overview, Market level overview, Core Segments, Financials as available, Strategic Information, Market Rank/Share for key companies, Products and Services, and Recent Developments)
- 6.4.1 Accenture plc
- 6.4.2 IBM Corporation
- 6.4.3 Cognizant Technology Solutions Corp.
- 6.4.4 Tata Consultancy Services Ltd.
- 6.4.5 Microsoft Corporation
- 6.4.6 Infosys Ltd.
- 6.4.7 Wipro Ltd.
- 6.4.8 Deloitte Consulting LLP
- 6.4.9 Capgemini SE
- 6.4.10 HCL Technologies Ltd.
- 6.4.11 CGI Inc.
- 6.4.12 DXC Technology Co.
- 6.4.13 Booz Allen Hamilton Inc.
- 6.4.14 Leidos Holdings Inc.
- 6.4.15 Slalom LLC
- 6.4.16 EPAM Systems Inc.
- 6.4.17 NTT DATA Services
- 6.4.18 Kyndryl Holdings Inc.
- 6.4.19 LTI Mindtree Ltd.
- 6.4.20 Tech Mahindra Ltd.
- 6.4.21 Perficient Inc.
- 6.4.22 ThoughtWorks Inc.
- 6.4.23 Persistent Systems Ltd.
7 MARKET OPPORTUNITIES AND FUTURE OUTLOOK
- 7.1 White-space and Unmet-Need Assessment

 印尼IT服務:市場佔有率分析、產業趨勢與統計及成長預測(2026-2031年)北美IT服務:市場佔有率分析、產業趨勢與統計、成長預測(2026-2031年)歐洲IT服務:市場佔有率分析、產業趨勢與統計、成長預測(2026-2031年)
 2026-2030年全球IT服務市場英國IT服務:市場佔有率分析、產業趨勢與統計、成長預測(2026-2031年)零售商個人化服務:市場佔有率分析、產業趨勢與統計及成長預測(2026-2031 年)IT服務:市場佔有率分析、產業趨勢與統計、成長預測(2026-2031年)
 BlockConnect 服務市場預測至 2034 年—按服務類型、部署模式、技術、應用、最終用戶和地區分類的全球分析個人化服務:市場佔有率分析、產業趨勢與統計、成長預測(2026-2031)亞太地區IT服務:市場佔有率分析、產業趨勢與統計及成長預測(2026-2031年)