


 |
市場調查報告書
商品編碼
2118941
零售商個人化服務:市場佔有率分析、產業趨勢與統計及成長預測(2026-2031 年)Retail Personalization Services - Market Share Analysis, Industry Trends & Statistics, Growth Forecasts (2026 - 2031) |
||||||

※ 本網頁內容可能與最新版本有所差異。詳細情況請與我們聯繫。
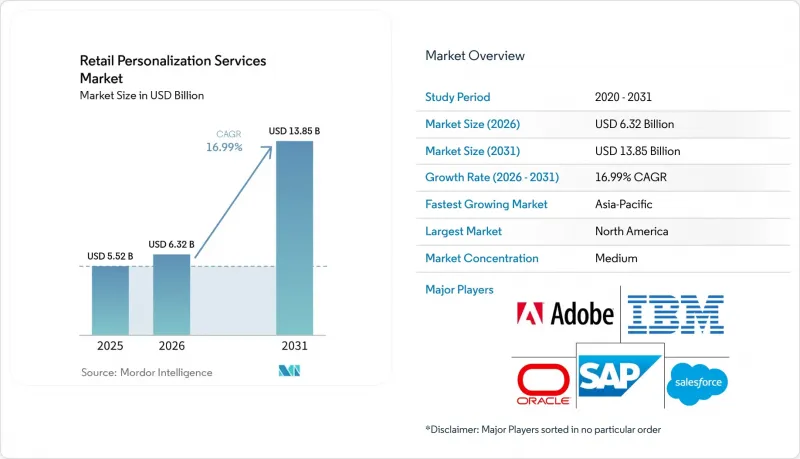
零售業個人化服務的市場規模預計將從 2025 年的 55.2 億美元和 2026 年的 63.2 億美元成長到 2031 年的 138.5 億美元,2026 年至 2031 年的年複合成長率(CAGR)為 16.99%。
本報告按應用領域(產品建議、個人化搜尋和商品行銷、會員忠誠度和優惠個人化等)、公司規模(大型企業、中小企業)、終端用戶行業(時尚服飾、美容及個人護理、食品及快速消費品等)和地區進行細分。市場預測以美元計價。
零售業個人化服務市場的全球趨勢與洞察
對個人化全通路購物體驗的需求日益成長
零售商越來越需要在門市、網站、應用程式和通訊管道之間提供無縫體驗。零售個人化服務市場受益於將這些觸點的行為訊號與可操作的客戶畫像關聯起來。這些畫像使零售商能夠根據消費者的近期活動做出回應,而不是依賴寬泛的宣傳活動規則。此外,這些關聯的畫像有助於在消費者於線上和線下管道之間切換時,保持服務的一致性。隨著零售商收集到更豐富的第一方數據,數據的品質變得比個人化引擎本身更為重要。這推動了對能夠向客戶服務團隊提供經用戶許可的數據的系統的需求。
擴大人工智慧主導的產品發現和搜尋的應用
人工智慧主導的產品發現正在改變零售搜尋,使其從簡單的關鍵字匹配轉變為一個綜合考慮購買意圖、庫存、產品屬性和消費者行為的流程。這推動了零售個人化服務市場的發展,因為網站搜尋通常是購買流程中的高轉換率環節。 2026年7月,Algolia發布了「動態篩選器」(Dynamic Facets),無需手動配置即可根據搜尋情境和使用者行為調整產品篩選條件。 2026年3月,Coveo推出了「對話式產品發現」(Conversational Product Discovery),將自然語言產品對話直接整合到電商搜尋中。擁有可靠產品資訊和最新庫存數據的零售商能夠提供比產品目錄記錄不完整的供應商更相關的搜尋結果。因此,產品資料管治是實現個人化服務商業價值的重要組成部分。
資料隱私、同意和跨境資料合規的複雜性。
資料隱私和演算法課責的要求使得跨多個司法管轄區部署個人化專案變得困難重重。當零售商必須對同一項目應用不同的同意、刪除、揭露和審計實務時,零售個人化服務市場面臨更大的複雜性。 《加州消費者隱私法案》(CCPA) 將於 2026 年生效,該法案界定了加州消費者的隱私權和企業義務。服務於歐洲、加州和海灣合作理事會 (GCC) 市場的零售商可能需要採用不同的透明度和資料處理方法。對於沒有大規模法律或技術合規團隊的小規模品牌而言,這種負擔更為沉重。透過使用將同意管理和審計功能整合到其平台中的供應商,零售商可以減少添加額外工具的需求。
細分市場分析
到2025年,產品建議將佔零售個人化服務市場佔有率的25.27%,成為最大的應用領域。零售商之所以重視這項應用,是因為它允許他們將推薦帶來的銷售表現與對照組進行比較。個人化搜尋和商品行銷也發揮重要作用,因為搜尋行為通常預示著即時的購買意願。忠誠度計劃和建議優惠有助於超越大範圍的折扣宣傳活動,而客戶細分和分析則為其他應用提供了所需的客戶群洞察。這些成熟的應用為零售個人化服務市場提供了廣泛的需求基礎。
預計從2026年到2031年,客戶旅程編配將以19.22%的複合年成長率成長,成為成長最快的應用領域。零售商正在尋求能夠基於即時行為連接客戶數據平台和通路工具的系統。 Bloomreach於2026年6月推出了其行銷代理商Loomi,旨在將負責人的指令轉化為工作流程,並實現行為模式。內容個人化仍然是已定義的應用細分領域中最小的,但利用生成式人工智慧可以減少創建個人化內容變體所需的時間。應用架構正在從獨立的工具轉向互聯的客戶互動。
區域分析
到2025年,北美將佔據全球零售個人化服務市場36.39%的佔有率。美國之所以能維持這一地位,得益於其高電子商務滲透率、大型零售商的集中以及對客戶數據平台的早期應用。與美國相比,加拿大和墨西哥仍屬於發展中市場,但它們受益於該地區的供應商生態系統和零售集團。歐洲是第二大市場,由德國、英國和法國領軍。儘管歐洲對人工智慧主導的個人化服務有著巨大的需求,但資料居住和隱私要求可能會減緩資料的利用速度。
預計到2031年,亞太地區零售個人化服務市場將以20.23%的複合年成長率成長,成為該地區成長最快的零售個人化服務市場。中國、印度、韓國和日本預計將貢獻大部分新增需求。伊勢丹三越在電商業務中實施個人化人工智慧系統後,點擊率提升了1.4倍,購物車添加量增加了1.4倍,轉換率提高了1.3倍。在這些市場中,適用於高度數位化和行動主導零售環境的解決方案更受歡迎。
南美洲、中東和非洲仍處於數位轉型初期,各地區的發展路徑不盡相同。巴西擁有大規模的電子商務基礎設施,是南美洲成長潛力最大的國家。同時,隨著數位商務的擴張,阿根廷和智利的零售商也在加大投資。在阿拉伯聯合大公國和沙烏地阿拉伯,精通數位技術的消費者需求不斷成長,推動了智慧零售領域的投資。在南非、埃及和奈及利亞等非洲市場,行動商務基礎設施的完善為早期數位轉型提供了支持。在全部區域,以行動優先的商務模式傾向於使用通訊工具和應用程式體驗,而非依賴瀏覽器的個人化引擎。
其他好處:
- Excel格式的市場預測(ME)表
- 3個月的分析師支持
目錄
第1章:引言
- 研究假設和市場定義
- 調查範圍
第2章:調查方法
第3章執行摘要
第4章 市場狀況
- 市場概覽
- 市場促進因素
- 一對一全通路購物體驗的需求日益成長
- 擴大人工智慧驅動的產品發現和搜尋功能的使用
- 向第一方數據和零售媒體的使用正在不斷擴大。
- 在獲客成本飆升的環境下,提高轉換率和利潤率勢在必行。
- 門市員工的「協同駕駛」和「客戶服務」活動將門市和數位檔案連結起來。
- 生成式人工智慧降低了長尾內容的成本,並實現了個人化推薦。
- 市場限制因素
- 資料隱私、同意和跨境資料合規的複雜性。
- 整合電商、CRM、CDP 和 POS 系統面臨的挑戰。
- 匿名流量和封閉的支付管道導致身分碎片化
- 高頻個人化測試中的內容運作瓶頸
- 宏觀經濟因素對市場的影響
- 產業價值鏈分析
- 技術展望
- 監理情勢
- 波特五力分析
第5章 市場規模與成長預測
- 透過使用
- 推薦產品
- 個性化搜尋和商品行銷
- 個人化版稅和優惠
- 客戶細分與分析
- 客戶旅程編配
- 內容個人化
- 其他用途
- 按公司規模
- 大公司
- 小型企業
- 按最終用戶行業分類
- 時尚與服裝
- 美容及個人護理
- 食品和快速消費品
- 家用電子產品
- 家具和住宅維修
- 奢侈品和特色零售
- 百貨公司和市場
- 按地區
- 北美洲
- 美國
- 加拿大
- 墨西哥
- 南美洲
- 巴西
- 阿根廷
- 智利
- 其他南美國家
- 歐洲
- 德國
- 英國
- 法國
- 義大利
- 西班牙
- 其他歐洲國家
- 亞太地區
- 中國
- 日本
- 印度
- 韓國
- 澳洲
- 其他亞太國家
- 中東
- 阿拉伯聯合大公國
- 沙烏地阿拉伯
- 卡達
- 其他中東國家
- 非洲
- 南非
- 埃及
- 奈及利亞
- 其他非洲國家
- 北美洲
第6章 競爭情勢
- 市場集中度
- 策略趨勢
- 市佔率分析
- 公司簡介
- Adobe Inc.
- Salesforce, Inc.
- SAP SE
- Mastercard International Incorporated
- Bloomreach, Inc.
- Coveo Solutions Inc.
- Algolia, Inc.
- Nosto Solutions Ltd.
- Monetate, Inc.
- Insider by Sosyo Plus Bilgi Bilisim Tekn. Dan. Hiz. Tic. AS
- Braze, Inc.
- Klaviyo, Inc.
- Bluecore, Inc.
- Twilio Inc.
- Microsoft Corporation
- Google LLC
- Amazon Web Services, Inc.
- International Business Machines Corporation
- Sitecore A/S
- Optimizely North America Inc.
- PartnerCentric, Inc.
- Rise Interactive Holdings, LLC
第7章 市場機會與未來展望
According to Mordor Intelligence, the retail personalization services market size is projected to expand from USD 5.52 billion in 2025 and USD 6.32 billion in 2026 to USD 13.85 billion by 2031, registering a CAGR of 16.99% between 2026 and 2031.
This report is Segmented by Application (Product Recommendations, Personalized Search and Merchandising, Loyalty and Offer Personalization, and More), Enterprise Size (Large Enterprises, and Small and Medium-Sized Enterprises), End-User Industry (Fashion and Apparel, Beauty and Personal Care, Grocery and FMCG, and More), and Geography. The Market Forecasts are Provided in Terms of Value (USD).
Global Retail Personalization Services Market Trends and Insights
Rising Demand for Individual Omnichannel Shopping Experiences
Retailers increasingly need connected experiences across stores, websites, applications, and messaging channels. The Retail Personalization Services Market benefits when behavioral signals from these touchpoints are linked to a usable customer profile. Such profiles allow retailers to respond to a shopper's recent activity rather than rely on broad campaign rules. Connected profiles also make it easier to maintain consistent service when a shopper moves between digital and physical channels. As retailers collect richer first-party data, the quality of that data becomes more important than the personalization engine alone. This increases demand for systems that can make consented data available to the teams responsible for customer interactions.
Expanding Use of AI-Led Product Discovery and Search
AI-led discovery is changing retail search from keyword matching to a process that can consider intent, inventory, product attributes, and shopper behavior. This supports the Retail Personalization Services Market because site search is often a high-intent point in the purchase path. Algolia launched Dynamic Facets in July 2026 to adapt product filters to search context and user behavior without manual configuration. Coveo introduced Conversational Product Discovery in March 2026, placing natural-language product dialogue directly within commerce search. Retailers with reliable product information and current inventory feeds can deliver more relevant search results than those with incomplete catalog records. Product data governance therefore becomes part of the commercial case for personalization services.
Data Privacy, Consent, and Cross-Border Data Compliance Complexity
Data privacy and algorithmic accountability requirements can make it harder to deploy personalization programs across multiple jurisdictions. The Retail Personalization Services Market faces added complexity when retailers must apply different consent, deletion, disclosure, and audit practices to the same program. The California Consumer Privacy Act, effective in 2026, establishes consumer privacy rights and business obligations in California. A retailer serving Europe, California, and Gulf Cooperation Council markets may need separate approaches to transparency and data handling. This burden is greater for smaller brands without large legal or technical compliance teams. Providers that embed consent controls and audit features into their platforms can reduce retailers' need to add separate tools.
Other drivers and restraints analyzed in the detailed report include:
- Growing Shift to First-Party Data and Retail Media Activation
- Need to Lift Conversion and Margin in Higher-Cost Acquisition Environments
- Integration Challenges Across Commerce, CRM, CDP, and POS Stacks
For complete list of drivers and restraints, kindly check the Table Of Contents.
Segment Analysis
Product Recommendations captured 25.27% of the Retail Personalization Services Market share in 2025, making it the largest application segment. Retailers value the application because sales from a recommendation placement can be compared with a control group. Personalized Search and Merchandising is also important because search activity often indicates immediate purchase interest. Loyalty and Offer Personalization supports a move away from broad discount campaigns, while Customer Segmentation and Analytics supplies the audience understanding needed by other applications. These established uses provide the Retail Personalization Services Market with a broad base of demand.
Customer Journey Orchestration is expected to grow at a CAGR of 19.22% from 2026 to 2031, the highest growth rate among applications. Retailers are seeking systems that coordinate customer data platforms and channel tools around real-time behavior. Bloomreach made its Loomi marketing agent generally available in June 2026, with the product designed to turn a marketer prompt into a workflow with segmentation, content, and behavior-based automation. Content Personalization remains the smallest defined application segment, but generative AI can reduce the time needed to produce individual content variants. The application mix is moving from separate tools toward coordinated customer interactions.
Complete Report Scope:
- By Application
- Product Recommendations
- Personalized Search and Merchandising
- Loyalty and Offer Personalization
- Customer Segmentation and Analytics
- Customer Journey Orchestration
- Content Personalization
- Other Applications
- By Enterprise Size
- Large Enterprises
- Small and Medium-sized Enterprises
- By End-User Industry
- Fashion and Apparel
- Beauty and Personal Care
- Grocery and FMCG
- Consumer Electronics
- Home Furnishings and Home Improvement
- Luxury and Specialty Retail
- Department Stores and Marketplaces
- By Geography
- North America
- United States
- Canada
- Mexico
- South America
- Brazil
- Argentina
- Chile
- Rest of South America
- Europe
- Germany
- United Kingdom
- France
- Italy
- Spain
- Rest of Europe
- Asia-Pacific
- China
- Japan
- India
- South Korea
- Australia
- Rest of Asia-Pacific
- Middle East
- United Arab Emirates
- Saudi Arabia
- Qatar
- Rest of Middle East
- Africa
- South Africa
- Egypt
- Nigeria
- Rest of Africa
- North America
Geography Analysis
North America held 36.39% of the global Retail Personalization Services Market in 2025. The United States supports this position through high e-commerce adoption, a large concentration of enterprise retailers, and early adoption of customer data platforms. Canada and Mexico remain earlier-stage markets relative to the United States, but benefit from vendor ecosystems and retail groups with regional operations. Europe is the second-largest geography, led by Germany, the United Kingdom, and France. European demand for AI-led personalization is substantial, but data residency and privacy requirements can slow data activation.
Asia-Pacific is projected to grow at a CAGR of 20.23% through 2031, the fastest regional rate in the Retail Personalization Services Market. China, India, South Korea, and Japan are expected to generate much of the new demand. Isetan Mitsukoshi reported a 1.4x improvement in click-through rate, a 1.4x increase in cart additions, and a 1.3x lift in conversion after deploying a personalization AI system in its e-commerce operations. These markets favor approaches that work within highly digital and mobile-led retail environments.
South America, the Middle East, and Africa remain earlier-stage geographies with different paths to adoption. Brazil is the leading South American opportunity because of its large e-commerce base, while retailers in Argentina and Chile are increasing investment as digital commerce expands. The United Arab Emirates and Saudi Arabia are seeing growing demand from digitally active consumers and smart retail investment. South Africa, Egypt, and Nigeria are among the African markets where mobile commerce infrastructure is supporting initial deployments. Across these regions, mobile-first commerce can favor messaging tools and application-based experiences over browser-dependent personalization engines.
- Adobe Inc.
- Salesforce, Inc.
- SAP SE
- Mastercard International Incorporated
- Bloomreach, Inc.
- Coveo Solutions Inc.
- Algolia, Inc.
- Nosto Solutions Ltd.
- Monetate, Inc.
- Insider by Sosyo Plus Bilgi Bilisim Tekn. Dan. Hiz. Tic. A.S.
- Braze, Inc.
- Klaviyo, Inc.
- Bluecore, Inc.
- Twilio Inc.
- Microsoft Corporation
- Google LLC
- Amazon Web Services, Inc.
- International Business Machines Corporation
- Sitecore A/S
- Optimizely North America Inc.
- PartnerCentric, Inc.
- Rise Interactive Holdings, LLC
Additional Benefits:
- The market estimate (ME) sheet in Excel format
- 3 months of analyst support
TABLE OF CONTENTS
1 INTRODUCTION
- 1.1 Study Assumptions and Market Definition
- 1.2 Scope of the Study
2 RESEARCH METHODOLOGY
3 EXECUTIVE SUMMARY
4 MARKET LANDSCAPE
- 4.1 Market Overview
- 4.2 Market Drivers
- 4.2.1 Rising Demand for 1:1 Omnichannel Shopping Experiences
- 4.2.2 Expanding Use of AI-Led Product Discovery and Search
- 4.2.3 Growing Shift to First-Party Data and Retail Media Activation
- 4.2.4 Need to Lift Conversion and Margin in Higher-Cost Acquisition Environments
- 4.2.5 Store Associate Copilots and Clienteling Linking Store and Digital Profiles
- 4.2.6 Generative AI Reducing the Cost of Long-Tail Content and Offer Personalization
- 4.3 Market Restraints
- 4.3.1 Data Privacy, Consent, and Cross-Border Data Compliance Complexity
- 4.3.2 Integration Challenges Across Commerce, CRM, CDP, and POS Stacks
- 4.3.3 Identity Fragmentation from Anonymous Traffic and Walled-Garden Checkout Paths
- 4.3.4 Content Operations Bottlenecks for High-Frequency Personalization Testing
- 4.4 Impact of Macroeconomic Factors on the Market
- 4.5 Industry Value-Chain Analysis
- 4.6 Technology Outlook
- 4.7 Regulatory Landscape
- 4.8 Porter's Five Forces Analysis
- 4.8.1 Threat of New Entrants
- 4.8.2 Bargaining Power of Suppliers
- 4.8.3 Bargaining Power of Buyers
- 4.8.4 Threat of Substitutes
- 4.8.5 Intensity of Competitive Rivalry
5 MARKET SIZE AND GROWTH FORECASTS (VALUE)
- 5.1 By Application
- 5.1.1 Product Recommendations
- 5.1.2 Personalized Search and Merchandising
- 5.1.3 Loyalty and Offer Personalization
- 5.1.4 Customer Segmentation and Analytics
- 5.1.5 Customer Journey Orchestration
- 5.1.6 Content Personalization
- 5.1.7 Other Applications
- 5.2 By Enterprise Size
- 5.2.1 Large Enterprises
- 5.2.2 Small and Medium-sized Enterprises
- 5.3 By End-User Industry
- 5.3.1 Fashion and Apparel
- 5.3.2 Beauty and Personal Care
- 5.3.3 Grocery and FMCG
- 5.3.4 Consumer Electronics
- 5.3.5 Home Furnishings and Home Improvement
- 5.3.6 Luxury and Specialty Retail
- 5.3.7 Department Stores and Marketplaces
- 5.4 By Geography
- 5.4.1 North America
- 5.4.1.1 United States
- 5.4.1.2 Canada
- 5.4.1.3 Mexico
- 5.4.2 South America
- 5.4.2.1 Brazil
- 5.4.2.2 Argentina
- 5.4.2.3 Chile
- 5.4.2.4 Rest of South America
- 5.4.3 Europe
- 5.4.3.1 Germany
- 5.4.3.2 United Kingdom
- 5.4.3.3 France
- 5.4.3.4 Italy
- 5.4.3.5 Spain
- 5.4.3.6 Rest of Europe
- 5.4.4 Asia-Pacific
- 5.4.4.1 China
- 5.4.4.2 Japan
- 5.4.4.3 India
- 5.4.4.4 South Korea
- 5.4.4.5 Australia
- 5.4.4.6 Rest of Asia-Pacific
- 5.4.5 Middle East
- 5.4.5.1 United Arab Emirates
- 5.4.5.2 Saudi Arabia
- 5.4.5.3 Qatar
- 5.4.5.4 Rest of Middle East
- 5.4.6 Africa
- 5.4.6.1 South Africa
- 5.4.6.2 Egypt
- 5.4.6.3 Nigeria
- 5.4.6.4 Rest of Africa
- 5.4.1 North America
6 COMPETITIVE LANDSCAPE
- 6.1 Market Concentration
- 6.2 Strategic Moves
- 6.3 Market Share Analysis
- 6.4 Company Profiles (includes Global Level Overview, Market Level Overview, Core Segments, Financials as available, Strategic Information, Market Rank/Share, Products and Services, Recent Developments)
- 6.4.1 Adobe Inc.
- 6.4.2 Salesforce, Inc.
- 6.4.3 SAP SE
- 6.4.4 Mastercard International Incorporated
- 6.4.5 Bloomreach, Inc.
- 6.4.6 Coveo Solutions Inc.
- 6.4.7 Algolia, Inc.
- 6.4.8 Nosto Solutions Ltd.
- 6.4.9 Monetate, Inc.
- 6.4.10 Insider by Sosyo Plus Bilgi Bilisim Tekn. Dan. Hiz. Tic. A.S.
- 6.4.11 Braze, Inc.
- 6.4.12 Klaviyo, Inc.
- 6.4.13 Bluecore, Inc.
- 6.4.14 Twilio Inc.
- 6.4.15 Microsoft Corporation
- 6.4.16 Google LLC
- 6.4.17 Amazon Web Services, Inc.
- 6.4.18 International Business Machines Corporation
- 6.4.19 Sitecore A/S
- 6.4.20 Optimizely North America Inc.
- 6.4.21 PartnerCentric, Inc.
- 6.4.22 Rise Interactive Holdings, LLC
7 MARKET OPPORTUNITIES AND FUTURE OUTLOOK
- 7.1 White-Space and Unmet-Need Assessment

 印尼IT服務:市場佔有率分析、產業趨勢與統計及成長預測(2026-2031年)北美IT服務:市場佔有率分析、產業趨勢與統計、成長預測(2026-2031年)歐洲IT服務:市場佔有率分析、產業趨勢與統計、成長預測(2026-2031年)
 2026-2030年全球IT服務市場美國IT服務:市場佔有率分析、產業趨勢與統計、成長預測(2026-2031年)英國IT服務:市場佔有率分析、產業趨勢與統計、成長預測(2026-2031年)IT服務:市場佔有率分析、產業趨勢與統計、成長預測(2026-2031年)
 BlockConnect 服務市場預測至 2034 年—按服務類型、部署模式、技術、應用、最終用戶和地區分類的全球分析個人化服務:市場佔有率分析、產業趨勢與統計、成長預測(2026-2031)亞太地區IT服務:市場佔有率分析、產業趨勢與統計及成長預測(2026-2031年)