

 |
市場調查報告書
商品編碼
2124764
印尼潤滑油市場:市場佔有率分析、產業趨勢與統計、成長預測(2026-2031)Indonesia Lubricants - Market Share Analysis, Industry Trends & Statistics, Growth Forecasts (2026 - 2031) |
||||||

※ 本網頁內容可能與最新版本有所差異。詳細情況請與我們聯繫。
據 Mordor Intelligence 稱,2025 年印尼潤滑油市場價值為 12 億公升,預計到 2031 年將達到 14.1 億公升,而 2026 年為 12.3 億公升,預測期(2026-2031 年)複合年成長率為 2.71%。
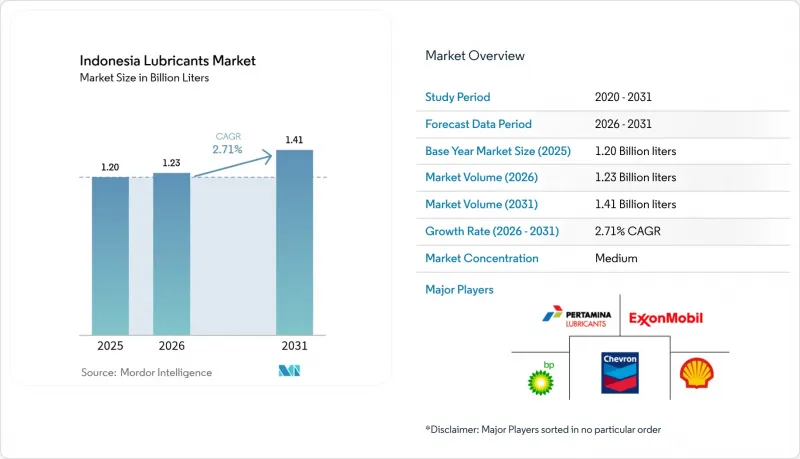
本報告按產品類型(汽車引擎油、工業引擎油、變速箱油、齒輪油、煞車油、液壓油、潤滑脂等)、終端用戶產業(汽車、船舶、航太、重型機械、工業)和基料類型(礦物油基、合成油、半合成油、生物基)進行細分。市場預測以銷售量(公升)為單位。
印尼潤滑油市場趨勢與洞察
註冊車輛數量的增加
印尼汽車產業的擴張正透過乘用車數量的成長以及全國物流網路中商用車隊的現代化,推動潤滑油消費。根據國際汽車製造商協會(OICA)預測,到2024年,印尼的汽車產量將達到119萬輛。自動擋摩托車的普及催生了對專用於自動擋車輛的潤滑油配方的需求。電子商務的蓬勃發展和「最後一公里」配送的普及提高了車輛利用率,導致潤滑油更換頻率超出了傳統的消費模式。政府大力推廣電動車,並計劃在2040年前逐步淘汰內燃機車,這些措施對汽車潤滑油的銷售量成長構成了結構性限制。區域分銷網路難以有效率地服務印尼的離島,造成供應瓶頸,限制了新興汽車產業叢集的市場滲透。
工業和製造業的快速發展
印尼製造業的蓬勃發展與金屬加工、發電和重型機械應用領域工業潤滑油需求的成長直接相關。作為全球最大的鎳生產國,印尼進一步推動了冶煉過程中對專用金屬加工液和液壓系統潤滑油的需求。製造業投資創造了新的工業產能,需要初始潤滑和持續維護。埃克森美孚於2024年6月推出的MACHINEXT現場潤滑管理技術,展示了一種透過數位化最佳化延長設備使用壽命並降低整體擁有成本的機制。雖然製造業集中在爪哇島帶來了物流優勢,但也限制了資源豐富的周邊地區的成長潛力,這些地區的基礎建設落後於工業投資。
宏觀經濟和商品價格波動正在拉低產能運轉率。
由於宏觀經濟的不確定性和商品價格波動,印尼潤滑油產業面臨產能利用率的挑戰,抑制了工業活動和消費支出。運轉率,印尼國內潤滑油產業的產能運轉率約為60%。全球供應鏈中斷和外匯波動影響了基礎油進口成本,迫使製造商調整定價策略並考慮其對需求彈性的影響。棕櫚油和採礦等出口依賴型產業受經濟週期影響而停滯不前,商品價格下跌時,工業潤滑油的消費量也會下降。爪哇島製造業產能集中,造成區域發展不平衡,在經濟不穩定時期,確保其他島嶼營運供應鏈的可靠性成為一項挑戰。此外,遵守印尼國家標準(SNI)的相關合規成本對小規模企業而言是一項難以承受的營運負擔,尤其是在利潤空間本已受到擠壓的情況下。
細分市場分析
到2025年,汽車機油將佔印尼潤滑油市場佔有率的35.80%,這反映了印尼以汽車為中心的潤滑油消費模式以及內燃機在乘用車和商用車領域的主導地位。液壓油是成長最快的產品類別,預計2026年至2031年將以3.51%的複合年成長率成長,這主要得益於基礎建設和採礦產品類型對高性能液壓系統的需求不斷成長。工業機油應用於發電和船舶領域,而變速箱油則受益於摩托車行業自動變速箱的日益普及。齒輪油是印尼重型機械和工業設備基礎設施的基礎,尤其是在加里曼丹和蘇拉威西的採礦作業中。
加工油,包括橡膠加工油和白油,廣泛應用於印尼的輪胎製造和石化產業;金屬加工液則為該國蓬勃發展的製造業提供支援。渦輪機油和變壓器油用於發電基礎設施,潤滑脂的應用範圍則十分廣泛,從汽車底盤潤滑到工業軸承系統均有涉及。產品配方向專業混合油的演變,反映了印尼工業日益精細化的發展,以及原始設備製造商(OEM)對高性能潤滑油日益成長的需求,這些潤滑油必須符合API、JASO和ACEA等國際標準。
其他好處:
- Excel格式的市場預測(ME)表
- 3個月的分析師支持
目錄
第1章:引言
- 研究假設和市場定義
- 調查範圍
第2章:調查方法
第3章執行摘要
第4章 市場狀況
- 市場概覽
- 市場促進因素
- 註冊車輛數量的增加
- 工業和製造業的快速發展
- 全國基礎設施建設和蓬勃發展的採礦活動
- 航運和漁業船隊的現代化
- 潤滑油受到生物柴油污染,推動了對高性能添加劑的需求。
- 市場限制因素
- 宏觀經濟和商品價格波動導致產能運轉率下降。
- 使用更換週期更長的合成機油,降低了每輛車的機油消耗。
- 原油價格波動擠壓了利潤空間,使對價格敏感的買家處境艱難。
- 價值鏈分析
- 法律規範
- 終端用戶趨勢
- 汽車產業
- 製造業
- 發電業
- 波特五力模型
第5章 市場規模與成長預測
- 依產品類型
- 汽車引擎油
- 工業機油
- 變速箱油
- 齒輪油
- 煞車油
- 油壓
- 潤滑脂
- 加工油(包括橡膠加工油和白油)
- 金屬加工用潤滑液
- 渦輪機油
- 變壓器油
- 其他產品類型
- 按最終用戶行業分類
- 車
- 搭乘用車
- 商用車輛
- 摩托車
- 海上
- 航太
- 重型機械
- 建造
- 礦業
- 農業
- 產業
- 發電
- 冶金/金屬加工
- 紡織品
- 石油和天然氣
- 其他終端用戶產業
- 車
- 依基油類型
- 礦物油性潤滑劑
- 合成潤滑油
- 半合成潤滑油
- 生物性潤滑劑
第6章 競爭情勢
- 市場集中度
- 策略趨勢
- 市佔率和排名分析
- 公司簡介
- BP Plc(Castrol)
- Chevron Corporation
- Exxon Mobil Corporation
- FUCHS
- Gulf Oil International Ltd
- Idemitsu Kosan Co., Ltd.
- PETRONAS Lubricants International
- PT Pertamina Lubricants
- PT Wiraswasta Gemilang Indonesia
- Shell plc
- The Lubrizol Corporation
- TOP 1 Oil Products Company
- TotalEnergies
第7章 市場機會與未來展望
第8章:執行長面臨的關鍵策略挑戰
According to Mordor Intelligence, the indonesian lubricants market size was valued at 1.20 billion liters in 2025 and estimated to grow from 1.23 billion liters in 2026 to reach 1.41 billion liters by 2031, at a CAGR of 2.71% during the forecast period (2026-2031).
This report is Segmented by Product Type (Automotive Engine Oil, Industrial Engine Oil, Transmission Fluids, Gear Oil, Brake Fluids, Hydraulic Fluids, Greases, and More), End-User Industry (Automotive, Marine, Aerospace, Heavy Equipment, and Industrial), and Base Stock Type (Mineral Oil-Based, Synthetic, Semi-Synthetic, and Bio-Based). The Market Forecasts are Provided in Terms of Volume (Liters).
Indonesia Lubricants Market Trends and Insights
Growing Automotive Parc Expansion
Indonesia's expanding automotive sector drives lubricant consumption through both passenger vehicle growth and commercial fleet modernization across the archipelago's logistics networks. According to the International Organization of Motor Vehicle Manufacturers (OICA), the country produced 1.19 million vehicles in 2024. The shift toward automatic transmission motorcycles creates demand for specialized lubricant formulations for matic applications. E-commerce expansion and the proliferation of last-mile delivery increase vehicle utilization rates, leading to a higher frequency of lubricant replacement beyond traditional consumer patterns. The government's push for electric vehicles and its planned phase-out of internal combustion engines by 2040 creates a structural ceiling for growth in automotive lubricant volumes. Regional distribution networks struggle to efficiently serve Indonesia's outer islands, creating supply bottlenecks that limit market penetration in emerging automotive clusters.
Rapid Industrial and Manufacturing Growth
Indonesia's manufacturing sector momentum directly translates to heightened industrial lubricant consumption across metalworking, power generation, and heavy equipment applications. The country's position as the world's largest nickel producer amplifies demand for specialized metalworking fluids and hydraulic systems lubricants in smelting operations. Manufacturing investment creates new industrial capacity requiring initial lubricant fills and ongoing maintenance programs. ExxonMobil's MACHINEXT on-site lubrication management technology, launched in June 2024, demonstrates how digital optimization reduces the total cost of ownership while extending equipment life cycles. The concentration of manufacturing on Java Island creates logistical advantages but limits growth potential in resource-rich outer regions where infrastructure development lags behind industrial investment.
Macroeconomic and Commodity-Price Volatility Dampening Cap-Utilization
Indonesia's lubricant industry faces capacity utilization challenges due to macroeconomic uncertainty and fluctuations in commodity prices, which dampen industrial activity and consumer spending patterns. The domestic industry operates at approximately 60% capacity utilization. Global supply chain disruptions and currency volatility impact base oil import costs, forcing manufacturers to adjust their pricing strategies and consider the effect on demand elasticity. Export-dependent sectors, such as palm oil and mining, experience cyclical downturns that reduce industrial lubricant consumption during commodity price slumps. The concentration of manufacturing capacity on Java island creates regional imbalances, while outer island operations struggle with supply chain reliability during economic turbulence. Regulatory compliance costs under mandatory SNI standards add operational overhead that smaller players cannot easily absorb during periods of margin compression.
Other drivers and restraints analyzed in the detailed report include:
- Nation-wide Infrastructure and Mining Activity Boom
- Marine and Fisheries Fleet Modernization
- Longer Drain-Interval Synthetic Formulations Lowering Volume/Vehicle
For complete list of drivers and restraints, kindly check the Table Of Contents.
Segment Analysis
Automotive engine oil commands 35.80% Indonesia's lubricant market share in 2025, reflecting Indonesia's vehicle-centric lubricant consumption patterns and the dominance of internal combustion engines across passenger and commercial segments. Hydraulic fluids represent the fastest-growing product category, with a 3.51% CAGR for 2026-2031, driven by infrastructure construction and the expansion of mining equipment, which require high-performance hydraulic systems. Industrial engine oil serves power generation and marine applications, while transmission fluids benefit from the automatic transmission boom in the motorcycle industry. Gear oils support Indonesia's heavy equipment and industrial machinery base, particularly in mining operations across Kalimantan and Sulawesi.
Process oils, including rubber process oil and white oil, serve the tire manufacturing and petrochemical industries in Indonesia, while metalworking fluids support the country's expanding manufacturing sector. Turbine oils and transformer oils cater to the power generation infrastructure, while greases serve a diverse range of applications, from automotive chassis lubrication to industrial bearing systems. The evolution of the product mix toward specialized formulations reflects Indonesia's increasing industrial sophistication and the growing influence of OEM specifications, which demand performance lubricants that meet international standards, such as API, JASO, and ACEA certifications.
Complete Report Scope:
- By Product Type
- Automotive Engine Oil
- Industrial Engine Oil
- Transmission Fluids
- Gear Oil
- Brake Fluids
- Hydraulic Fluids
- Greases
- Process Oil (Including Rubber Process Oil and White Oil)
- Metalworking Fluids
- Turbine Oil
- Transformer Oil
- Other Product Types
- By End-user Industry
- Automotive
- Passenger Vehicles
- Commercial Vehicles
- Two-Wheelers
- Marine
- Aerospace
- Heavy Equipment
- Construction
- Mining
- Agriculture
- Industrial
- Power Generation
- Metallurgy and Metalworking
- Textiles
- Oil and Gas
- Other End-Use Industries
- Automotive
- By Base Stock Type
- Mineral Oil-Based Lubricants
- Synthetic Lubricants
- Semi-Synthetic Lubricants
- Bio-Based Lubricants
List of Companies Covered in this Report:
- BP Plc (Castrol)
- Chevron Corporation
- Exxon Mobil Corporation
- FUCHS
- Gulf Oil International Ltd
- Idemitsu Kosan Co., Ltd.
- PETRONAS Lubricants International
- PT Pertamina Lubricants
- PT Wiraswasta Gemilang Indonesia
- Shell plc
- The Lubrizol Corporation
- TOP 1 Oil Products Company
- TotalEnergies
Additional Benefits:
- The market estimate (ME) sheet in Excel format
- 3 months of analyst support
TABLE OF CONTENTS
1 Introduction
- 1.1 Study Assumptions and Market Definition
- 1.2 Scope of the Study
2 Research Methodology
3 Executive Summary
4 Market Landscape
- 4.1 Market Overview
- 4.2 Market Drivers
- 4.2.1 Growing automotive parc expansion
- 4.2.2 Rapid industrial and manufacturing growth
- 4.2.3 Nation-wide infrastructure and mining activity boom
- 4.2.4 Marine and fisheries fleet modernization
- 4.2.5 Biodiesel-linked lubricant contamination driving premium additives
- 4.3 Market Restraints
- 4.3.1 Macroeconomic and commodity-price volatility dampening cap-utilization
- 4.3.2 Longer drain-interval synthetic formulations lowering volume/vehicle
- 4.3.3 Crude-oil price swings squeezing margins and price-sensitive buyers
- 4.4 Value Chain Analysis
- 4.5 Regulatory Framework
- 4.6 End-User Trends
- 4.6.1 Automotive Industry
- 4.6.2 Manufacturing Industry
- 4.6.3 Power Generation Industry
- 4.7 Porter's Five Forces
- 4.7.1 Bargaining Power of Suppliers
- 4.7.2 Bargaining Power of Buyers
- 4.7.3 Threat of New Entrants
- 4.7.4 Threat of Substitutes
- 4.7.5 Degree of Competition
5 Market Size and Growth Forecasts (Volume)
- 5.1 By Product Type
- 5.1.1 Automotive Engine Oil
- 5.1.2 Industrial Engine Oil
- 5.1.3 Transmission Fluids
- 5.1.4 Gear Oil
- 5.1.5 Brake Fluids
- 5.1.6 Hydraulic Fluids
- 5.1.7 Greases
- 5.1.8 Process Oil (Including Rubber Process Oil and White Oil)
- 5.1.9 Metalworking Fluids
- 5.1.10 Turbine Oil
- 5.1.11 Transformer Oil
- 5.1.12 Other Product Types
- 5.2 By End-user Industry
- 5.2.1 Automotive
- 5.2.1.1 Passenger Vehicles
- 5.2.1.2 Commercial Vehicles
- 5.2.1.3 Two-Wheelers
- 5.2.2 Marine
- 5.2.3 Aerospace
- 5.2.4 Heavy Equipment
- 5.2.4.1 Construction
- 5.2.4.2 Mining
- 5.2.4.3 Agriculture
- 5.2.5 Industrial
- 5.2.5.1 Power Generation
- 5.2.5.2 Metallurgy and Metalworking
- 5.2.5.3 Textiles
- 5.2.5.4 Oil and Gas
- 5.2.5.5 Other End-Use Industries
- 5.2.1 Automotive
- 5.3 By Base Stock Type
- 5.3.1 Mineral Oil-Based Lubricants
- 5.3.2 Synthetic Lubricants
- 5.3.3 Semi-Synthetic Lubricants
- 5.3.4 Bio-Based Lubricants
6 Competitive Landscape
- 6.1 Market Concentration
- 6.2 Strategic Moves
- 6.3 Market Share (%)/Ranking Analysis
- 6.4 Company Profiles (includes Global level Overview, Market level overview, Core Segments, Financials as available, Strategic Information, Market Rank/Share, Products and Services, Recent Developments)
- 6.4.1 BP Plc (Castrol)
- 6.4.2 Chevron Corporation
- 6.4.3 Exxon Mobil Corporation
- 6.4.4 FUCHS
- 6.4.5 Gulf Oil International Ltd
- 6.4.6 Idemitsu Kosan Co., Ltd.
- 6.4.7 PETRONAS Lubricants International
- 6.4.8 PT Pertamina Lubricants
- 6.4.9 PT Wiraswasta Gemilang Indonesia
- 6.4.10 Shell plc
- 6.4.11 The Lubrizol Corporation
- 6.4.12 TOP 1 Oil Products Company
- 6.4.13 TotalEnergies
7 Market Opportunities and Future Outlook
- 7.1 White-space and Unmet-need Assessment
8 Key Strategic Questions for CEOs

 北美潤滑油市場:市場佔有率分析、產業趨勢與統計、成長預測(2026-2031)防銹潤滑劑氣霧劑:市場佔有率分析、行業趨勢和統計數據以及成長預測(2026-2031 年)法國潤滑油市場:市場佔有率分析、產業趨勢與統計及成長預測(2026-2031)
 2026-2030年全球潤滑油市場中國潤滑油市場:市場佔有率分析、產業趨勢與統計、成長預測(2026-2031年)印度潤滑油市場:市場佔有率分析、產業趨勢與統計、成長預測(2026-2031)英國潤滑油市場:市場佔有率分析、產業趨勢與統計及成長預測(2026-2031)越南潤滑油市場:市場佔有率分析、產業趨勢與統計、成長預測(2026-2031)非洲潤滑油市場:市場佔有率分析、產業趨勢與統計、成長預測(2026-2031)馬來西亞潤滑油市場:市場佔有率分析、產業趨勢與統計、成長預測(2026-2031)