


 |
市場調查報告書
商品編碼
2118951
南美OTT市場:市場佔有率分析、產業趨勢與統計及成長預測(2026-2031年)South America OTT - Market Share Analysis, Industry Trends & Statistics, Growth Forecasts (2026 - 2031) |
||||||

※ 本網頁內容可能與最新版本有所差異。詳細情況請與我們聯繫。
2025 年南美 OTT 市場價值為 107.3 億美元,預計到 2031 年將達到 193.6 億美元,而 2026 年為 119.8 億美元,預測期內(2026-2031 年)的複合年成長率預計為 10.08%。
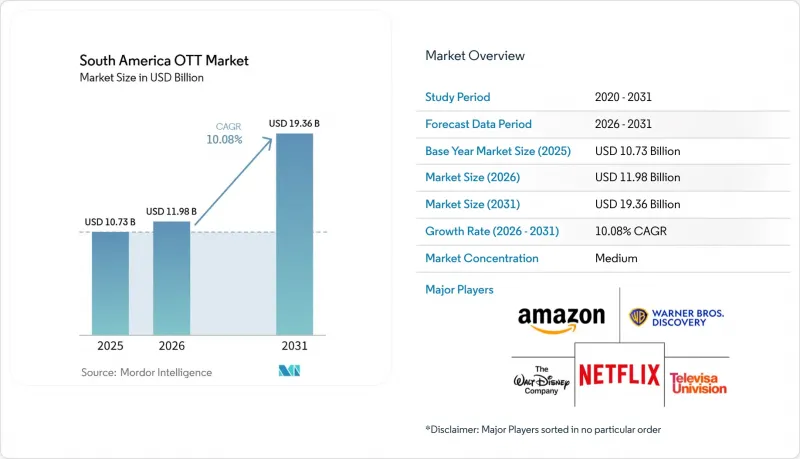
本報告按收入模式(SVOD、AVOD、TVOD、混合模式、訂閱模式和廣告模式)、設備類型(智慧型手機和平板電腦、智慧電視、筆記型電腦和桌上型電腦等)、內容類型(電影、電視劇和劇集、紀錄片等)以及國家/地區(巴西、阿根廷、哥倫比亞、智利、秘魯和其他南美國家)進行細分。市場預測以美元計價。
南美洲OTT市場趨勢與洞察
智慧電視和連網型設備的普及率不斷提高
智慧螢幕正在改變南美洲家庭使用OTT(網路電視)市場的方式。預計到2026年,南美智慧電視在連網家庭中的普及率將達到65-70%。屆時,智慧電視的安裝量預計將達到1.93億台,其中83.5%預計將處於連網狀態。預計到2026年,聯網電視的廣告收入將達到4.5億美元。 2026年,TCL、海信和TPV三家廠商合計將佔據智慧型電視市場21%的佔有率,進而降低更換成本。電信業者提供的包含光纖、機上盒和連網型設備的配套服務,將使即使是中等收入家庭也能更輕鬆地在大螢幕上觀看串流內容。
加速巴西和哥倫比亞的寬頻普及率
寬頻普及率的提升顯著降低了南美OTT市場影片串流服務的門檻。到2025年,95%的家庭將接上網際網路,農村地區的網路連線差距將從2016年的41.5個百分點縮小至7.8個百分點。在哥倫比亞,2024年第四季新增光纖連線450萬個,較上一季成長19.5%。屆時,光纖連線佔該國固定網路連線的49.5%。智利、哥倫比亞和哥斯大黎加的光纖用戶數量在2020年至2024年間成長了258%,到2025年,南美光纖基礎設施的投資額將超過50億美元。雖然主要城市以外地區網路存取的改善將使平台能夠觸及更多潛在用戶,但服務的可負擔性仍然是決定網路用戶是否會成為付費用戶的關鍵因素。
多平台家庭中的“訂閱疲勞”
儘管串流媒體需求仍然普遍,但訂閱疲勞正在抑制消費。到2025年底,14%的串流媒體用戶在過去六個月內至少取消了一項服務。這一趨勢反映出用戶使用習慣的轉變是為了配合新片上映,而非永久放棄串流媒體。在巴西,價格上漲和內容碎片化導致39%的消費者計劃在2025年前至少取消一項訂閱。因此,南美OTT市場面臨著在大量新片上映的同時維持用戶黏性的壓力。捆綁套餐可以簡化家庭支出,但也可能導致用戶控制權轉移到零售商、營運商或其他聚合商手中。這意味著客戶維繫不僅取決於平台的內容庫,還取決於更廣泛的服務關係。
細分市場分析
到2025年,SVOD將佔據南美OTT市場50.48%的佔有率,成為最大的收入模式。這一成長反映了隨著全球和區域服務商在巴西和阿根廷不斷擴充內容庫,訂閱用戶習慣的形成。到2025年,巴西的訂閱影片市場以收益為準將位居全球第五,顯示付費觀看在該國擁有強大的影響力。 TVOD仍然適用於消費者付費獲取高價值新內容的場景。混合訂閱和廣告支援型服務滿足了希望使用多種服務但又不想為每項服務單獨支付全價的家庭用戶的需求。這些模式之所以重要,是因為它們可以將每月的娛樂支出分攤到整個套餐中。
預計從2026年到2031年,AVOD(廣告支援的視訊點播)將以11.42%的複合年成長率成長,成為南美OTT市場成長最快的營收模式。 2026年初,巴西是FAST(付費電視服務)使用率最高的國家之一,分別為40%和53%。到2025年,AVOD和FAST服務將佔該國串流媒體收入的37%。同樣在2025年,40%的南美用戶開始為他們之前免費使用的服務付費。這正是服務提供者維持免費和低成本存取選項的原因。雖然這種模式可以吸引新用戶,但廣告需求和合適的本地節目內容仍然是其盈利的關鍵。
其他好處:
- Excel格式的市場預測(ME)表
- 3個月的分析師支持
目錄
第1章:引言
- 研究假設和市場定義
- 調查範圍
第2章:調查方法
第3章執行摘要
第4章 市場狀況
- 市場概覽
- 宏觀經濟因素對市場的影響
- 市場促進因素
- 智慧電視和連網裝置的滲透率不斷提高
- 加速巴西和哥倫比亞的寬頻普及率
- 快速轉向廣告支援型串流媒體和混合盈利模式
- 對體育賽事直播和活動主導串流媒體的強勁需求
- 擴大本地語言原創內容的規模,並按地區商品搭售
- 提高價格敏感型家庭對FAST的接受度
- 市場限制因素
- 多平台家庭的訂閱疲勞
- 權利分配和內容授權費用
- 消費性盜版和未經授權的內容
- 主要都會區以外地區所得分配不均
- 產業價值鏈分析
- 監理情勢
- 技術展望
- 波特五力分析
第5章 市場規模與成長預測
- 按收入模式
- SVOD
- AVOD
- TVOD
- 混合模式、訂閱模式、廣告
- 依設備類型
- 智慧型手機和平板電腦
- 智慧電視
- 筆記型電腦和桌上型電腦
- 其他設備類型
- 按內容類型
- 電影和影像作品
- 電視節目和劇集內容
- 記錄
- 其他內容類型
- 國家
- 巴西
- 阿根廷
- 哥倫比亞
- 智利
- 秘魯
- 其他南美國家
第6章 競爭情勢
- 市場集中度
- 策略趨勢
- 市佔率分析
- 公司簡介
- Netflix, Inc.
- Amazon.com, Inc.
- The Walt Disney Company
- Warner Bros. Discovery, Inc.
- TelevisaUnivision, Inc.
- Globo Comunicacao e Participacoes SA
- America Movil, SAB de CV
- Paramount, a Skydance Corporation
- Apple Inc.
- Alphabet Inc.
- Roku, Inc.
- Samsung Electronics Co., Ltd.
- DAZN Group Limited
- Vrio Corp.
- MercadoLibre, Inc.
- Telecom Argentina SA
- Millicom International Cellular SA
- Telefonica, SA
- MUBI, Inc.
第7章 市場機會與未來展望
According to Mordor Intelligence, the South America OTT market size was valued at USD 10.73 billion in 2025 and estimated to grow from USD 11.98 billion in 2026 to reach USD 19.36 billion by 2031, at a CAGR of 10.08% during the forecast period (2026-2031).
This report is Segmented by Revenue Model (SVOD, AVOD, TVOD, and Hybrid, Subscription and Ads), Device Type (Smartphones and Tablets, Smart TVs, Laptops and Desktops, and More), Content Genre (Movies and Films, TV Shows and Episodic Content, Documentaries, and More), and Country (Brazil, Argentina, Colombia, Chile, Peru, and Rest of South America). The Market Forecasts are Provided in Terms of Value (USD).
South America OTT Market Trends and Insights
Rising Smart TV and Connected Device Penetration
Connected screens are changing how households use the South America OTT market. Smart TV penetration in connected South American households reached 65-70% in 2026. The installed base is expected to reach 193 million units, with 83.5% of those units actively connected. Connected TV advertising revenue is projected to reach USD 450 million in 2026. TCL, Hisense, and TPV together held 21% of the smart TV market in 2026, supporting lower price points for replacement purchases. Telecom bundles that combine fiber, set-top boxes, and connected devices can make larger-screen streaming easier for middle-income households.
Accelerating Broadband Expansion in Brazil, and Colombia
Broadband expansion lowers a practical barrier to video streaming in the South America OTT market. In 2025, 95% of households had internet access, and the rural connectivity gap narrowed to 7.8 percentage points from 41.5 percentage points in 2016. Colombia recorded 4.5 million fiber connections in the fourth quarter of 2024, up 19.5% from the previous quarter. Fiber accounted for 49.5% of the country's fixed internet connections at that time. Fiber subscriptions across Chile, Colombia, and Costa Rica grew 258% between 2020 and 2024, while more than USD 5 billion was invested in South American fiber infrastructure during 2025. Better access outside major cities gives platforms a larger potential audience, though affordability of services still determines whether connected homes become paying users.
Subscription Fatigue Among Multi-Platform Households
Subscription fatigue limits spending even as demand for streaming remains broad. By the end of 2025, 14% of streaming subscribers had canceled at least 1 service in the prior 6 months. That pattern reflects rotation around release schedules instead of a permanent exit from streaming. In Brazil, 39% of consumers intended to cancel at least 1 subscription in 2025 after price increases and content fragmentation. The South America OTT market, therefore, faces pressure to keep users engaged between major releases. Bundles can simplify household spending, but they can also shift customer ownership toward retailers, telecom operators, or other aggregators. This makes retention depend on a broader service relationship rather than just a platform's catalog.
Other drivers and restraints analyzed in the detailed report include:
- Shift to Ad-Supported Streaming and Hybrid Monetization
- Demand for Live Sports and Event-Driven Streaming
- Fragmented Rights and Content Licensing Costs
For complete list of drivers and restraints, kindly check the Table Of Contents.
Segment Analysis
SVOD held 50.48% of South America OTT market share in 2025, making it the largest revenue model. The segment reflects subscription habits built as global and regional services expanded their libraries across Brazil, and Argentina. Brazil's subscription video market ranked fifth globally by revenue in 2025, showing the depth of established paid viewing in the country. TVOD continues to serve occasions where consumers pay for access to high-value releases. Hybrid subscription and advertising offerings serve households that want several services without paying separate full prices. These models are important because they can spread the monthly entertainment cost across a bundle.
AVOD is projected to expand at an 11.42% CAGR between 2026 and 2031, making it the fastest-growing revenue model in the South America OTT market. Brazil was among the heaviest FAST users in early 2026, with usage rates of 40% and 53%, respectively. Brazil's AVOD and FAST services generated 37% of the country's streaming revenue in 2025. 40% of South American subscribers paid for services they had previously accessed for free in 2025. This creates a reason for providers to maintain free and lower-cost access points. The model can attract new viewers, although advertising demand and the availability of suitable local programming remain important to its economics.
Complete Report Scope:
- By Revenue Model
- SVOD
- AVOD
- TVOD
- Hybrid, Subscription and Ads
- By Device Type
- Smartphones and Tablets
- Smart TVs
- Laptops and Desktops
- Other Device Types
- By Content Genre
- Movies and Films
- TV Shows and Episodic Content
- Documentaries
- Other Content Genres
- By Country
- Brazil
- Argentina
- Colombia
- Chile
- Peru
- Rest of South America
List of Companies Covered in this Report:
- Netflix, Inc.
- Amazon.com, Inc.
- The Walt Disney Company
- Warner Bros. Discovery, Inc.
- TelevisaUnivision, Inc.
- Globo Comunicacao e Participacoes S.A.
- America Movil, S.A.B. de C.V.
- Paramount, a Skydance Corporation
- Apple Inc.
- Alphabet Inc.
- Roku, Inc.
- Samsung Electronics Co., Ltd.
- DAZN Group Limited
- Vrio Corp.
- MercadoLibre, Inc.
- Telecom Argentina S.A.
- Millicom International Cellular S.A.
- Telefonica, S.A.
- MUBI, Inc.
Additional Benefits:
- The market estimate (ME) sheet in Excel format
- 3 months of analyst support
TABLE OF CONTENTS
1 INTRODUCTION
- 1.1 Study Assumptions and Market Definition
- 1.2 Scope of the Study
2 RESEARCH METHODOLOGY
3 EXECUTIVE SUMMARY
4 MARKET LANDSCAPE
- 4.1 Market Overview
- 4.2 Impact of Macroeconomic Factors on the Market
- 4.3 Market Drivers
- 4.3.1 Rising Smart TV and Connected Device Penetration
- 4.3.2 Accelerating Broadband Expansion in Brazil, and Colombia
- 4.3.3 Rapid Shift to Ad-Supported Streaming and Hybrid Monetization
- 4.3.4 Strong Demand for Live Sports and Event-Driven Streaming
- 4.3.5 Growth of Local Language Original Content and Regional Bundling
- 4.3.6 Rising FAST Adoption Across Price-Sensitive Households
- 4.4 Market Restraints
- 4.4.1 Subscription Fatigue Among Multi-Platform Households
- 4.4.2 Fragmented Rights and Content Licensing Costs
- 4.4.3 Piracy and Unauthorized Content Consumption
- 4.4.4 Uneven Monetization Outside Major Urban Centers
- 4.5 Industry Value Chain Analysis
- 4.6 Regulatory Landscape
- 4.7 Technological Outlook
- 4.8 Porter's Five Forces Analysis
- 4.8.1 Threat of New Entrants
- 4.8.2 Bargaining Power of Suppliers
- 4.8.3 Bargaining Power of Buyers
- 4.8.4 Threat of Substitutes
- 4.8.5 Competitive Rivalry
5 MARKET SIZE AND GROWTH FORECASTS (VALUE)
- 5.1 By Revenue Model
- 5.1.1 SVOD
- 5.1.2 AVOD
- 5.1.3 TVOD
- 5.1.4 Hybrid, Subscription and Ads
- 5.2 By Device Type
- 5.2.1 Smartphones and Tablets
- 5.2.2 Smart TVs
- 5.2.3 Laptops and Desktops
- 5.2.4 Other Device Types
- 5.3 By Content Genre
- 5.3.1 Movies and Films
- 5.3.2 TV Shows and Episodic Content
- 5.3.3 Documentaries
- 5.3.4 Other Content Genres
- 5.4 By Country
- 5.4.1 Brazil
- 5.4.2 Argentina
- 5.4.3 Colombia
- 5.4.4 Chile
- 5.4.5 Peru
- 5.4.6 Rest of South America
6 COMPETITIVE LANDSCAPE
- 6.1 Market Concentration
- 6.2 Strategic Moves
- 6.3 Market Share Analysis
- 6.4 Company Profiles (includes Global Level Overview, Market Level Overview, Core Segments, Financials as available, Strategic Information, Market Rank/Share, Products and Services, Recent Developments)
- 6.4.1 Netflix, Inc.
- 6.4.2 Amazon.com, Inc.
- 6.4.3 The Walt Disney Company
- 6.4.4 Warner Bros. Discovery, Inc.
- 6.4.5 TelevisaUnivision, Inc.
- 6.4.6 Globo Comunicacao e Participacoes S.A.
- 6.4.7 America Movil, S.A.B. de C.V.
- 6.4.8 Paramount, a Skydance Corporation
- 6.4.9 Apple Inc.
- 6.4.10 Alphabet Inc.
- 6.4.11 Roku, Inc.
- 6.4.12 Samsung Electronics Co., Ltd.
- 6.4.13 DAZN Group Limited
- 6.4.14 Vrio Corp.
- 6.4.15 MercadoLibre, Inc.
- 6.4.16 Telecom Argentina S.A.
- 6.4.17 Millicom International Cellular S.A.
- 6.4.18 Telefonica, S.A.
- 6.4.19 MUBI, Inc.
7 MARKET OPPORTUNITIES AND FUTURE OUTLOOK
- 7.1 White-space and Unmet-Need Assessment

 全球Over-The-Top服務市場規模、佔有率、趨勢和成長分析報告(2026-2034年)
 商業媒體服務:市場佔有率分析、產業趨勢與統計、成長預測(2026-2031 年)英國OTT:市場佔有率分析、產業趨勢與統計、成長預測(2026-2031年)美國OTT:市場佔有率分析、行業趨勢和統計數據、成長預測(2026-2031年)雲端OTT:市場佔有率分析、產業趨勢與統計、成長預測(2026-2031年)中國OTT市場:市場佔有率分析、產業趨勢與統計及成長預測(2026-2031年)印度OTT市場:市場佔有率分析、產業趨勢與統計及成長預測(2026-2031年)德國OTT:市場佔有率分析、產業趨勢與統計及成長預測(2026-2031年)OTT(Over The Top):市場佔有率分析、產業趨勢與統計數據、成長預測(2026-2031)北美OTT:市佔率分析、產業趨勢與統計及成長預測(2026-2031年)