


 |
市場調查報告書
商品編碼
2099767
HBM CoWoS 包裝產能及供需:市佔率分析、產業趨勢與統計及成長預測(2026-2031 年)HBM CoWoS Packaging Capacity and Supply-Demand - Market Share Analysis, Industry Trends & Statistics, Growth Forecasts (2026 - 2031) |
||||||

※ 本網頁內容可能與最新版本有所差異。詳細情況請與我們聯繫。
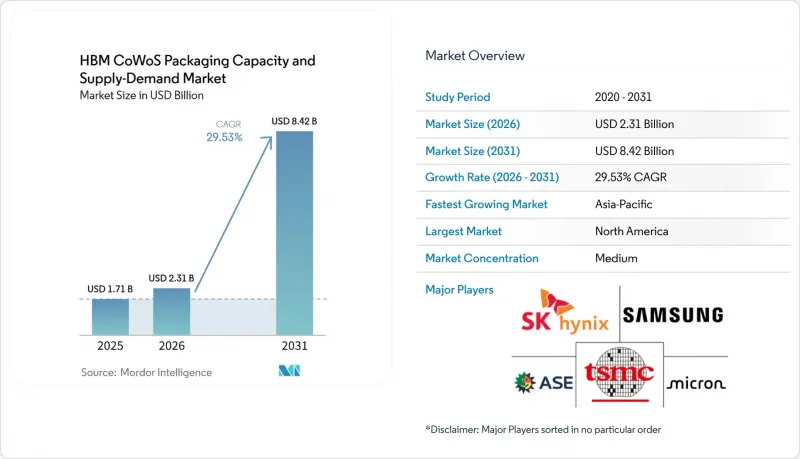
據 Mordor Intelligence 稱,HBM CoWoS 封裝產能及供需市場預計將從 2025 年的 17.1 億美元成長到 2026 年的 23.1 億美元,到 2031 年達到 84.2 億美元,預計 2026 年至 2031 年的複合年成長率為 203129.3%。
本報告按封裝技術(CoWoS-S、CoWoS-R、CoWoS-L 等)、HBM 代數(HBM3、HBM3E、HBM4 等)、封裝產能等級(每月低於 5 萬片晶圓等)、最終用戶(GPU 和 AI 晶片供應商等)、應用(應用處理器、GPU、GA等)和地區進行細分。市場預測以美元 (USD) 為單位。
全球HBM CoWoS包裝產能及供需市場趨勢與洞察
人工智慧加速器的需求超過了先進封裝的產能。
HBM CoWoS封裝產能及供需市場仍存在缺口,即人工智慧系統需求與現有經認證的CoWoS產能之間存在巨大差距。根據IEEE報告,台積電在2025年將CoWoS產能提高了106%,但由於新增產能迅速被客戶需求消化,供應鏈仍緊張。此外,台積電在2026年年度股東大會上表示,其CoWoS產能已排滿至2026年底。這表明,即使經過大規模擴產,現貨供應能力仍然有限。這一點至關重要,因為瓶頸不僅限於晶圓數量,新一代加速器往往採用更大的封裝,並在每個裝置中整合更多HBM。這一趨勢導致出貨量增加和封裝複雜性上升,從而增加了對封裝的需求。因此,儘管產能名義上有所擴張,但HBM CoWoS封裝產能及供需市場依然緊張。因此,提前下單的客戶可以確保供貨,而較晚進入市場的客戶則面臨前置作業時間更長、產品發布延遲以及產品排期柔軟性降低等挑戰。
HBM4 的日益普及導致中介層結構日益複雜,晶圓需求也隨之增加。
隨著新一代HBM的過渡,HBM共封裝(CoWoS)的整體產能和供應市場正面臨著與中介層、記憶體介面和溫度控管相關的日益嚴峻的技術挑戰。 2026年5月,SK海力士發布了其「iHBM」散熱解決方案,該方案將冷卻元件直接整合到封裝結構中,從而降低了30%的熱阻。這凸顯了記憶體小型化對封裝設計日益成長的要求。在HBM4E的客戶認證工作中也觀察到了類似的趨勢,供應商不僅專注於提高記憶體密度,還專注於散熱、堆疊可靠性和先進的封裝整合。隨著記憶體子系統尺寸的增加和發熱量的增加,中介層和周圍的封裝必須在相同的尺寸範圍內滿足更高的佈線密度和更嚴格的電氣要求。這實際上導致了晶圓需求的增加,因為更複雜的封裝需要更長的認證時間,從而增加了已知良率的壓力,並延緩了新產品投入量產所需的時間。因此,雖然 HBM CoWoS 封裝能力和供需市場受益於向 HBM4 過渡帶來的價值增加,但過渡本身卻造成了工程摩擦,並導致供應短缺持續存在。
台積電的CoWoS產能仍是阻礙因素。
HBM CoWoS封裝產能和供應市場面臨的最大短期限制因素是,高附加價值封裝流程仍然嚴重依賴單一供應商和數量有限的認證生產線。據IEEE稱,台積電計畫在2026年將約24萬至27萬片晶圓外包給OSAT合作夥伴,其中大部分剩餘產能預計將分配給Amkor和Siliconware Precision Industries,這兩家公司主要負責較為簡單的CoWoS封裝流程。雖然這種安排有助於緩解壓力,但並不能完全解決尖端封裝類型的短缺問題,因為這些封裝類型需要最先進的工藝經驗和最高級別的認證可靠性。 HBM CoWoS封裝產能和供應市場仍然受到限制,因為新的生產線在能夠實質地貢獻於供應之前,需要進行設備安裝、製程調整、客戶認證和穩定的良率保證。由於設備前置作業時間和認證週期,這個過程可能會持續數個季度,這意味著公佈的產能無法以與需求成長相同的速度轉化為實際產量。這種情況導致市場集中度持續上升,供應商優勢明顯,供應狀況從「配額主導」模式轉變為更平衡的模式進程有所延遲。
細分市場分析
2025年,CoWoS-S佔據了封裝技術領域68.31%的佔有率,這表明在基準年,HBM CoWoS封裝產能和需求市場仍然高度依賴成熟的矽中介層封裝形式。其主導地位源自於其長期的認證記錄、在人工智慧訓練系統中的廣泛應用,以及客戶無需重新設計整個封裝方案即可獲得高頻寬的成熟生產流程。此外,許多正在進行的專案已採用成熟的中介層幾何結構,這也有利於CoWoS的採購和生產規模的連續性。從實際角度來看,隨著HBM CoWoS封裝產能和需求產業在預測期內為更複雜的封裝配置做好準備,CoWoS仍然是一種旗艦封裝形式。鑑於整個人工智慧硬體週期已經面臨資源緊張和訂單週期長的問題,客戶更傾向於選擇風險較低的方案,因此CoWoS的這一地位至關重要。
目前,成長趨勢正轉向CoWoS-L,預計到2031年將以30.33%的複合年成長率成長,成為HBM CoWoS封裝產能和供需市場中大型加速器的領先規模平台。其吸引力在於其物理可擴展性,因為隨著封裝尺寸的增加和HBM負載的增加,單片中介層架構正接近其極限。這種轉變至關重要,因為封裝尺寸不再只是製造細節,而是正在成為一個直接的競爭因素。隨著運算晶片和儲存堆疊的擴展,供應商需要能夠適應更苛刻佈局的封裝形式,同時避免大規模生產中出現不可接受的良率下降。 CoWoS-R在成本敏感型設計中仍然有用,在這些設計中,全矽密度並非必要,它為市場提供了一種介於高階和低複雜度封裝之間的中間選擇。其他新興封裝形式仍處於商業化的早期階段,但隨著客戶尋求能夠減少未來對單一先進封裝架構依賴的替代方案,它們已經開始影響設計方案。因此,儘管HBM CoWoS封裝產能和供應市場不會在一夜之間完全擺脫CoWoS-S,但其價值構成比正逐漸轉向能夠支援更大、發熱量更高、記憶體密度更高的AI系統的解決方案。這種轉變也將增加對單一元件封裝面積的需求。換句話說,即使裝置出貨量的成長放緩,封裝收入也可能持續成長。這一部分錶明,HBM CoWoS封裝產能和供應市場的技術選擇越來越不僅取決於成本差異,還取決於封裝的可擴展性限制。
2025年,HBM3E在HBM各代產品市場中佔據55.73%的以金額為準,成為基準年HBM CoWoS封裝產能和供需市場中最暢銷的產品。這一結果反映了HBM3E在持續進行的AI加速器專案中的廣泛應用,以及較長的認證週期促使客戶在初始部署後繼續使用其選擇的記憶體和封裝配置。一旦中介層、散熱路徑和HBM堆疊配置整體得到檢驗,客戶通常不會立即做出更改。因此,即使供應商將研發重點轉向下一代產品,對HBM3E的需求仍持續到2026年。因此,HBM2、HBM2E和HBM3主要依靠現有部署而非新的策略動力繼續留在市場上。
HBM4是成長最快的細分市場,預計到2031年將以30.42%的複合年成長率成長,並且是HBM CoWoS封裝市場的主要價值創造驅動力。這不僅歸功於記憶體速度的提升,還得益於封裝、散熱系統以及整個認證藍圖所推動的大規模重新設計工作。新一代HBM促使供應商將散熱、可靠性和封裝整合視為產品差異化的關鍵要素,SK海力士宣布其2026年iHBM散熱設計便印證了這一點。因此,向HBM4的過渡將比典型的記憶體升級產生更大的經濟影響,因為它將改變封裝的設計方式和量產認證的速度。下一代記憶體協同設計的HBM CoWoS封裝產能和供需市場規模正在擴大。這是因為每個專案都需要更先進的工程技術、記憶體廠商和代工廠之間更緊密的合作,以及整個組裝過程中更嚴格的製程控制。同時,HBM3E計畫的現有基礎設施形成了一個過渡期,新舊代產品相互交疊,避免了需求的突然轉變。這種交疊增加了產能規劃和保障的複雜性,同時也增強了過渡期內的收入穩定性。因此,HBM CoWoS封裝產能和供應市場受益於產能的持續性和升級壓力。這是因為成熟項目的出貨仍在繼續,而更先進的項目則推高了封裝的平均單價。這一部分錶明,記憶體世代更迭不再只是背景技術變革,而是正在成為整個HBM CoWoS封裝產能和供應市場定價和分配的重要因素。
區域分析
到2025年,亞太地區將佔據人腦記憶體(HBM)協同世界(CoWoS)封裝產能和供需市場的79.84%,鞏固其在當前供應、製造深度和生態系統協調方面的中心地位。台灣的封裝生產線、韓國的HBM生產基地以及日本在關鍵基板、化學品和設備供應方面的作用,都為此地位提供了有力支撐。亞太地區的HBM協同世界封裝產能和供需市場規模持續顯著領先於其他地區,原因在於,早在當前人工智慧熱潮加速發展之前,從記憶體到封裝的整個供應鏈就已經集中在該地區。這種集中化帶來了結構性的製造優勢,而競爭地區才剛開始透過政策和新的投資計畫做出應對。
台灣在亞太地區保持著核心地位,因為高附加價值的CoWoS(全晶片封裝)趨勢與台積電最成熟的封裝基礎設施和客戶關係最為密切。韓國也加強了其市場地位,因為記憶體封裝不僅對DRAM產量,而且對最終系統的效能都變得越來越重要。 2026年7月,三星電子和SK海力士宣布計劃在韓國忠清道郡建造一座HBM封裝製造工廠,這是總額達392兆韓元(約2,525億美元)的產業投資計畫的一部分。這進一步加強了該地區擴大封裝規模的努力。這對HBM CoWoS封裝產能和供需市場具有重大影響,因為優勢平衡正在從僅僅領先於前端製程轉向更緊密地整合記憶體和後端製程。中國仍然是潛在需求的主要中心,但對封裝製造商的出口限制和許可要求仍然限制了有多少需求能夠轉化為實際可用的尖端封裝方案。因此,雖然亞太地區保持了其優勢,但這種優勢日益被台灣以代工主導的封裝深度和韓國在記憶體相關封裝領域不斷擴大的雄心所分割。
北美是成長最快的地區,預計到2031年,HBM CoWoS封裝市場將以30.44%的複合年成長率成長。這一區域成長主要得益於政府的直接投入、國內戰略項目以及客戶對靠近合作夥伴供應鏈和超大規模需求中心的封裝地點的偏好。 2025年1月的NAPMP津貼以及2024年12月針對SK海力士和安靠的CHIPS獎勵進一步明確了國內先進封裝規模化發展的路徑。 2026年6月,台積電與安靠在亞利桑那州建立的合作關係,建構了一個連接代工廠需求與本地封裝和測試業務的長期運作架構。在本報告期間內,歐洲在封裝領域保持著一定的直接地位,而南美和中東及非洲地區由於缺乏可比擬的半導體製造基礎設施,市場佔有率仍然相對小規模。
其他好處:
- Excel格式的市場預測(ME)表
- 3個月的分析師支持
目錄
第1章:引言
- 研究假設和市場定義
- 調查範圍
第2章:調查方法
第3章執行摘要
第4章 市場狀況
- 市場概覽
- 宏觀經濟因素對市場的影響
- 市場促進因素
- 人工智慧加速器的需求超過了先進封裝的產能。
- HBM4 的日益普及導致中介層結構日益複雜,對晶圓的需求也隨之增加。
- 與超大規模資料中心業者營運商合作設計及長期容量預留的趨勢
- 政府推出支援措施,促進記憶體和先進封裝技術的擴展
- 跨區域封裝和記憶體多來源採購
- 過渡到 CoWoS-L 技術提高了每個晶圓的封裝位元輸出量。
- 市場限制因素
- 台積電的CoWoS產能仍是最大的阻礙因素。
- 隨著堆疊高度的增加,TSV產量的下降變得更加明顯。
- 高頻寬和高堆疊層數下的熱密度限制。
- 出口限制和認證程序延誤正在減緩中國主導的需求轉移。
- 供應鏈分析
- 監理情勢
- 技術展望
- 波特五力分析
第5章 市場規模與成長預測
- 產品技術
- CoWoS-S
- CoWoS-R
- CoWoS-L
- 其他包裝技術
- 按世代分類的 HBM
- HBM2 和 HBM2E
- HBM3
- HBM3E
- HBM4
- HBM4E 及後續版本
- 按層級分類的包裝容量
- 每月發行量不足5萬份
- 每月50,000至99,999張
- 每月產量為 10 萬至 14.9999 萬片晶圓
- 每月生產超過15萬片晶圓
- 最終用戶
- GPU 和 AI 晶片供應商
- 超大規模資料中心業者雲端服務供應商/雲端服務供應商
- 半導體公司(無晶圓廠和IDM)
- 網路和通訊設備供應商
- 汽車半導體供應商
- 航太和國防電子
- 透過使用
- 人工智慧加速器
- 高效能運算
- GPU
- FPGA
- 網路和資料中心處理器
- 應用程式處理器
- 按地區
- 北美洲
- 美國
- 加拿大
- 墨西哥
- 歐洲
- 德國
- 英國
- 法國
- 義大利
- 其他歐洲國家
- 亞太地區
- 中國
- 日本
- 韓國
- 台灣
- 印度
- 其他亞太國家
- 南美洲
- 中東和非洲
- 北美洲
第6章 競爭情勢
- 市場集中度
- 策略趨勢
- 市佔率分析
- 公司簡介
- Taiwan Semiconductor Manufacturing Company Limited
- SK hynix Inc.
- Samsung Electronics Co., Ltd.
- Micron Technology, Inc.
- ASE Technology Holding Co., Ltd.
- Amkor Technology, Inc.
- Intel Corporation
- JCET Group Co., Ltd.
- Powertech Technology Inc.
- Siliconware Precision Industries Co., Ltd.
- Tongfu Microelectronics Co., Ltd.
- Nepes Corporation
- Hana Micron Inc.
- GlobalFoundries Inc.
- UMC
- Applied Materials, Inc.
- Tokyo Electron Limited
- Cadence Design Systems, Inc.
- Synopsys, Inc.
- Broadcom Inc.
第7章 市場機會與未來展望
According to Mordor Intelligence, the HBM coWoS packaging capacity and supply-demand market size is expected to increase from USD 1.71 billion in 2025 to USD 2.31 billion in 2026 and reach USD 8.42 billion by 2031, growing at a CAGR of 29.53% over 2026-2031.
This report is Segmented by Packaging Technology (CoWoS-S, CoWoS-R, CoWoS-L, and More), HBM Generation (HBM3, HBM3E, HBM4, and More), Packaging Capacity Tier (Below 50, 000 Wafers Per Month, and More), End User (GPU and AI Chip Vendors, and More), Application (Application Processors, Gpus, Fpgas, and More), and Geography. The Market Forecasts are Provided in Terms of Value (USD).
Global HBM CoWoS Packaging Capacity and Supply-Demand Market Trends and Insights
AI Accelerator Demand Outpacing Advanced Packaging Capacity
The HBM CoWoS packaging capacity and supply-demand market is still being defined by the gap between AI system demand and the amount of qualified CoWoS output available to serve it. IEEE reported that TSMC expanded CoWoS capacity by 106% in 2025, yet the supply chain remained tight because those additions were absorbed quickly by customer demand. TSMC also stated at its 2026 annual shareholder meeting that CoWoS capacity was fully booked through the end of 2026, which shows that spot availability remained limited even after large expansion efforts. This matters because the bottleneck is not limited to wafer count alone, since each new accelerator generation tends to use larger packages and more HBM content within each device. That pattern means packaging demand rises through both shipment growth and package complexity, so the HBM CoWoS packaging capacity and supply-demand market keeps tightening even while nominal capacity grows. The result is a market where customers with early commitments secure supply, while later entrants face longer lead times, delayed launches, and less flexibility in product timing.
HBM4 Adoption Increasing Interposer Complexity and Wafer Demand
The move toward newer HBM generations is raising the technical burden placed on interposers, memory interfaces, and thermal control across the HBM CoWoS packaging capacity and supply-demand market. SK hynix introduced its iHBM thermal solution in May 2026, embedding cooling elements directly within the package structure to reduce thermal resistance by 30%, which highlights how memory scaling is now pushing packaging design into a more demanding role. The same direction is visible in customer qualification work around HBM4E, where suppliers are focusing on heat removal, stack reliability, and advanced package integration rather than simple memory density gains. As the memory subsystem becomes larger and hotter, the interposer and surrounding package have to handle more routing density and stricter electrical conditions across the same footprint. That raises wafer demand in practical terms because more complex packages take longer to qualify, place more pressure on known good yield, and slow how quickly new output becomes usable in production. The HBM CoWoS packaging capacity and supply-demand market therefore benefits from the value uplift tied to HBM4 migration, even though that same transition adds engineering friction and keeps supply tight for longer.
TSMC CoWoS Capacity Remains the Binding Constraint
The largest near-term limit on the HBM CoWoS packaging capacity and supply-demand market is that the highest-value packaging flows still depend heavily on one supplier and a narrow set of qualified lines. IEEE noted that TSMC was outsourcing an estimated 240,000 to 270,000 wafers annually to OSAT partners in 2026, with most of that overflow directed to Amkor and Siliconware Precision Industries for less complex CoWoS flows. That arrangement helps relieve pressure, but it does not fully solve the shortage for the most advanced package types that need the deepest process experience and the highest qualification confidence. The HBM CoWoS packaging capacity and supply-demand market remains constrained because every new line also needs tools, process tuning, customer certification, and stable yield before it contributes meaningfully to supply. Equipment lead times and qualification cycles stretch this process over many quarters, so announced capacity does not convert into practical output as quickly as demand is rising. This keeps the market concentrated, preserves strong supplier leverage, and delays the point at which supply conditions move from allocation-driven to more balanced.
Other drivers and restraints analyzed in the detailed report include:
- Hyperscaler Co-Design and Long-Term Capacity Reservation Behavior
- Government Incentives for Memory and Advanced Packaging Expansion
- TSV Yield Losses Rise at Higher Stack Heights
For complete list of drivers and restraints, kindly check the Table Of Contents.
Segment Analysis
CoWoS-S accounted for 68.31% of the packaging technology segment in 2025, which shows how strongly the HBM CoWoS packaging capacity and supply-demand market still relied on a proven silicon interposer format during the base year. Its leadership came from long qualification history, wide deployment in AI training systems, and a familiar production flow for customers that needed high bandwidth without redesigning the entire package concept. CoWoS-S also benefited from the fact that many active programs were already locked to established interposer geometries, which supported continuity in procurement and output. In practical terms, it remained the workhorse format while the HBM CoWoS packaging capacity and supply-demand industry prepared for a more demanding package mix over the forecast period. That position was important because customers preferred lower execution risk while the broader AI hardware cycle was already facing allocation pressure and long booking windows.
The growth direction is now shifting toward CoWoS-L, which is forecast to expand at a 30.33% CAGR through 2031 and become the main scale platform for larger accelerators in the HBM CoWoS packaging capacity and supply-demand market. Its appeal is tied to physical scalability, since larger package footprints and heavier HBM content place pressure on monolithic interposer approaches. This transition matters because package size is now becoming a direct competitive factor rather than only a manufacturing detail. As compute dies and memory stacks expand together, suppliers need packaging formats that can support more demanding layouts without making yield losses unacceptable at scale. CoWoS-R remains relevant for cost-sensitive designs where full silicon density is not essential, which gives the market an intermediate option between premium and lower-complexity flows. Other emerging formats remain earlier in their commercialization path, but they are already influencing design planning because customers want alternatives that could reduce future dependence on a single advanced package architecture. The HBM CoWoS packaging capacity and supply-demand market therefore is not moving away from CoWoS-S overnight, but the value mix is gradually shifting toward solutions that can support larger, hotter, and more memory-dense AI systems. That shift also raises package area demand per device, which means packaging revenue can keep climbing even when device unit growth slows. The segment shows how technology choice in the HBM CoWoS packaging capacity and supply-demand market is increasingly being set by package scale limits rather than by simple cost differences alone.
HBM3E held 55.73% of the HBM generation segment by value in 2025, which gave it the leading revenue position in the HBM CoWoS packaging capacity and supply-demand market during the base year. That outcome reflected its broad use in active AI accelerator programs and the long qualification cycles that keep customers on a chosen memory-package configuration after deployment begins. Once an interposer, thermal path, and HBM stack arrangement are validated together, customers are usually cautious about making immediate changes. This preserved HBM3E demand into 2026 even as suppliers moved their development attention toward later generations. HBM2, HBM2E, and HBM3 therefore remained in the mix mostly through residual deployments rather than through new strategic momentum.
HBM4 is the fastest-growing sub-segment and is projected to advance at a 30.42% CAGR through 2031, which makes it a major value driver for the HBM CoWoS packaging market. The reason is not only a memory speed increase, but also the broader redesign effort it triggers across the package, thermal system, and qualification roadmap. Newer HBM generations are pushing suppliers to treat cooling, reliability, and package integration as a larger part of product differentiation, which was clear in SK hynix's 2026 iHBM thermal launch. This is why the transition to HBM4 carries larger economic implications than a normal memory upgrade, since it changes how the package is engineered and how quickly volume can be certified. The HBM CoWoS packaging capacity and supply-demand market size for next-generation memory-linked designs rises because each program requires more engineering depth, closer memory-foundry coordination, and stronger process control across assembly stages. At the same time, the installed base of HBM3E programs creates a bridge period where old and new generations overlap, which prevents a sudden demand handoff. That overlap supports revenue resilience during the transition window, even though it also adds complexity to planning and capacity reservation. The HBM CoWoS packaging capacity and supply-demand industry therefore gains from both continuity and upgrade pressure, since mature programs keep shipping while more advanced ones raise average package value. This segment shows that memory generation shifts are becoming a central pricing and allocation force across the HBM CoWoS packaging capacity and supply-demand market rather than a background technology change.
Complete Report Scope:
- By Packaging Technology
- CoWoS-S
- CoWoS-R
- CoWoS-L
- Other Packaging Technology
- By HBM Generation
- HBM2 and HBM2E
- HBM3
- HBM3E
- HBM4
- HBM4E and Beyond
- By Packaging Capacity Tier
- Below 50,000 Wafers Per Month
- 50,000 to 99,999 Wafers Per Month
- 100,000 to 149,999 Wafers Per Month
- 150,000 Wafers Per Month and Above
- By End User
- GPU and AI Chip Vendors
- Hyperscalers / Cloud Providers
- Semiconductor Companies (Fabless & IDMs)
- Networking and Telecom Equipment Vendors
- Automotive Semiconductor Suppliers
- Aerospace and Defense Electronics
- By Application
- AI Accelerators
- High-Performance Computing
- GPUs
- FPGAs
- Networking and Data Center Processors
- Application Processors
- By Geography
- North America
- United States
- Canada
- Mexico
- Europe
- Germany
- United Kingdom
- France
- Italy
- Rest of Europe
- Asia-Pacific
- China
- Japan
- South Korea
- Taiwan
- India
- Rest of Asia-Pacific
- South America
- Middle East and Africa
- North America
Geography Analysis
Asia-Pacific held 79.84% of the HBM CoWoS packaging capacity and supply-demand market in 2025, which clearly established it as the center of present-day supply, manufacturing depth, and ecosystem coordination. This position rested on Taiwan's packaging lines, South Korea's HBM production base, and Japan's role in supplying critical substrate, chemical, and equipment inputs. The HBM CoWoS packaging capacity and supply-demand market size in Asia-Pacific remained far ahead of other regions because the full chain from memory through packaging was already concentrated there before the current AI upcycle accelerated. That concentration created a structural manufacturing advantage that competing regions are only beginning to address through policy and new investment programs.
Taiwan remained the anchor within Asia-Pacific because the highest-value CoWoS flows stayed closest to TSMC's most mature packaging infrastructure and customer relationships. South Korea also strengthened its relevance as memory packaging became more important to final system performance and not only to DRAM output. In July 2026, Samsung Electronics and SK hynix announced plans for HBM packaging fabrication facilities in South Korea's Chungcheong region as part of an industrywide KRW 392 trillion investment plan, equal to USD 252.5 billion, which reinforced the region's push into packaging scale. This matters for the HBM CoWoS packaging capacity and supply-demand market because the balance of advantage is shifting from front-end process leadership alone toward tighter coordination between memory and back-end integration. China remained a large potential demand center, but export controls and packager approval requirements continued to limit how much of that demand could translate into accessible leading-edge packaging programs. The result was that Asia-Pacific kept its dominance, but that dominance was increasingly split between Taiwan's foundry-led packaging depth and South Korea's expanding memory-linked packaging ambitions.
North America is the fastest-growing region and is projected to expand at a 30.44% CAGR through 2031 in the HBM CoWoS packaging market. The region's growth is being supported by direct public funding, strategic domestic projects, and customer preference for packaging locations closer to allied supply chains and hyperscale demand centers. The January 2025 NAPMP awards and the December 2024 CHIPS incentives for SK hynix and Amkor created a clearer domestic path for advanced packaging scale-up. The June 2026 TSMC-Amkor partnership in Arizona added a long-term operating framework that linked foundry demand with local packaging and test execution. Europe still held a modest direct packaging position in this report period, while South America and the Middle East and Africa remained small because they lacked comparable semiconductor manufacturing infrastructure.
- Taiwan Semiconductor Manufacturing Company Limited
- SK hynix Inc.
- Samsung Electronics Co., Ltd.
- Micron Technology, Inc.
- ASE Technology Holding Co., Ltd.
- Amkor Technology, Inc.
- Intel Corporation
- JCET Group Co., Ltd.
- Powertech Technology Inc.
- Siliconware Precision Industries Co., Ltd.
- Tongfu Microelectronics Co., Ltd.
- Nepes Corporation
- Hana Micron Inc.
- GlobalFoundries Inc.
- UMC
- Applied Materials, Inc.
- Tokyo Electron Limited
- Cadence Design Systems, Inc.
- Synopsys, Inc.
- Broadcom Inc.
Additional Benefits:
- The market estimate (ME) sheet in Excel format
- 3 months of analyst support
TABLE OF CONTENTS
1 INTRODUCTION
- 1.1 Study Assumptions and Market Definition
- 1.2 Scope of the Study
2 RESEARCH METHODOLOGY
3 EXECUTIVE SUMMARY
4 MARKET LANDSCAPE
- 4.1 Market Overview
- 4.2 Impact of Macroeconomic Factors on the Market
- 4.3 Market Drivers
- 4.3.1 AI Accelerator Demand Outpacing Advanced Packaging Capacity
- 4.3.2 HBM4 Adoption Increasing Interposer Complexity and Wafer Demand
- 4.3.3 Hyperscaler Co-Design and Long-Term Capacity Reservation Behavior
- 4.3.4 Government Incentives for Memory and Advanced Packaging Expansion
- 4.3.5 Multi-Sourcing of Packaging and Memory Across Regions
- 4.3.6 CoWoS-L Migration Raising Packaged Bit Output per Wafer
- 4.4 Market Restraints
- 4.4.1 TSMC CoWoS Capacity Remains the Binding Constraint
- 4.4.2 TSV Yield Losses Rise at Higher Stack Heights
- 4.4.3 Thermal Density Limits at Higher Bandwidth and Stack Count
- 4.4.4 Export Controls and Qualification Delays Slow China-Led Demand Conversion
- 4.5 Supply Chain Analysis
- 4.6 Regulatory Landscape
- 4.7 Technological Outlook
- 4.8 Porter's Five Forces Analysis
- 4.8.1 Threat of New Entrants
- 4.8.2 Bargaining Power of Suppliers
- 4.8.3 Bargaining Power of Buyers
- 4.8.4 Threat of Substitutes
- 4.8.5 Intensity of Competitive Rivalry
5 MARKET SIZE AND GROWTH FORECASTS
- 5.1 By Packaging Technology
- 5.1.1 CoWoS-S
- 5.1.2 CoWoS-R
- 5.1.3 CoWoS-L
- 5.1.4 Other Packaging Technology
- 5.2 By HBM Generation
- 5.2.1 HBM2 and HBM2E
- 5.2.2 HBM3
- 5.2.3 HBM3E
- 5.2.4 HBM4
- 5.2.5 HBM4E and Beyond
- 5.3 By Packaging Capacity Tier
- 5.3.1 Below 50,000 Wafers Per Month
- 5.3.2 50,000 to 99,999 Wafers Per Month
- 5.3.3 100,000 to 149,999 Wafers Per Month
- 5.3.4 150,000 Wafers Per Month and Above
- 5.4 By End User
- 5.4.1 GPU and AI Chip Vendors
- 5.4.2 Hyperscalers / Cloud Providers
- 5.4.3 Semiconductor Companies (Fabless & IDMs)
- 5.4.4 Networking and Telecom Equipment Vendors
- 5.4.5 Automotive Semiconductor Suppliers
- 5.4.6 Aerospace and Defense Electronics
- 5.5 By Application
- 5.5.1 AI Accelerators
- 5.5.2 High-Performance Computing
- 5.5.3 GPUs
- 5.5.4 FPGAs
- 5.5.5 Networking and Data Center Processors
- 5.5.6 Application Processors
- 5.6 By Geography
- 5.6.1 North America
- 5.6.1.1 United States
- 5.6.1.2 Canada
- 5.6.1.3 Mexico
- 5.6.2 Europe
- 5.6.2.1 Germany
- 5.6.2.2 United Kingdom
- 5.6.2.3 France
- 5.6.2.4 Italy
- 5.6.2.5 Rest of Europe
- 5.6.3 Asia-Pacific
- 5.6.3.1 China
- 5.6.3.2 Japan
- 5.6.3.3 South Korea
- 5.6.3.4 Taiwan
- 5.6.3.5 India
- 5.6.3.6 Rest of Asia-Pacific
- 5.6.4 South America
- 5.6.5 Middle East and Africa
- 5.6.1 North America
6 COMPETITIVE LANDSCAPE
- 6.1 Market Concentration
- 6.2 Strategic Moves
- 6.3 Market Share Analysis
- 6.4 Company Profiles (includes Global Level Overview, Market Level Overview, Core Segments, Financials as available, Strategic Information, Market Rank/Share, Products and Services, Recent Developments)
- 6.4.1 Taiwan Semiconductor Manufacturing Company Limited
- 6.4.2 SK hynix Inc.
- 6.4.3 Samsung Electronics Co., Ltd.
- 6.4.4 Micron Technology, Inc.
- 6.4.5 ASE Technology Holding Co., Ltd.
- 6.4.6 Amkor Technology, Inc.
- 6.4.7 Intel Corporation
- 6.4.8 JCET Group Co., Ltd.
- 6.4.9 Powertech Technology Inc.
- 6.4.10 Siliconware Precision Industries Co., Ltd.
- 6.4.11 Tongfu Microelectronics Co., Ltd.
- 6.4.12 Nepes Corporation
- 6.4.13 Hana Micron Inc.
- 6.4.14 GlobalFoundries Inc.
- 6.4.15 UMC
- 6.4.16 Applied Materials, Inc.
- 6.4.17 Tokyo Electron Limited
- 6.4.18 Cadence Design Systems, Inc.
- 6.4.19 Synopsys, Inc.
- 6.4.20 Broadcom Inc.
7 MARKET OPPORTUNITIES AND FUTURE OUTLOOK
- 7.1 White-Space and Unmet-Need Assessment

 2026年人工智慧高頻寬記憶體全球市場報告
 用於人工智慧(AI)半導體的高頻寬記憶體(HBM)和先進封裝材料:2027-2037 年
 混合儲存立方體:市場佔有率分析、行業趨勢和統計數據、成長預測(2026-2031 年)HBM 8層堆疊與12層堆疊:市場佔有率分析、產業趨勢與統計、成長預測(2026-2031年)HPC/超級計算 HBM:市場佔有率分析、產業趨勢與統計、成長預測(2026-2031 年)中國HBM市場:市場佔有率分析、產業趨勢與統計、成長預測(2026-2031年)記憶纖維:市場佔有率分析、產業趨勢與統計、成長預測(2026-2031)
 高頻寬記憶體 (HBM) 市場預測至 2034 年—按產品類型、儲存容量、封裝技術、頻寬、應用、最終用戶和地區分類的全球分析下一代人腦記憶體:市場佔有率分析、行業趨勢和統計數據、成長預測(2026-2031 年)日本HBM市場:市場佔有率分析、產業趨勢與統計、成長預測(2026-2031年)