


 |
市場調查報告書
商品編碼
2099757
記憶纖維:市場佔有率分析、產業趨勢與統計、成長預測(2026-2031)Memory Fabric - Market Share Analysis, Industry Trends & Statistics, Growth Forecasts (2026 - 2031) |
||||||

※ 本網頁內容可能與最新版本有所差異。詳細情況請與我們聯繫。
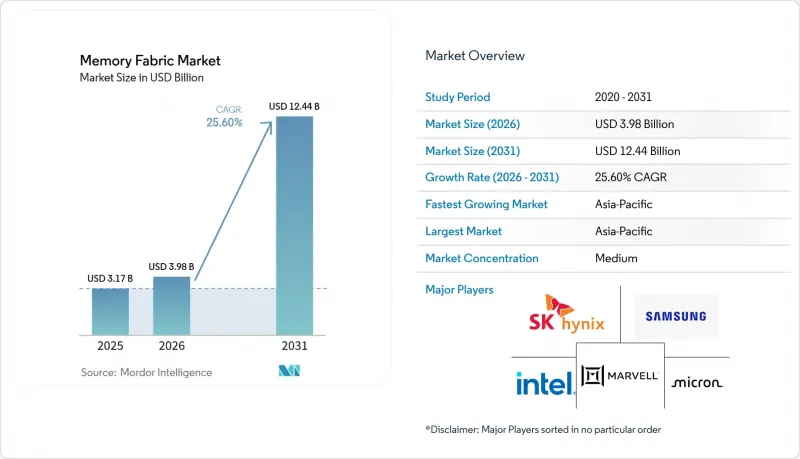
根據 Mordor Intelligence 預測,記憶織物市場規模將從 2025 年的 31.7 億美元和 2026 年的 39.8 億美元成長到 2031 年的 124.4 億美元,2026 年至 2031 年的複合年成長率為 25.60%。
本報告按 HBM 代數(HBM3、HBM4 及其他)、堆疊高度(8 層、12 層及其他)、單堆疊記憶體容量(最高 16 GB、16 GB 至 24 GB 及其他)、先進封裝整合架構(3D 邏輯記憶體整合及其他)、應用程式(例如 AI 訓練)、最終用戶(例如超大規模資料中心業者服務供應商。市場預測以美元 (USD) 為單位。
全球儲存媒體市場趨勢與洞察
人工智慧 (AI) 推理中的記憶體瓶頸正在推動對 HBM 的頻寬需求。
從模型訓練到大規模推理的轉變正推動記憶體架構市場進入一個頻寬、延遲以及加速器數量都至關重要的階段。根據美光科技的報告,基於代理的人工智慧工作負載對鍵值快取的移動提出了極高的負載,在10,000個並發請求的情況下,鍵值快取的需求量達到了基準的6.07倍。這解釋了為什麼隨著並發執行數量的增加,記憶體負載會迅速增加。報告顯示,HBM4的理論頻寬是HBM3E的2.82倍,在計算資源預算固定的情況下,可將基於代理的人工智慧工作負載的吞吐量提高高達2.63倍。三星也表示,其商用HBM4的單棧吞吐量已達到3.3 TB/s,證實了供應商已經開始調整其產品以適應這種新的需求。隨著情境長度和請求量的持續成長,記憶體架構市場正受到持續採購需求的驅動,而非一次性升級。即使僅僅升級運算能力已不足以解決實際部署中的瓶頸,這種趨勢也為記憶體結構市場的持續需求奠定了基礎。
基於 CXL 的記憶體池化技術可以減少超大規模環境中的空閒容量。
CXL 記憶體池化技術為記憶體架構市場開闢了新的擴展途徑,因為它解決了伺服器中未充分利用的記憶體容量問題。發表在 2025 年 IEEE 並行與分散式系統彙刊上的一篇論文指出,記憶體成本在典型的計算伺服器中可佔總擁有成本 (TCO) 的 44%,並表明 CXL 記憶體分層技術可以透過在同一位置的容器之間動態重新分配內存,將生產工作負載的吞吐量提高至多 1.7 倍。這項成果意義重大,因為它將記憶體從固定的本地資產轉變為共用的基礎設施資源,從而避免將所有工作負載放在成本最高的本地 DRAM 上,提高了記憶體利用率。 Marvell 已透過 Structera S 30260 交換器支援此方向,可為機架層級記憶體池化設計提供 4 TB/s 的總頻寬和亞微秒級的記憶體存取延遲。這意味著,對熱層HBM的需求和對更廣泛容量層CXL池化的需求可以同步擴展,而不是相互替代。因此,記憶體架構市場的擴張不僅得益於更快的堆疊,也得益於更廣泛的系統結構,這些架構能夠更有效率地重複使用和重新分配記憶體。
先進 CXL 技術的商用供應有限,限制了其短期內的應用。
由於最先進的CXL技術尚未在商用伺服器中全面部署,記憶體架構市場仍面臨時間限制。研究表明,CXL 3.0的樣品交付和初始認證階段將持續到2026年中期,預計2026年的實際銷售將主要限於CXL 2.0的單主機記憶體擴展。 Marvell已宣布將於2026年第三季開始向客戶提供其Structera S 30260 CXL 3.0交換器的樣品,這意味著全機架規模的記憶體架構仍然取決於CPU和記憶體擴展器的全面就緒情況。 CXL聯盟也在繼續進行互通性測試和一致性檢驗項目,這將在全面部署之前增加一個平台級認證週期。這種時間滯後阻礙了高價值的池化和共用用例的實現,而這些用例原本可以在短期內加速記憶體架構市場的成長。此外,由於大規模通訊業者更容易在其正在進行的基礎設施計劃中消化認證延遲,因此企業採用率將落後於超大規模資料中心業者營運商的採用率。
細分市場分析
預計到2031年,HBM4E和下一代HBM將以26.46%的最高複合年成長率成長。同時,HBM3E在2025年佔據了50.67%的記憶體架構市場。這種構成比反映了市場正處於轉型期,現有部署基礎仍支撐著當前的收入,而未來的需求已轉向速度更快、密度更高的堆疊。 HBM3E之所以能夠保持主導地位,是因為許多在2024年和2025年部署的訓練叢集仍然按照正常的3-5年更新周期運作。這些系統繼續滿足許多運作中部署的需求,尤其是在已經確定採購基於HBM3E的加速器平台的情況下。同時,下一代AI加速器的發展藍圖也明確地推動記憶體架構市場轉型為HBM4級產品。
2026年6月,SK海力士宣布已交付採用先進MR-MUF封裝技術的12層HBM4E樣品。本產品單腳傳輸速率達16Gbps,容量為48GB,與HBM4相比,能源效率提升超過20%,耐熱性提升17%。三星宣布已於2026年2月開始交付商用HBM4,而美光在2026年GTC大會上表示,已開始為NVIDIA Vera Rubin量產36GB 12層HBM4晶片,頻寬超過2.8TB/s。 ISSCC 2026的一篇論文也指出,HBM4晶片本身俱備更先進的校準和測試功能,顯示其技術飛躍遠不止於頻寬那麼簡單。雖然老一代的HBM3、HBM2E及更早型號仍應用於傳統高效能運算、專業視覺化和其他低頻寬環境,但隨著平台藍圖的向上發展,它們在記憶體架構產業中的作用正在逐漸減弱。製造依賴性也在發生變化,因為HBM4採用4nm邏輯晶片,這意味著其量產準備工作與更先進代工廠的生產能力之間的聯繫比前幾代產品更加緊密。
預計到2031年,16層及以上規格的市場將以26.79%的複合年成長率成長,而8層規格在2025年佔據了42.37%的市場佔有率。 8層規格之所以能保持其主導地位,是因為它符合HBM3E 24GB標準,而該標準是到2025年部署的大多數AI加速器的基礎。這為記憶體架構市場提供了穩定的商業結構、成熟的良率、成熟的封裝技術以及廣泛的部署記錄。目前,12層規格是HBM4生產的主要優勢,尤其體現在2026年和2027年即將量產的36GB堆疊產品上。然而,隨著客戶對單堆疊48GB或更高容量的需求不斷成長,平台需求將超過12層規格的容量。
三星宣布將於2026年交付48GB 16層HBM4樣品,美光也已交付了類似的48GB 16層HBM4樣品。這證實了該格式已從藍圖階段進入客戶檢驗階段。應用材料公司補充道,其「Producer Avila 2」PECVD系統旨在支援12層、16層以及未來更高堆疊結構的可靠堆疊。這顯示良率支持正隨著堆疊高度目標的實現而同步發展。雖然低於4層的堆疊結構在邊緣AI推理和注重成本的部署中仍然發揮作用,但隨著主流加速器設計對更大容量的需求,它們的佔有率正在萎縮。因此,記憶體結構市場正從幾何形狀主導、商業性便利的方式轉向平台需求主導的方式。這種轉變意義重大,因為堆疊層的增加既增加了商機,也增加了整個供應鏈的工藝複雜性。
區域分析
預計到2025年,亞太地區將以42.33%的市佔率引領儲存媒體市場,並在2031年之前維持27.44%的複合年成長率。這種雙重領先地位反映了產能和需求成長都集中在該地區的事實。韓國仍然是市場中心,三星和SK海力士佔據了全球HBM供應的大部分佔有率,兩家公司都已提前製定了HBM4和HBM4E的藍圖,計劃於2026年完成。台灣也在加強在亞太地區的地位,因為先進的封裝能力對於HBM和AI加速器的商業化整合至關重要。中國透過超大規模資料中心業者和雲端運算的採用推動了強勁的需求,但對先進設備的監管仍然限制了國內HBM供應在草案階段的擴張。
由於超大規模資料中心業者的投資、處理器平台的主導以及CXL生態系統的發展,北美仍是記憶體架構市場第二大區域市場。此外,美國在平台標準和系統設計方面也處於主導,這得益於活躍於CPU、控制器、交換器和記憶體產品領域的眾多公司,包括英特爾、美光、Marvell以及其他基礎設施供應商。英特爾至強6處理器對CXL的原生支援以及交換器層產品的積極商業化,進一步鞏固了北美作為分散式記憶體系統主要設計和部署中心的地位。因此,即使大部分製造活動集中在亞太地區,北美仍主導著技術發展方向。
歐洲在記憶體架構市場中扮演著戰略性角色,這體現在超級運算、企業部署和基於標準的伺服器升級等方面。 EuroHPC支援的部署和其他機構主導的高效能運算專案正在幫助維持對基於HBM的加速器的需求,尤其是在性能目標接近百萬兆級次級要求時。南美洲和中東及非洲地區仍處於該市場的早期階段,其成長更多地受到雲端建設和資料中心擴張的驅動,而非本地HBM供應鏈的擴張。儘管預計到2031年這些地區的市場規模將有所成長,但對尖端人工智慧基礎設施的大部分投資預計仍將集中在亞太和北美地區。
其他好處:
- Excel格式的市場預測(ME)表
- 3個月的分析師支持
目錄
第1章:引言
- 研究假設和市場定義
- 調查範圍
第2章:調查方法
第3章執行摘要
第4章 市場狀況
- 市場概覽
- 市場促進因素
- 人工智慧推理中的記憶體瓶頸
- 基於 CXL 的記憶體池會降低空閒容量。
- 超大規模資料中心的總擁有成本 (TCO) 壓力
- CPU、記憶體和交換器廠商採用開放標準。
- 由於記憶體擴容,現有伺服器需要升級
- 「記憶體即服務」架構的出現
- 市場限制因素
- 下一代 CXL 的商業化應用受到限制。
- 硬體、韌體和軟體堆疊整合的複雜性。
- 多供應商生態系統中的檢驗和互通性風險
- 高度依賴資料中心更新周期和資本支出核准。
- 供應鏈分析
- 監理情勢
- 技術展望
- 波特五力分析
第5章 市場規模與成長預測
- 按世代分類的 HBM
- HBM2E 及更早世代
- HBM3
- HBM3E
- HBM4
- HBM4E 和下一代 HBM
- 按堆疊高度
- 4步或更少
- 8-High
- 12-High
- 16步或更多
- 每個堆疊的記憶體容量
- 最高可達 16GB
- 16 GB~24 GB
- 24 GB~36 GB
- 36 GB 或更多
- 先進封裝整合架構
- 使用 2.5D 矽中介層的整合
- 2.5D橋接或基於RDL的先進封裝
- 3D邏輯記憶體整合
- 其他先進的異質整合架構
- 透過使用
- 人工智慧訓練
- 人工智慧推理
- 高效能運算和超級運算
- 資料中心分析與記憶體內運算
- 網路和通訊基礎設施
- 專業圖形和視覺化
- 最終用戶
- 超大規模資料中心業者和雲端服務供應商
- AI雲端和GPU即服務供應商
- 資料中心和企業基礎設施供應商
- 研究機構和超級計算中心
- 半導體和加速器製造商
- 電信和網路設備供應商
- 政府、國防和航太機構
- 按地區
- 北美洲
- 美國
- 加拿大
- 墨西哥
- 歐洲
- 德國
- 英國
- 法國
- 義大利
- 其他歐洲國家
- 亞太地區
- 中國
- 日本
- 韓國
- 印度
- 東南亞
- 其他亞太國家
- 南美洲
- 中東和非洲
- 北美洲
第6章 競爭情勢
- 市場集中度
- 策略趨勢
- 市佔率分析
- 公司簡介
- Intel Corporation
- Advanced Micro Devices, Inc.
- Samsung Electronics Co., Ltd.
- SK hynix Inc.
- Micron Technology, Inc.
- Marvell Technology, Inc.
- Astera Labs, Inc.
- Montage Technology Co., Ltd.
- Credo Technology Group Holding Ltd.
- Rambus Inc.
- Microchip Technology Incorporated
- Teledyne Technologies Incorporated
- Dell Technologies Inc.
- Lenovo Group Limited
- Super Micro Computer, Inc.
- SMART Modular Technologies, Inc.
- Innodisk Corporation
- ScaleFlux, Inc.
- Enfabrica, Inc.
- MemVerge, Inc.
- H3 Platform, Inc.
- XConn Technologies, Inc.
- Penguin Solutions, Inc.
第7章 市場機會與未來展望
According to Mordor Intelligence, the memory fabric market size is projected to expand from USD 3.17 billion in 2025 and USD 3.98 billion in 2026 to USD 12.44 billion by 2031, registering a CAGR of 25.60% between 2026 to 2031.
This report is Segmented by HBM Generation (HBM3, HBM4, and More), Stack Height (8-High, 12-High, and More), Memory Capacity Per Stack (Up To 16 GB, 16 GB To 24 GB, and More), Advanced Packaging Integration Architecture (3D Logic-Memory Integration, and More), Application (AI Training, and More), End User (Hyperscalers and CSPs, and More), and Geography. The Market Forecasts are Provided in Terms of Value (USD).
Global Memory Fabric Market Trends and Insights
Artificial Intelligence Inference Memory Bottlenecks Drive HBM Bandwidth Demand
The shift from model training toward large-scale inference is pushing the memory fabric market into a phase where bandwidth and latency matter as much as accelerator count. Micron reported that agentic AI workloads place sharply higher pressure on key-value cache movement, with KV-cache demand reaching 6.07x baseline at 10,000 concurrent requests, which shows why memory pressure rises faster as concurrency increases. The same paper showed that HBM4 delivers 2.82x higher peak theoretical bandwidth than HBM3E and supports throughput gains of up to 2.63x for agentic AI workloads at fixed compute budgets. Samsung also stated that its commercial HBM4 reached 3.3 TB/s per stack, which confirms that suppliers are already aligning products to this new demand profile. As context lengths and request volumes keep rising together, the memory fabric market is being pulled by a recurring procurement need instead of a one-time refresh. That pattern gives the memory fabric market a demand base that stays active even when compute upgrades alone no longer solve real deployment bottlenecks.
CXL-Based Memory Pooling Reduces Stranded Capacity In Hyperscale Environments
CXL pooling is giving the memory fabric market a separate expansion path because it addresses unused memory capacity that remains locked inside underutilized servers. A 2025 IEEE Transactions on Parallel and Distributed Systems paper noted that memory can represent up to 44% of the total cost of ownership in typical compute servers, and it showed that CXL memory tiering can improve throughput by up to 1.7x for production workloads through dynamic reallocation across co-located containers. That result matters because it changes memory from a fixed local asset into a shared infrastructure resource, which improves utilization without requiring all workloads to sit on the highest-cost local DRAM footprint. Marvell added switch-layer support to this direction with its Structera S 30260, which delivers 4 TB/s aggregate bandwidth and sub-microsecond memory access latency for rack-scale pooling designs. This means HBM demand at the hot tier and CXL pooling at the broader capacity tier can expand together rather than replace one another. As a result, the memory fabric market is increasing not only by faster stacks, but also by wider system architectures that can reuse and redistribute memory more efficiently.
Limited Commercial Availability Of Advanced CXL Generations Constrains Near-Term Adoption
The memory fabric market still faces a timing constraint because the most advanced CXL generations are not yet in full commercial server deployment. The input shows that CXL 3.0 remained in sampling and early qualification through mid-2026, which limited real 2026 revenue mostly to CXL 2.0 single-host memory expansion. Marvell stated that customer sampling for its Structera S 30260 CXL 3.0 switch begins in Q3 2026, which means full rack-scale memory fabrics still depend on broader CPU and memory-expander readiness. The CXL Consortium also continues to run plugfests and conformance programs, and that adds platform-level qualification cycles before broad deployment can move ahead. This timing gap delays the higher-value pooling and sharing cases that would otherwise widen the memory fabric market faster in the short term. It also keeps enterprise adoption behind hyperscaler adoption, because larger operators can absorb qualification delays more easily within ongoing infrastructure programs.
Other drivers and restraints analyzed in the detailed report include:
- Total Cost Of Ownership Pressure In Hyperscale Data Centers Accelerates Adoption
- Open Standards Adoption Across CPU, Memory, And Switch Vendors Enables Interoperability
- Integration Complexity Across Hardware, Firmware, And Software Stacks Slows Deployment
For complete list of drivers and restraints, kindly check the Table Of Contents.
Segment Analysis
HBM4E and next-generation HBM are projected to grow at the fastest CAGR of 26.46% through 2031, while HBM3E held 50.67% of the memory fabric market share in 2025. That mix reflects a market in transition, where current revenue is still anchored in the installed base, but future demand is already shifting toward faster and denser stacks. The memory fabric market kept HBM3E in a leading position because many training clusters deployed in 2024 and 2025 continue to run on normal 3-5 year refresh cycles. Those systems still meet the needs of many active deployments, especially where procurement has already been locked to HBM3E-based accelerator platforms. At the same time, the memory fabric market is clearly being pulled toward HBM4-class products by next-generation AI accelerator roadmaps.
SK hynix said in June 2026 that it shipped 12-layer HBM4E samples with 16 Gbps per pin, 48 GB capacity, more than 20% better power efficiency, and 17% lower heat resistance than HBM4 through Advanced MR-MUF packaging. Samsung stated that commercial HBM4 shipments began in February 2026, and Micron stated at GTC 2026 that it entered high-volume HBM4 production for NVIDIA Vera Rubin with 36 GB 12-High stacks and bandwidth above 2.8 TB/s. The ISSCC 2026 paper also showed how HBM4 is bringing more calibration and test sophistication into the die itself, which points to a deeper technical jump than a routine bandwidth lift. Older HBM3, HBM2E, and earlier generations remain in legacy HPC, professional visualization, and other lower-bandwidth environments, but their role inside the memory fabric industry is narrowing as platform roadmaps move upward. The manufacturing dependency is also changing, because HBM4 uses a 4 nm logic base die, which ties production readiness more closely to advanced foundry capacity than earlier generations did.
The 16-High and Above segment is projected to grow at a 26.79% CAGR through 2031, while the 8-High configuration held 42.37% share in 2025. The 8-High format stayed dominant because it aligned with the HBM3E 24 GB standard that powered a large part of the installed AI accelerator base through 2025. That gave the memory fabric market a stable commercial geometry with established yields, packaging familiarity, and broad deployment history. The 12-High tier now represents the main HBM4 production sweet spot, especially for 36 GB stacks entering commercial volumes in 2026 and 2027. Even so, platform requirements are moving beyond what 12-High can deliver when customers want 48 GB and larger capacities per stack.
Samsung stated that it shipped 48 GB 16-High HBM4 samples in 2026, and Micron also shipped 48 GB 16-High HBM4 samples, which confirms that the format has moved from the roadmap stage into customer validation. Applied Materials added that its Producer Avila 2 PECVD system was designed to support reliable stacking at 12-High, 16-High, and future high-layer-count structures, which shows how yield support is moving in step with stack height ambition. The 4-High and Below tier still has a place in edge AI inference and cost-sensitive deployments, but its share is shrinking as mainstream accelerator designs demand more capacity. The memory fabric market is therefore shifting from a geometry led by commercial comfort toward one led by platform need. That change matters because higher stacks increase both revenue opportunity and process difficulty across the supply chain.
Complete Report Scope:
- By HBM Generation
- HBM2E and Earlier Generations
- HBM3
- HBM3E
- HBM4
- HBM4E and Next-Generation HBM
- By Stack Height
- 4-High and Below
- 8-High
- 12-High
- 16-High and Above
- By Memory Capacity per Stack
- Up to 16 GB
- 16 GB to 24 GB
- 24 GB to 36 GB
- Above 36 GB
- By Advanced Packaging Integration Architecture
- 2.5D Silicon-Interposer-Based Integration
- 2.5D Bridge or RDL-Based Advanced Packaging
- 3D Logic-Memory Integration
- Other Advanced Heterogeneous Integration Architectures
- By Application
- AI Training
- AI Inference
- High-Performance Computing and Supercomputing
- Data Center Analytics and In-Memory Computing
- Networking and Telecommunications Infrastructure
- Professional Graphics and Visualization
- By End User
- Hyperscalers and Cloud Service Providers
- AI Cloud and GPU-as-a-Service Providers
- Data Center and Enterprise Infrastructure Operators
- Research Institutions and Supercomputing Centers
- Semiconductor and Accelerator Manufacturers
- Telecommunications and Networking Equipment Providers
- Government, Defense, and Aerospace Organizations
- By Geography
- North America
- United States
- Canada
- Mexico
- Europe
- Germany
- United Kingdom
- France
- Italy
- Rest of Europe
- Asia-Pacific
- China
- Japan
- South Korea
- India
- Southeast Asia
- Rest of Asia-Pacific
- South America
- Middle East and Africa
- North America
Geography Analysis
Asia-Pacific led with 42.33% of the memory fabric market share in 2025 and is also projected to grow at a 27.44% CAGR through 2031. This dual lead reflects the fact that production capability and demand growth are concentrated in the same regional system. South Korea remains central because Samsung and SK Hynix anchor a large share of global HBM supply, and both companies advanced their HBM4 and HBM4E roadmaps in 2026. Taiwan also strengthens Asia-Pacific's position because advanced packaging capacity remains essential to the commercial coupling of HBM and AI accelerators. China adds strong demand through hyperscaler and cloud deployment activity, even though advanced equipment controls continue to limit domestic HBM supply expansion within the period covered by the draft.
North America remained the second-largest regional block in the memory fabric market because it combines hyperscaler spending, processor platform control, and CXL ecosystem development. The United States also anchors platform standards and system design through companies active in CPUs, controllers, switches, and memory products, including Intel, Micron, Marvell, and other infrastructure vendors. Native CXL support in Intel Xeon 6 and active commercialization of switch-layer products support North America's position as the main design and deployment center for disaggregated memory systems. The region, therefore, continues to shape technical direction even when a large share of manufacturing sits in Asia-Pacific.
Europe holds a strategic role in the memory fabric market through supercomputing, enterprise adoption, and standards-based server upgrades. EuroHPC-backed deployments and other institutional HPC programs help sustain demand for HBM-equipped accelerators, especially where performance targets stay close to exascale-class requirements. South America, the Middle East, and Africa remain early-stage regions in this market, with growth coming from cloud buildouts and data center expansion rather than from local HBM supply depth. Their absolute value is expected to rise through 2031, but the larger share of frontier AI infrastructure investment will remain concentrated in Asia-Pacific and North America.
- Intel Corporation
- Advanced Micro Devices, Inc.
- Samsung Electronics Co., Ltd.
- SK hynix Inc.
- Micron Technology, Inc.
- Marvell Technology, Inc.
- Astera Labs, Inc.
- Montage Technology Co., Ltd.
- Credo Technology Group Holding Ltd.
- Rambus Inc.
- Microchip Technology Incorporated
- Teledyne Technologies Incorporated
- Dell Technologies Inc.
- Lenovo Group Limited
- Super Micro Computer, Inc.
- SMART Modular Technologies, Inc.
- Innodisk Corporation
- ScaleFlux, Inc.
- Enfabrica, Inc.
- MemVerge, Inc.
- H3 Platform, Inc.
- XConn Technologies, Inc.
- Penguin Solutions, Inc.
Additional Benefits:
- The market estimate (ME) sheet in Excel format
- 3 months of analyst support
TABLE OF CONTENTS
1 INTRODUCTION
- 1.1 Study Assumptions and Market Definition
- 1.2 Scope of the Study
2 RESEARCH METHODOLOGY
3 EXECUTIVE SUMMARY
4 MARKET LANDSCAPE
- 4.1 Market Overview
- 4.2 Market Drivers
- 4.2.1 Artificial Intelligence Inference Memory Bottlenecks
- 4.2.2 CXL-Based Memory Pooling Reduces Stranded Capacity
- 4.2.3 Total Cost of Ownership Pressure in Hyperscale Data Centers
- 4.2.4 Open Standards Adoption Across CPU, Memory, and Switch Vendors
- 4.2.5 Brownfield Server Refresh Needs for Memory Expansion
- 4.2.6 Emergence of Memory-As-A-Service Architectures
- 4.3 Market Restraints
- 4.3.1 Limited Commercial Availability of Advanced CXL Generations
- 4.3.2 Integration Complexity Across Hardware, Firmware, and Software Stacks
- 4.3.3 Validation and Interoperability Risk Across Multi-Vendor Ecosystems
- 4.3.4 High Dependency on Data Center Refresh Cycles and Capex Approval
- 4.4 Supply Chain Analysis
- 4.5 Regulatory Landscape
- 4.6 Technological Outlook
- 4.7 Porter's Five Forces Analysis
- 4.7.1 Bargaining Power of Suppliers
- 4.7.2 Bargaining Power of Buyers
- 4.7.3 Threat of New Entrants
- 4.7.4 Threat of Substitutes
- 4.7.5 Industry Rivalry
5 MARKET SIZE AND GROWTH FORECASTS (VALUE)
- 5.1 By HBM Generation
- 5.1.1 HBM2E and Earlier Generations
- 5.1.2 HBM3
- 5.1.3 HBM3E
- 5.1.4 HBM4
- 5.1.5 HBM4E and Next-Generation HBM
- 5.2 By Stack Height
- 5.2.1 4-High and Below
- 5.2.2 8-High
- 5.2.3 12-High
- 5.2.4 16-High and Above
- 5.3 By Memory Capacity per Stack
- 5.3.1 Up to 16 GB
- 5.3.2 16 GB to 24 GB
- 5.3.3 24 GB to 36 GB
- 5.3.4 Above 36 GB
- 5.4 By Advanced Packaging Integration Architecture
- 5.4.1 2.5D Silicon-Interposer-Based Integration
- 5.4.2 2.5D Bridge or RDL-Based Advanced Packaging
- 5.4.3 3D Logic-Memory Integration
- 5.4.4 Other Advanced Heterogeneous Integration Architectures
- 5.5 By Application
- 5.5.1 AI Training
- 5.5.2 AI Inference
- 5.5.3 High-Performance Computing and Supercomputing
- 5.5.4 Data Center Analytics and In-Memory Computing
- 5.5.5 Networking and Telecommunications Infrastructure
- 5.5.6 Professional Graphics and Visualization
- 5.6 By End User
- 5.6.1 Hyperscalers and Cloud Service Providers
- 5.6.2 AI Cloud and GPU-as-a-Service Providers
- 5.6.3 Data Center and Enterprise Infrastructure Operators
- 5.6.4 Research Institutions and Supercomputing Centers
- 5.6.5 Semiconductor and Accelerator Manufacturers
- 5.6.6 Telecommunications and Networking Equipment Providers
- 5.6.7 Government, Defense, and Aerospace Organizations
- 5.7 By Geography
- 5.7.1 North America
- 5.7.1.1 United States
- 5.7.1.2 Canada
- 5.7.1.3 Mexico
- 5.7.2 Europe
- 5.7.2.1 Germany
- 5.7.2.2 United Kingdom
- 5.7.2.3 France
- 5.7.2.4 Italy
- 5.7.2.5 Rest of Europe
- 5.7.3 Asia-Pacific
- 5.7.3.1 China
- 5.7.3.2 Japan
- 5.7.3.3 South Korea
- 5.7.3.4 India
- 5.7.3.5 Southeast Asia
- 5.7.3.6 Rest of Asia-Pacific
- 5.7.4 South America
- 5.7.5 Middle East and Africa
- 5.7.1 North America
6 COMPETITIVE LANDSCAPE
- 6.1 Market Concentration
- 6.2 Strategic Moves
- 6.3 Market Share Analysis
- 6.4 Company Profiles (includes Global Level Overview, Market Level Overview, Core Segments, Financials as available, Strategic Information, Market Rank/Share, Products and Services, Recent Developments)
- 6.4.1 Intel Corporation
- 6.4.2 Advanced Micro Devices, Inc.
- 6.4.3 Samsung Electronics Co., Ltd.
- 6.4.4 SK hynix Inc.
- 6.4.5 Micron Technology, Inc.
- 6.4.6 Marvell Technology, Inc.
- 6.4.7 Astera Labs, Inc.
- 6.4.8 Montage Technology Co., Ltd.
- 6.4.9 Credo Technology Group Holding Ltd.
- 6.4.10 Rambus Inc.
- 6.4.11 Microchip Technology Incorporated
- 6.4.12 Teledyne Technologies Incorporated
- 6.4.13 Dell Technologies Inc.
- 6.4.14 Lenovo Group Limited
- 6.4.15 Super Micro Computer, Inc.
- 6.4.16 SMART Modular Technologies, Inc.
- 6.4.17 Innodisk Corporation
- 6.4.18 ScaleFlux, Inc.
- 6.4.19 Enfabrica, Inc.
- 6.4.20 MemVerge, Inc.
- 6.4.21 H3 Platform, Inc.
- 6.4.22 XConn Technologies, Inc.
- 6.4.23 Penguin Solutions, Inc.
7 MARKET OPPORTUNITIES AND FUTURE OUTLOOK
- 7.1 White-Space and Unmet-Need Assessment

 2026年人工智慧高頻寬記憶體全球市場報告
 用於人工智慧(AI)半導體的高頻寬記憶體(HBM)和先進封裝材料:2027-2037 年
 混合儲存立方體:市場佔有率分析、行業趨勢和統計數據、成長預測(2026-2031 年)HBM 8層堆疊與12層堆疊:市場佔有率分析、產業趨勢與統計、成長預測(2026-2031年)HBM CoWoS 包裝產能及供需:市佔率分析、產業趨勢與統計及成長預測(2026-2031 年)HPC/超級計算 HBM:市場佔有率分析、產業趨勢與統計、成長預測(2026-2031 年)中國HBM市場:市場佔有率分析、產業趨勢與統計、成長預測(2026-2031年)
 高頻寬記憶體 (HBM) 市場預測至 2034 年—按產品類型、儲存容量、封裝技術、頻寬、應用、最終用戶和地區分類的全球分析下一代人腦記憶體:市場佔有率分析、行業趨勢和統計數據、成長預測(2026-2031 年)日本HBM市場:市場佔有率分析、產業趨勢與統計、成長預測(2026-2031年)