


 |
市場調查報告書
商品編碼
2099327
歐洲微量元素肥料:市佔率分析、產業趨勢與統計及成長預測(2026-2031 年)Europe Micronutrient Fertilizers - Market Share Analysis, Industry Trends & Statistics, Growth Forecasts (2026 - 2031) |
||||||

※ 本網頁內容可能與最新版本有所差異。詳細情況請與我們聯繫。
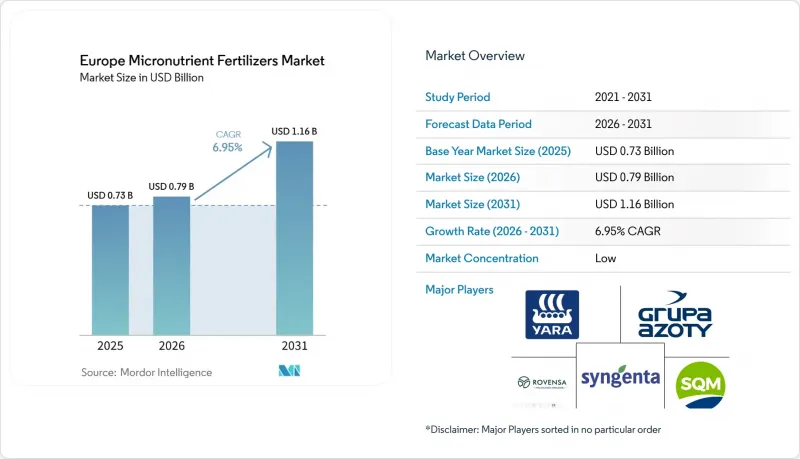
據 Mordor Intelligence 稱,2025 年歐洲微量元素肥料市場價值為 7.3 億美元,預計到 2031 年將從 2026 年的 7.9 億美元成長至 11.6 億美元,預測期(2026-2031 年)複合年成長率為 6.95%。
本報告依產品(硼、銅、鐵等)、應用方法(施肥/灌溉、葉面噴布等)、作物類型(田間作物、園藝作物等)及地區(法國、德國、義大利等)分類。市場預測以價值(美元)和數量(公噸)表示。
歐洲微量元素肥料市場的趨勢與洞察
精密農業驅動的土壤微量元素測繪
土壤分析技術的革新正在改變歐洲微量元素肥料市場中農民的採購方式,使其從統一的施肥方案轉向個性化的、逐塊田地的採購。高密度網格採樣結合GPS和GIS技術,使農民能夠辨識出以往傳統廣譜分析方法無法偵測到的微量元素缺乏症。土壤品質評估與製圖工具(SQAT)計畫於2024年2月啟動,由歐盟資助359萬歐元(約387萬美元),旨在開發用於田間土壤分析的機器人搭載感測器。該計畫計劃於2027年7月前透過七家歐洲中小企業實現商業化,重點關注實際的農業應用,而非僅限於實驗室研究。改良的製圖技術也揭示了南歐和東歐鈣質土壤中鋅和錳的缺乏。在這些地區,實際需求仍落後於田間數據所揭示的農業化學品需求。這對歐洲微量元素肥料市場具有重大意義,因為未來很大一部分需求可能不僅僅是由種植面積的增加所驅動,而是由診斷技術的進步所驅動。
透過通用農業政策(CAP)生態計畫獎勵
2023-2027 年通用農業政策 (CAP) 框架正在歐洲微量元素肥料市場中賦予營養規劃在農場決策中更正式的地位。微量元素的採購擴大與有記錄的土壤檢測、種植計劃以及與農業顧問的諮詢掛鉤,而不再僅僅被視為偶爾的補救措施。歐盟委員會於 2026 年 5 月通過的《肥料行動計畫》呼籲在 CAP 戰略規劃中加強農業諮詢服務,並為提高養分利用效率和生物基投入物提供明確的支持。這項政策方向將鼓勵更頻繁地進行微量元素審計,從而提高在作物出現明顯脅迫症狀之前發現養分缺乏的可能性。它也更重視農場層面的合規性和記錄保存,這往往有利於那些管理良好、能夠更持續地施用特殊養分的生產者。在此背景下,隨著營養管理成為日常農場運作的一部分,而非臨時性的採購決策,歐洲微量元素肥料市場將獲得更穩定的需求基礎。
金屬原物料價格波動
鋅、銅和硫酸錳的價格仍然極易受大宗商品價格波動的影響,這可能會對歐洲微量元素肥料市場的生產商造成利潤壓力。如果投入成本飆升,供應商通常會將部分成本轉嫁給農民,這可能會導致農民推遲購買那些並非迫在眉睫的特殊肥料。鑑於錳也是歐洲微量元素肥料市場中成長最快的產品類別,這種風險尤其顯著。供應中斷和成本上漲可能會減緩這一細分市場的成長,而供應商目前正積極拓展該細分市場。這就造成了一個充滿挑戰的局面:儘管成長潛力依然可觀,但收入前景和實現時間卻高度依賴原料市場狀況。
細分市場分析
截至2025年,鋅佔歐洲微量元素肥料市場佔有率的29.2%。這反映了鋅在小麥、玉米和向日葵種植系統中發揮的廣泛作用,尤其是在鈣質和高pH值土壤中,植物對鋅的吸收受到結構性限制。由於鋅在農業化學品領域具有廣泛的應用,因此它在歐洲微量元素肥料市場繼續佔據核心地位,因為這個問題根植於土壤化學和農業實踐。預計2026年至2031年,錳的複合年成長率將達到7.90%,這主要得益於溫室和無土栽培系統,這些系統由於重複種植週期而需要持續補充錳。銅和鐵也發揮不同的作用;在易缺銅地區,銅與穀物和油菜籽密切相關,而鐵螯合劑則廣泛用於鹼性果園、葡萄園和蔬菜種植系統。
硼在區域內幾個大型農業國家對授粉敏感的作物(如油菜、向日葵和甜菜)中仍然發揮著至關重要的作用。雖然鉬的絕對需求量仍然小規模,但它在豆科作物種植中佔據穩定的地位。錳產業也面臨獨特的採購風險,與其他一些產品線相比,其原料規劃風險更高。此外,利用土壤品質分析工具(SQAT)進行精確測繪有望提高識別所有作物系統中微量元素缺乏地塊的準確性,從而促進歐洲微量元素肥料行業更有針對性地創造需求。
其他好處:
- Excel格式的市場預測(ME)表
- 3個月的分析師支持
目錄
第1章:引言
- 研究假設和市場定義
- 調查範圍
- 調查方法
第2章:本報告的內容
第3章:執行摘要和主要發現
第4章 主要產業的發展趨勢
- 主要農作物種植面積
- 田間作物
- 園藝作物
- 平均施肥量
- 微量營養素
- 田間作物
- 園藝作物
- 微量營養素
- 配備灌溉設施的農田
- 法律規範
- 價格分析
- 市場促進因素
- 精密農業驅動的土壤微量元素測繪
- CAP生態計劃
- 對高附加價值園藝作物的需求不斷成長
- 轉為螯合液體製劑和水溶性製劑
- 數位農業諮詢平台正在推動農業技術的普及。
- 英國脫歐後,微量營養素在英國迅速獲得批准
- 市場限制因素
- 金屬原物料價格波動
- 歐盟重金屬污染物基準值
- 減少外部施用的生物強化政策
- 與生技藥品和生物肥料的競爭
第5章 市場規模與成長預測
- 依產品
- 硼
- 銅
- 鐵
- 錳
- 鉬
- 鋅
- 其他
- 透過應用方法
- 施肥和灌溉
- 葉面噴布
- 土壤
- 按作物類型
- 田間作物
- 園藝作物
- 草坪和觀賞植物
- 按地區
- 法國
- 德國
- 義大利
- 荷蘭
- 俄羅斯
- 西班牙
- 烏克蘭
- 英國
- 其他歐洲國家
第6章 競爭情勢
- 市場集中度
- 策略趨勢
- 市佔率分析
- 公司簡介
- Yara International ASA
- Compo Expert GmbH(Grupa Azoty SA)
- Sociedad Quimica y Minera de Chile SA
- Trade Corporation International(Rovensa Group)
- Valagro SpA(Syngenta Group)
- BASF SE
- Triton Partners(Fertiberia)
- Haifa Group
- ICL Group Ltd.
- K+S Aktiengesellschaft
- Nutrien Ltd.
- Timac Agro SAS(Groupe Roullier)
- Verdesian Life Sciences LLC(AEA Investors)
- EuroChem Group AG
- AGLUKON Spezialduenger GmbH and Co. KG
第7章相關人員的關鍵策略問題
According to Mordor Intelligence, the Europe micronutrient fertilizers market size was valued at USD 0.73 billion in 2025 and is estimated to grow from USD 0.79 billion in 2026 to reach USD 1.16 billion by 2031, at a CAGR of 6.95% during the forecast period (2026-2031).
This report is Segmented by Product (Boron, Copper, Iron, and More), by Application Mode (Fertigation, Foliar, and More), by Crop Type (Field Crops, Horticultural Crops, and More), and by Geography (France, Germany, Italy, and More). The Market Forecasts are Provided in Terms of Value (USD) and Volume (Metric Tons).
Europe Micronutrient Fertilizers Market Trends and Insights
Precision Agriculture Led Soil Micronutrient Mapping
Variable-rate soil testing is changing how farmers purchase micronutrients in the Europe micronutrient fertilizer market, replacing blanket programs with field-specific purchases. GPS and GIS-linked sampling at fine grid density is helping farms identify micronutrient deficiencies that were not visible under broader testing practices. The Soil Quality Assessment and mapping Tool (SQAT) project, active since February 2024 with EUR 3.59 million (USD 3.87 million) in EU funding, is developing robot-mounted sensors for in situ soil analysis. The project is targeting commercialization through 7 European SMEs by July 2027, keeping the technology application focused on practical farm use rather than laboratory work alone. Improved mapping is also revealing zinc and manganese deficiencies in calcareous soils across Southern and Eastern Europe, where visible demand still trails the agronomic need that field data is beginning to expose. For the Europe micronutrient fertilizer market, this is significant because a larger share of future demand may be driven by improved diagnosis rather than simple acreage expansion.
Common Agricultural Policy Eco-Scheme Incentives
The CAP 2023-2027 framework is making nutrient planning a more formal part of farm decision-making across the European micronutrient fertilizer market. Micronutrient purchases are increasingly tied to documented soil testing, crop planning, and advisory review, rather than being treated as occasional corrective inputs. The European Commission's Fertilizer Action Plan, adopted in May 2026, calls for stronger Farm Advisory Services within CAP Strategic Plans and explicit support for nutrient use efficiency and bio-based inputs. This policy direction supports more regular micronutrient audits and increases the likelihood that deficiencies are identified before visible crop stress occurs. It also places greater emphasis on compliance and recordkeeping at the farm level, which tends to favor better-organized growers that apply specialty nutrition more consistently. In this context, the European micronutrient fertilizer market gains a more stable demand base, as nutrient management becomes part of routine farm administration rather than an irregular purchase decision.
Metal-Based Raw Material Price Volatility
Prices for zinc, copper, and manganese sulfate remain exposed to commodity fluctuations, which can narrow manufacturer margins in the Europe micronutrient fertilizer market. When input costs rise sharply, suppliers often pass part of the increase to farmers, which can delay purchases of specialty products not viewed as immediately necessary. This exposure is significant given that manganese is also the fastest-growing product segment in the Europe micronutrient fertilizer market. Any supply disruption or cost increase can slow the segment that suppliers are most actively trying to scale. This creates a challenging dynamic where growth remains attractive, but earnings visibility and timing are heavily dependent on raw material conditions.
Other drivers and restraints analyzed in the detailed report include:
- Rising Demand for High-Value Horticultural Crops
- Shift Toward Chelated Liquid and Water-Soluble Formulations
- Competition from Biological Inoculants and Biofertilizers
For complete list of drivers and restraints, kindly check the Table Of Contents.
Segment Analysis
Zinc held 29.2% of the Europe micronutrient fertilizer market share in 2025, reflecting its broad role across wheat, maize, and sunflower systems in calcareous and high-pH soils where plant availability is structurally constrained. This wide agronomic relevance keeps zinc central to the Europe micronutrient fertilizer market, as the issue is rooted in soil chemistry as much as in farm practice. Manganese is anticipated to expand at a 7.90% CAGR from 2026 to 2031, supported by greenhouse horticulture and soilless systems where repeated crop cycles require constant replenishment. Copper and iron also retain clear roles, with copper linked to cereals and oilseed rape in deficiency-prone areas and iron chelates used widely in alkaline orchards, vineyards, and vegetable systems.
Boron remains important in pollination-sensitive crops such as oilseed rape, sunflower, and sugar beet across several large farming countries in the region. Molybdenum remains smaller in absolute demand but holds a stable place in legume cultivation. The manganese segment also carries a distinct procurement risk, making raw material planning more exposed than in several other product lines. The Soil Quality Analysis Tool (SQAT) precision mapping effort is also likely to improve the identification of micronutrient-deficient parcels across crop systems, supporting more targeted demand across the Europe micronutrient fertilizer industry.
Complete Report Scope:
- Product
- Boron
- Copper
- Iron
- Manganese
- Molybdenum
- Zinc
- Others
- Application Mode
- Fertigation
- Foliar
- Soil
- Crop Type
- Field Crops
- Horticultural Crops
- Turf and Ornamental
- By Geography
- France
- Germany
- Italy
- Netherlands
- Russia
- Spain
- Ukraine
- United Kingdom
- Rest Of Europe
List of Companies Covered in this Report:
- Yara International ASA
- Compo Expert GmbH (Grupa Azoty S.A.)
- Sociedad Quimica y Minera de Chile S.A.
- Trade Corporation International (Rovensa Group)
- Valagro S.p.A. (Syngenta Group)
- BASF SE
- Triton Partners (Fertiberia)
- Haifa Group
- ICL Group Ltd.
- K+S Aktiengesellschaft
- Nutrien Ltd.
- Timac Agro SAS (Groupe Roullier)
- Verdesian Life Sciences LLC (AEA Investors)
- EuroChem Group AG
- AGLUKON Spezialduenger GmbH and Co. KG
Additional Benefits:
- The market estimate (ME) sheet in Excel format
- 3 months of analyst support
TABLE OF CONTENTS
1 INTRODUCTION
- 1.1 Study Assumptions and Market Definition
- 1.2 Scope of the Study
- 1.3 Research Methodology
2 REPORT OFFERS
3 EXECUTIVE SUMMARY AND KEY FINDINGS
4 KEY INDUSTRIES TRENDS
- 4.1 Acreage of Major Crop Types
- 4.1.1 Field Crops
- 4.1.2 Horticultural Crops
- 4.2 Average Nutrient Application Rates
- 4.2.1 Micronutrients
- 4.2.1.1 Field Crops
- 4.2.1.2 Horticultural Crops
- 4.2.1 Micronutrients
- 4.3 Agricultural Land Equipped for Irrigation
- 4.4 Regulatory Framework
- 4.5 Pricing Analysis
- 4.6 Market Drivers
- 4.6.1 Precision agriculture led soil micronutrient mapping
- 4.6.2 CAP eco schemes initiative
- 4.6.3 Rising demand for high-value horticultural crops
- 4.6.4 Shift toward chelated liquid and water-soluble formulations
- 4.6.5 Digital agronomic advisory platforms boosting adoption
- 4.6.6 Post-brexit fast-track micronutrient registrations in the United Kingdom
- 4.7 Market Restraints
- 4.7.1 Metal-based raw material price volatility
- 4.7.2 European union heavy metal contaminant limit
- 4.7.3 Bio-fortification policies reducing external application
- 4.7.4 Competition from biological inoculants and biofertilizers
5 MARKET SIZE AND GROWTH FORECASTS (VALUE AND VOLUME)
- 5.1 Product
- 5.1.1 Boron
- 5.1.2 Copper
- 5.1.3 Iron
- 5.1.4 Manganese
- 5.1.5 Molybdenum
- 5.1.6 Zinc
- 5.1.7 Others
- 5.2 Application Mode
- 5.2.1 Fertigation
- 5.2.2 Foliar
- 5.2.3 Soil
- 5.3 Crop Type
- 5.3.1 Field Crops
- 5.3.2 Horticultural Crops
- 5.3.3 Turf and Ornamental
- 5.4 By Geography
- 5.4.1 France
- 5.4.2 Germany
- 5.4.3 Italy
- 5.4.4 Netherlands
- 5.4.5 Russia
- 5.4.6 Spain
- 5.4.7 Ukraine
- 5.4.8 United Kingdom
- 5.4.9 Rest Of Europe
6 COMPETITIVE LANDSCAPE
- 6.1 Market Concentration
- 6.2 Strategic Moves
- 6.3 Market Share Analysis
- 6.4 Company Profiles (Includes Global Overview, Market Overview, Core Segments, Financials, Strategic Information, Market Rank/Share, Products and Services, and Recent Developments)
- 6.4.1 Yara International ASA
- 6.4.2 Compo Expert GmbH (Grupa Azoty S.A.)
- 6.4.3 Sociedad Quimica y Minera de Chile S.A.
- 6.4.4 Trade Corporation International (Rovensa Group)
- 6.4.5 Valagro S.p.A. (Syngenta Group)
- 6.4.6 BASF SE
- 6.4.7 Triton Partners (Fertiberia)
- 6.4.8 Haifa Group
- 6.4.9 ICL Group Ltd.
- 6.4.10 K+S Aktiengesellschaft
- 6.4.11 Nutrien Ltd.
- 6.4.12 Timac Agro SAS (Groupe Roullier)
- 6.4.13 Verdesian Life Sciences LLC (AEA Investors)
- 6.4.14 EuroChem Group AG
- 6.4.15 AGLUKON Spezialduenger GmbH and Co. KG
7 KEY STRATEGIC QUESTIONS FOR STAKEHOLDERS

 中東和非洲微量元素肥料:市場佔有率分析、行業趨勢和統計數據以及成長預測(2026-2031 年)北美微量元素肥料:市佔率分析、產業趨勢與統計及成長預測(2026-2031 年)南美洲微量元素肥料:市佔率分析、產業趨勢與統計及成長預測(2026-2031 年)美國微量元素肥料:市佔率分析、產業趨勢與統計及成長預測(2026-2031 年)亞太地區微量元素肥料:市佔率分析、產業趨勢與統計及成長預測(2026-2031)印度微量元素肥料:市場佔有率分析、產業趨勢與統計及成長預測(2026-2031)中國微量元素肥料:市佔率分析、產業趨勢與統計及成長預測(2026-2031)微量元素肥料:市佔率分析、產業趨勢與統計、成長預測(2026-2031)
 2026年全球微量元素肥料市場報告
 微量元素肥料市場報告:趨勢、預測與競爭分析(至2031年)